. 2015 Apr 21;11(4):e1004810.
doi: 10.1371/journal.ppat.1004810. eCollection 2015 Apr.

Spatial structure, transmission modes and the evolution of viral exploitation strategies

Affiliations

Spatial structure, transmission modes and the evolution of viral exploitation strategies

Thomas W Berngruber et al. PLoS Pathog. .

Abstract

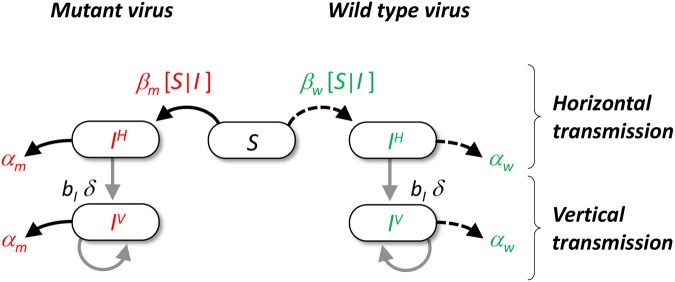
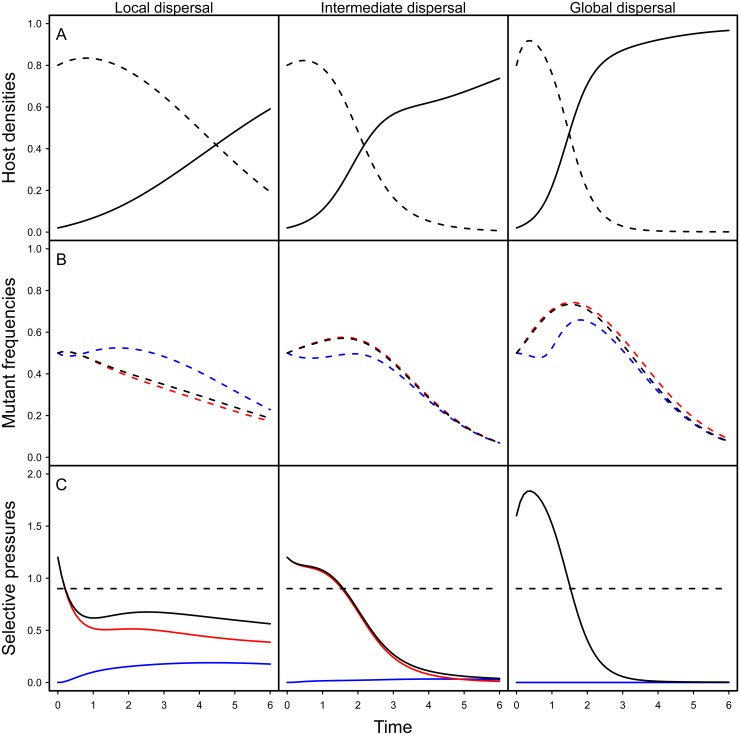
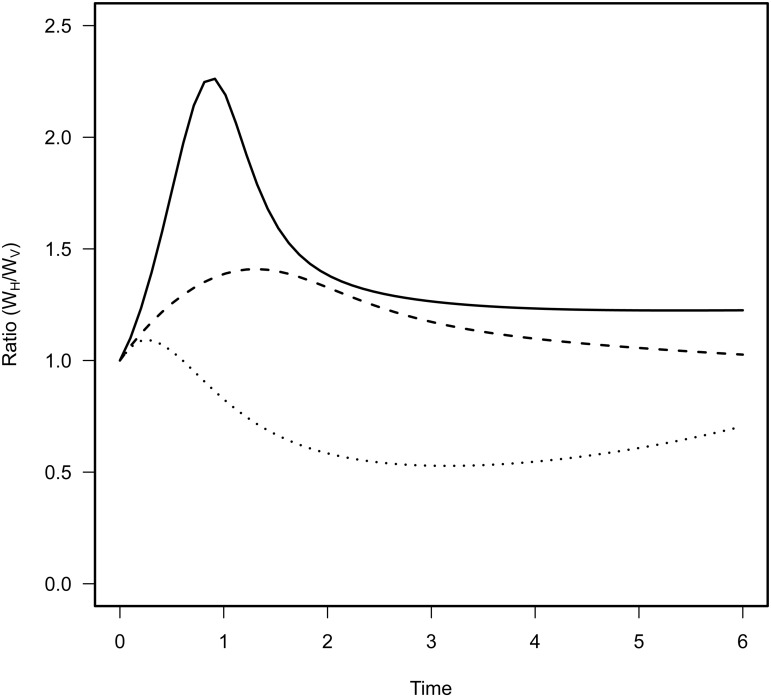
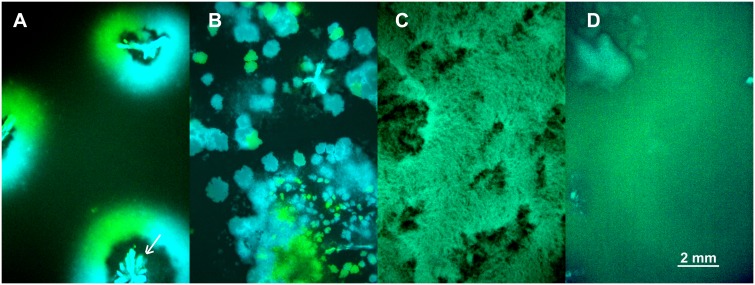
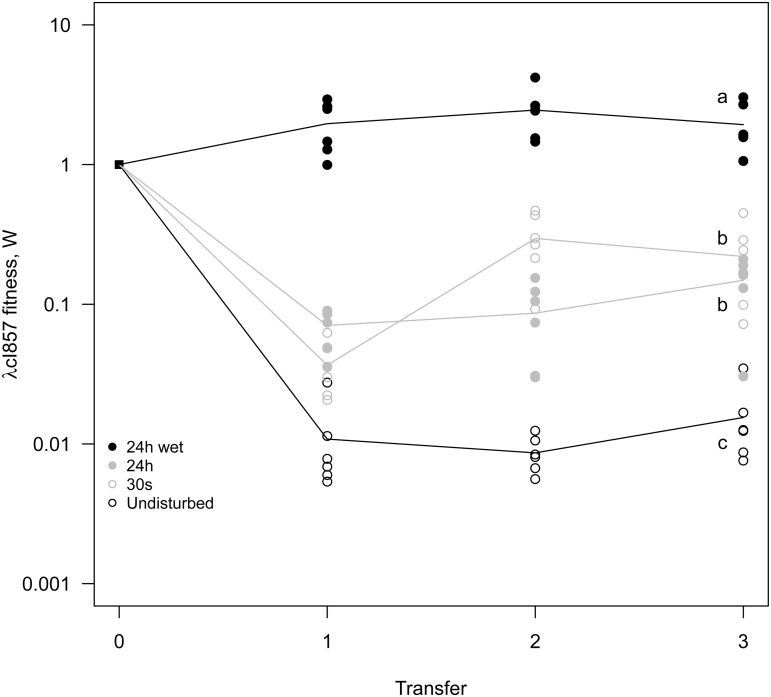
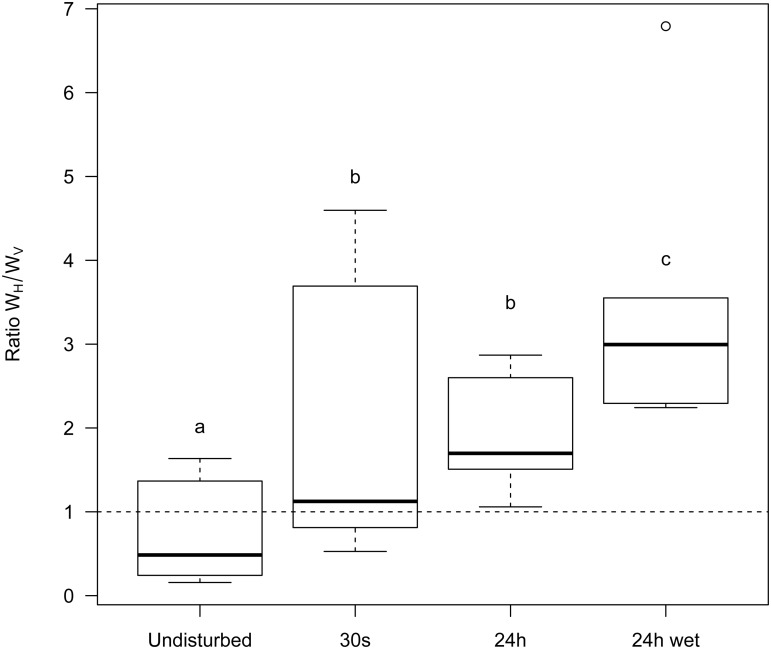
Spatial structure and local migration are predicted to promote the evolution of less aggressive host exploitation strategies in horizontally transmitted pathogens. Here we explore the effect of spatial structure on the evolution of pathogens that can use both horizontal and vertical routes of transmission. First, we analyse theoretically how vertical transmission can alter evolutionary trajectories and confirm that space can impede the spread of virulent pathogens. Second, we test this prediction using the latent phage λ which transmits horizontally and vertically in Escherichia coli populations. We show that the latent phage λ wins competition against the virulent mutant λcI857 in spatially structured epidemics, but loses when spatial structure is eroded. The vertical transmission of phage λ immunizes its local host pool against superinfection and prevents the spread of the virulent λcI857. This effect breaks down when mixing facilitates horizontal transmission to uninfected hosts. We thus confirm the importance of spatial structure for the evolutionary maintenance of prudent infection strategies in latent viruses.


Conflict of interest statement

The authors have declared that no competing interests exist.

Figures

Fig 1
Fig 1. Schematic representation of the pathogen life cycle.
In our model we assume that hosts can either be uninfected or infected by the wild type (in green) or a mutant genotype (in red). Transmission can take two different routes. Horizontal transmission occurs between a susceptible host and an infected host with genotype i with rate β i[I|S] (see supporting information Theory in S1 Text). Vertical transmission occurs when and infected host reproduces in an empty site with rate b I δq 0/i, where b I is the reproduction rate of infected hosts, δ is the fidelity of vertical transmission and q 0/i measures the average local density of empty sites around hosts infected with genotype i. Among hosts infected by the same genotype we distinguish hosts that got infected horizontally (noted IiH) or vertically (noted IiV). Both types of hosts can reproduce and have an increased mortality rate α i (i.e. virulence) due to the infection with genotype i.
Fig 2
Fig 2. Effect of spatial structure on epidemiology and evolution in the model.
The top figures (A) show simulation results for the density of susceptible (dashed line) and infected hosts (full line) for different level of mixing (left: no mixing (g H = g P = 0), middle: intermediate (g H = g P = 0.5), right: full mixing (g H = g P = 1)). The figures in the middle (B) show simulation results for the change in mutant frequency in the total pathogen population (black), in the horizontally infected hosts (red) or in vertically infected hosts (blue) for different levels of mixing. The figures at the bottom (C) indicate the values of the different components of the selection coefficient identified in Eq (1): the horizontal transmission term (red), the vertical transmission component (blue) and the sum of the previous two terms (black) and the magnitude of the cost of virulence (dashed black). Note that the global mutant frequency increases only when the sum of the transmission terms (full black line) is higher than the cost of virulence (dashed line). Our simulations are the result of the numerical integration of the deterministic approximation of the full spatial model, using Improved Pair Approximation (IPA; [31]) with parameters ϕ = 1/6 and θ = 2/5, which correspond to a triangular lattice (each site has 6 neighbours, see [31] for details). Parameters: α w = 0.1, α m = 1, β w = 2, β m = 3.5, δ = 0.99, d = 0.01. Initial conditions: S(0) = 0.8, IwH(0)=ImH(0)=0.01,IwV(0)=ImV(0)=105.
Fig 3
Fig 3. Effect of mixing on the relative contribution of horizontal (WH) and vertical transmission (WV) to the fitness of the virulent mutant in the model.
Each curve corresponds to different levels of mixing: no mixing g H = g P = 0 (dotted line), intermediate mixing g H = g P = 0.5 (dashed line) and full mixing with g H = g P = 1 (full line). The contribution of horizontal transmission is maximal in the early stage of the epidemic because many susceptible hosts are still available. More mixing increases the contribution of horizontal transmission to the fitness of the mutant throughout the epidemics.
Fig 4
Fig 4. Competition of fluorescently marked virus (λCFP and λYFP—blue and green areas) during invasion into uninfected cells (black areas) at different degrees of mixing (undisturbed, 30s, 24h, 24h-wet).
(A) Undisturbed environment—Circular epidemic front segregates into single-virus sectors (blue and green sectors, white arrow depicts the centre of epidemic inoculation). (B) 30s disturbance—Epidemic clusters that are dominated by a single type of virus appear. (C,D) Longer periods of disturbance (24h) and a liquid surface layer (24h-wet) progressively homogenize the spatial genetic structure of virus types.
Fig 5
Fig 5. Mixing selects for virulence.
A 1:1 mixture of temperate λ and its virulent mutant λcI857 was used to seed spatial epidemics. Spatial structure was disturbed to different degree (undisturbed, 30s, 24h, 24h-wet) and transferred onto a fresh biofilm of susceptible hosts for 3 consecutive days. Disturbance of the epidemic structure has a strong effect on the competitive fitness of the virulent λcI857. The undisturbed environment strongly selects against virulence whereas in a well-mixed environment (24h-wet) virulence is beneficial. As expected, intermediate levels of mixing (30s, 24h) lead to intermediate fitness of λcI857. Symbols represent 6 replications for each mixing treatment (with 3 independent replicates for each marker-mutant combination).
Fig 6
Fig 6. Effect of mixing on the relative contribution of horizontal (WH) and vertical transmission (WV) to the fitness of the virulent λcI857.
More mixing (from undisturbed, 30s, 24h to 24h-wet) increases the fitness contribution of horizontal transmission to the competitive ability of λcI857 (WH) relative to the fitness contribution of vertical transmission (WV) (see Fig 3). Each box represents the median, the first and the third quartiles. Dashed lines delimit 1.5 times the inter-quartile range, above which individual counts are considered outliers and marked as empty circles.

Similar articles

Cited by

References

    1. Hardin G. (1968). The Tragedy of the Commons. The population problem has no technical solution; It Requires a Fundamental Extension in Morality. Science 162(3859): 1243–1248. - PubMed
    1. Gandon S. and Day T. (2009). Evolutionary Epidemiology and the Dynamics of Adaptation. Evolution 63(4): 826–838. 10.1111/j.1558-5646.2009.00609.x - DOI - PubMed
    1. Anderson R.M., and May R.M. (1982). Coevolution of hosts and parasites. Parasitology 85: 411–426. - PubMed
    1. Frank S. A. (1996). Models of parasite virulence. The Q. Rev. Biol. 71(1): 37–78. - PubMed
    1. Dieckmann U., Metz J.A.J., Sabelis M.W., and Sigmund K. (2002). Adaptive Dynamics of Infectious Diseases: In Pursuit of Virulence Management. Cambridge University Press, Cambridge MA.

Publication types

MeSH terms

LinkOut - more resources