Simultaneous carotid PET/MR: feasibility and improvement of magnetic resonance-based attenuation correction
- PMID: 25898892
- PMCID: PMC4618272
- DOI: 10.1007/s10554-015-0661-7
Simultaneous carotid PET/MR: feasibility and improvement of magnetic resonance-based attenuation correction
Abstract
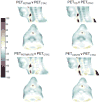
Errors in quantification of carotid positron emission tomography (PET) in simultaneous PET/magnetic resonance (PET/MR) imaging when not incorporating bone in MR-based attenuation correction (MRAC) maps, and possible solutions, remain to be fully explored. In this study, we demonstrated techniques to improve carotid vascular PET/MR quantification by adding a bone tissue compartment to MRAC maps and deriving continuous Dixon-based MRAC (MRACCD) maps. We demonstrated the feasibility of applying ultrashort echo time-based bone segmentation and generation of continuous Dixon MRAC to improve PET quantification on five subjects. We examined four different MRAC maps: system standard PET/MR MRAC map (air, lung, fat, soft tissue) (MRACPET/MR), standard PET/MR MRAC map with bone (air, lung, fat, soft tissue, bone) (MRACPET/MRUTE), MRACCD map (no bone) and continuous Dixon-based MRAC map with bone (MRACCDUTE). The same PET emission data was then reconstructed with each respective MRAC map and a CTAC map (PETPET/MR, PETPET/MRUTE, PETCD, PECDUTE) to assess effects of the different attenuation maps on PET quantification in the carotid arteries and neighboring tissues. Quantitative comparison of MRAC attenuation values for each method compared to CTAC showed small differences in the carotid arteries with UTE-based segmentation of bone included and/or continuous Dixon MRAC; however, there was very good correlation for all methods in the voxel-by-voxel comparison. ROI-based analysis showed a similar trend in the carotid arteries with the lowest correlation to PETCTAC being PETPETMR and the highest correlation to PETCTAC being PETCDUTE. We have demonstrated the feasibility of applying UTE-based segmentation and continuous Dixon MRAC maps to improve carotid PET/MR vascular quantification.
Keywords: Attenuation correction; Carotid arteries; Dixon; PET/MR; Ultrashort echo time.
Figures


References
-
- Fayad ZA, Mani V, Woodward M, Kallend D, Abt M, Burgess T, Fuster V, Ballantyne CM, Stein Ea, Tardif JC, Rudd JHF, Farkouh ME, Tawakol A. Safety and efficacy of dalcetrapib on atherosclerotic disease using novel non-invasive multimodality imaging (dal-PLAQUE): a randomised clinical trial. Lancet. 2011 Oct;378(9802):1547–59. - PMC - PubMed
-
- Mani V, Woodward M, Samber D, Bucerius J, Tawakol A, Kallend D, Rudd JHF, Abt M, Fayad ZA. Predictors of change in carotid atherosclerotic plaque inflammation and burden as measured by 18-FDG-PET and MRI, respectively, in the dal-PLAQUE study. Int J Cardiovasc Imaging. 2014 Mar;30(3):571–82. - PMC - PubMed
-
- Heusch P, Buchbender C, Beiderwellen K, Nensa F, Hartung-Knemeyer V, Lauenstein TC, Bockisch A, Forsting M, Antoch G, Heusner Ta. Standardized uptake values for [(18)F] FDG in normal organ tissues: Comparison of whole-body PET/CT and PET/MRI. Eur J Radiol. 2013 Feb;:1–7. - PubMed
-
- Drzezga A, Souvatzoglou M, Eiber M, Beer AJ, Fürst S, Martinez-Möller A, Nekolla SG, Ziegler S, Ganter C, Rummeny EJ, Schwaiger M. First clinical experience with integrated whole-body PET/MR: comparison to PET/CT in patients with oncologic diagnoses. J Nucl Med. 2012 Jun;53(6):845–55. - PubMed
-
- Samarin A, Burger C, Wollenweber SD, Crook DW, Burger Ia, Schmid DT, Schulthess GK, Kuhn FP. PET/MR imaging of bone lesions – implications for PET quantification from imperfect attenuation correction. Eur J Nucl Med Mol Imaging. 2012 Apr; - PubMed
Publication types
MeSH terms
Grants and funding
LinkOut - more resources
Full Text Sources
Other Literature Sources
Medical

