. 2015 Jul;27(7):981-9.
doi: 10.1111/nmo.12572. Epub 2015 Apr 20.

Utilizing functional lumen imaging probe topography to evaluate esophageal contractility during volumetric distention: a pilot study

Affiliations

Utilizing functional lumen imaging probe topography to evaluate esophageal contractility during volumetric distention: a pilot study

D A Carlson et al. Neurogastroenterol Motil. 2015 Jul.

Abstract

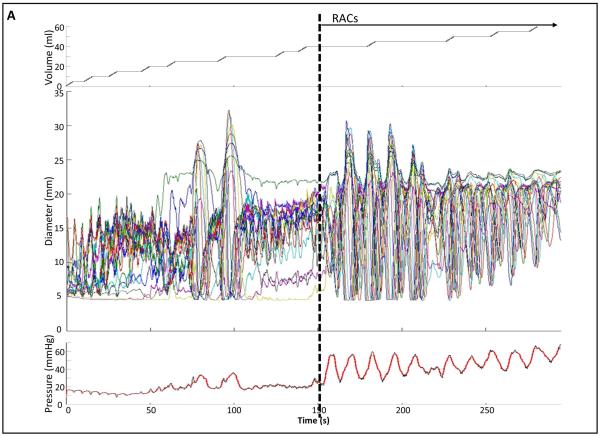
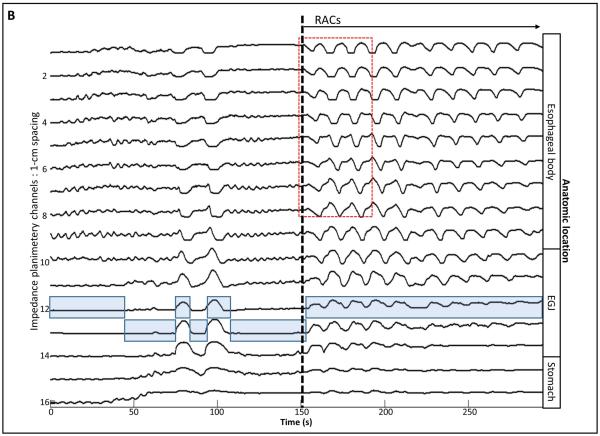
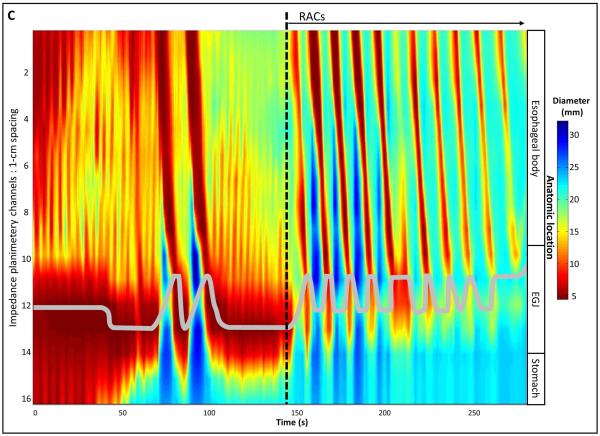
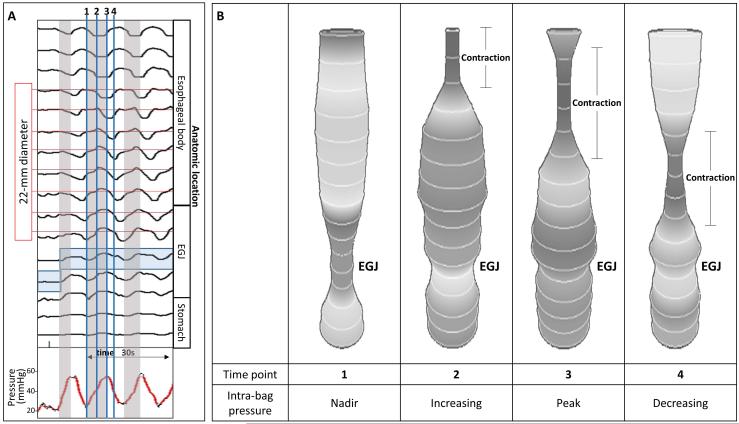
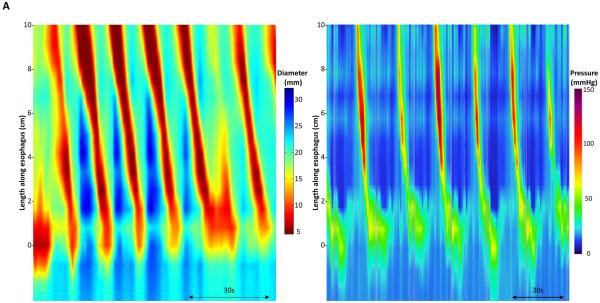
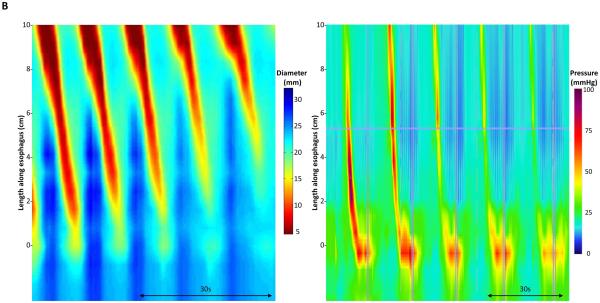
Background: The functional lumen imaging probe (FLIP) measures luminal cross-sectional area and pressure during volumetric distension. By applying novel customized software to produce FLIP topography plots, organized esophageal contractility can be visualized and analyzed. We aimed to describe the stimulus thresholds and contractile characteristics for distension-induced esophageal body contractility using FLIP topography in normal controls.

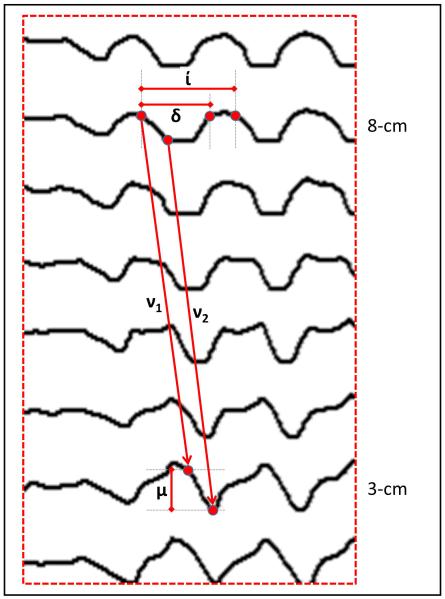
Methods: Ten healthy controls were evaluated during endoscopy with FLIP. During stepwise bag distension, simultaneous intra-bag pressure and luminal diameter measurements were obtained and exported to a MatLab program to generate FLIP topography plots. The distension volume, intra-bag pressure, and maximum esophageal body diameters were measured for the onset and cessation of repetitive antegrade contractions (RACs). Contraction duration, interval, magnitude, and velocity were measured at 8 and 3-cm proximal to the esophagogastric junction.

Key results: Eight of ten subjects demonstrated RACs at a median onset volume of 29 mL (IQR: 25-38.8), median intra-bag pressure of 10.7 mmHg (IQR: 8.6-15.9), and median maximum esophageal body diameter of 18.5 mm (IQR: 17.5-19.6). Cessation of RACs occurred prior to completion of the distension protocol in three of the eight subjects exhibiting RACs. Values of the RAC-associated contractile metrics were also generated to characterize these events.

Conclusions & inferences: Distension-induced esophageal contractions can be assessed utilizing FLIP topography. RACs are a common finding in asymptomatic controls in response to volume distention and have similar characteristics to secondary peristalsis and repetitive rapid swallows.

Keywords: esophageal motility; functional lumen imaging probe; impedance planimetry; secondary peristalsis.


Figures

Figure 1
Figure 1. Example of FLIP topography
Data output generated by the customized program over the course of the study protocol from a single subject are displayed: 1A) Distension volume (top), 16-channels of luminal diameters (middle), and intra-bag pressure (bottom), 1B) 16 channels of diameter changes are represented as line tracings as the measurement channels are now axially located along the esophagus, and 1C) topographic representation of interpolated diameter changes using a color scale. The esophagogastric (EGJ) midline is represented by the superimposed blue boxes in 1B and gray line in 1C. The initiation of repetitive, antegrade contractions (RACs) is illustrated with vertical dashed lines. In this subject, RACs onset occurs at a distension volume of 40-ml and continues through the end of the study protocol. The section within the red box (1B) is enlarged in Figure 2. EGJ – esophagogastric junction. Figure used with permission from the Esophageal Center at Northwestern.
Figure 2
Figure 2. FLIP topography metrics
Metrics were measured at the impedance planimetry channels at 5 and 10 cm above the EGJ midline to represent the esophageal body 3 and 8 cm proximal to the EGJ. Contraction duration (δ) was defined as the time from the time of initial decrease in diameter to the time of diameter return to baseline. Contraction interval (í) was the duration between the start of consecutive, repetitive contractions. Contraction magnitude (μ) was the change in diameter from baseline to the nadir diameter. Contraction wave velocity was measured: 1) as the slope of the line from the onset of the contraction (v1), and 2) from the onset of the minimal contraction diameters (v2). Figure used with permission from the Esophageal Center at Northwestern.
Figure 3
Figure 3. Contraction-associated intra-bag pressure changes
A) Intra-bag pressure (bottom) and 16-channel diameter changes of the first three repetitive antegrade contractions (RACs) in the same subject depicted in Figures 1 and 2. The gray-shaded boxes indicate times during which the intra-bag pressure is increasing. The 22-mm diameter limit is indicated by the horizontal red lines. The shaded blue box represents the esophagogastric (EGJ) midline. The blue vertical lines indicate the time points depicted in Figure 3B. B) Screen shot images taken during the FLIP study representing the bag diameters at time points related to contraction-associated intra-bag pressures. The increase in pressure occurred during periods of decreasing diameter (contraction) in the proximal impedance channels (representing the mid-esophageal body), but before the contraction proximal to the EGJ (where diameters increased, often to greater than 22 mm, as intra-bag pressure increased). Increasing pressure also coincided with increasing diameter within the EGJ. Figure used with permission from the Esophageal Center at Northwestern.
Figure 4
Figure 4. Esophageal motility assessment with FLIP topography and esophageal pressure topography (EPT)
Topographic plots generated using interpolated esophageal diameter (Left: FLIP topography) and pressures (Right: EPT, generated using high-resolution manometry) of two subjects: Figure 4A is the same subject represented in Figures 1-3; Figure 4B is another subject. The proximal portion of the EPT plot has been removed for comparative display. Though the FLIP topography plots represent distension-induced contractions and the EPT plots represent the peristaltic response to voluntary swallows of 5-ml water, the similarities in motility between FLIP topography and EPT can be appreciated. Figure used with permission from the Esophageal Center at Northwestern.

References

    1. McMahon BP, Frokjaer JB, Drewes AM, Gregersen H. A new measurement of oesophago-gastric junction competence. Neurogastroenterology and motility : the official journal of the European Gastrointestinal Motility Society. 2004;16(5):543–6. - PubMed
    1. Rohof WO, Hirsch DP, Kessing BF, Boeckxstaens GE. Efficacy of treatment for patients with achalasia depends on the distensibility of the esophagogastric junction. Gastroenterology. 2012;143(2):328–35. - PubMed
    1. Pandolfino JE, de Ruigh A, Nicodeme F, Xiao Y, Boris L, Kahrilas PJ. Distensibility of the esophagogastric junction assessed with the functional lumen imaging probe (FLIP) in achalasia patients. Neurogastroenterology and motility : the official journal of the European Gastrointestinal Motility Society. 2013;25(6):496–501. - PMC - PubMed
    1. Teitelbaum EN, Soper NJ, Pandolfino JE, Kahrilas PJ, Hirano I, Boris L, Nicodeme F, Lin Z, et al. Esophagogastric junction distensibility measurements during Heller myotomy and POEM for achalasia predict postoperative symptomatic outcomes. Surgical endoscopy. 2014 - PMC - PubMed
    1. Teitelbaum EN, Soper NJ, Pandolfino JE, Kahrilas PJ, Boris L, Nicodeme F, Lin Z, Hungness ES. An extended proximal esophageal myotomy is necessary to normalize EGJ distensibility during Heller myotomy for achalasia, but not POEM. Surgical endoscopy. 2014;28(10):2840–7. - PMC - PubMed

Publication types