. 2015 Jun 15;308(12):E1043-55.
doi: 10.1152/ajpendo.00570.2014. Epub 2015 Apr 21.

Insulin-independent reversal of type 1 diabetes in nonobese diabetic mice with brown adipose tissue transplant

Affiliations

Insulin-independent reversal of type 1 diabetes in nonobese diabetic mice with brown adipose tissue transplant

Subhadra C Gunawardana et al. Am J Physiol Endocrinol Metab. .

Abstract

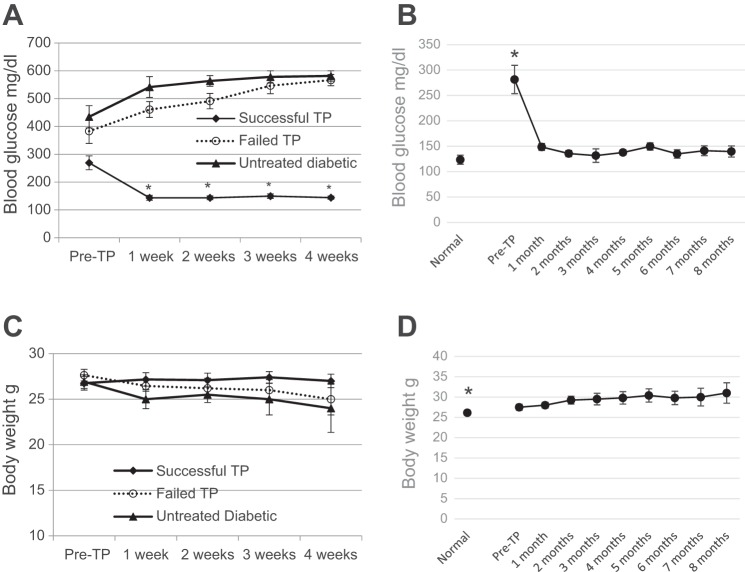
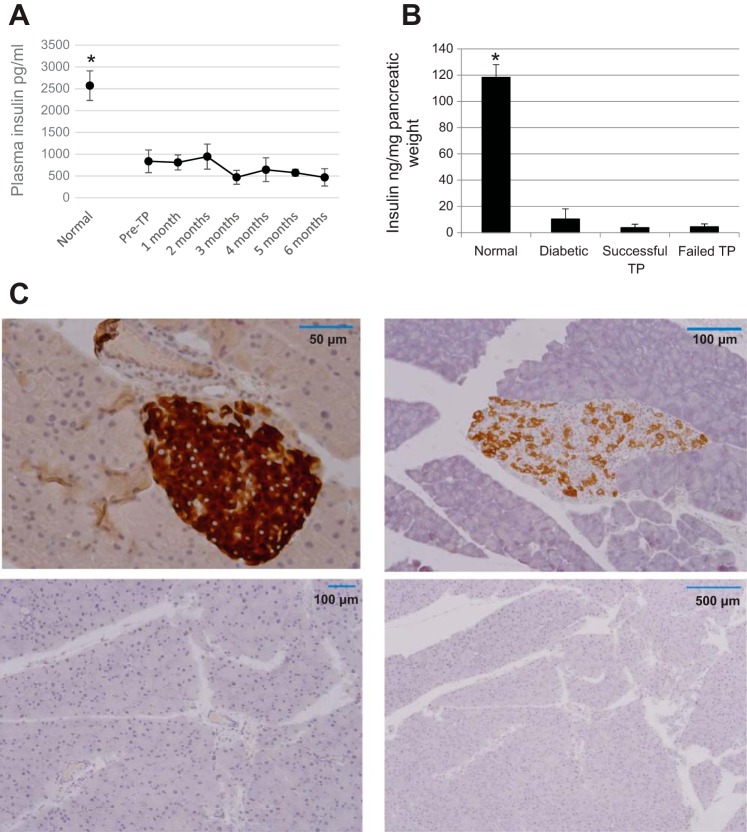
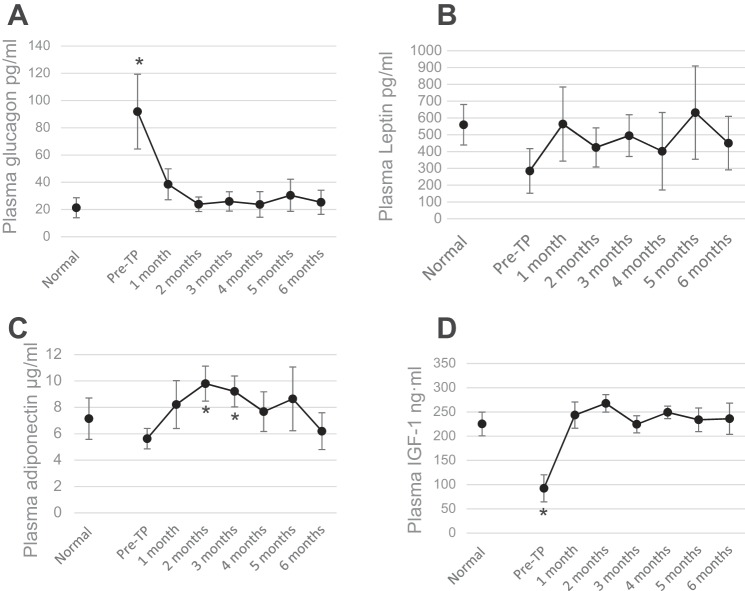
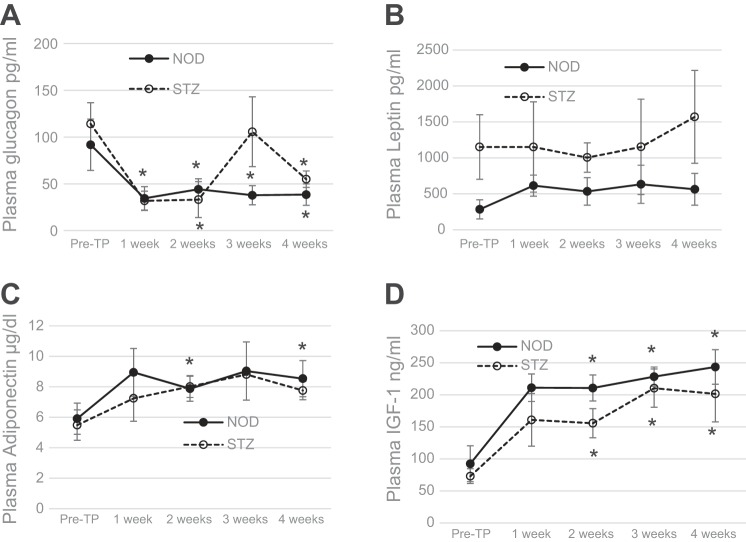
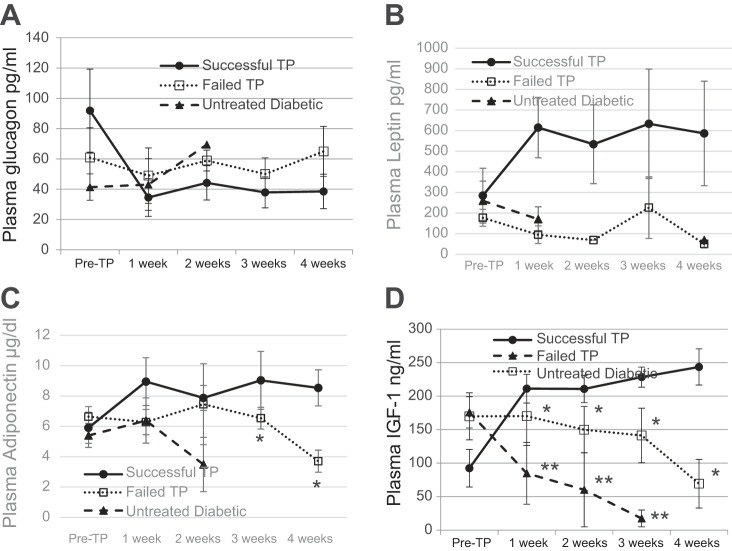
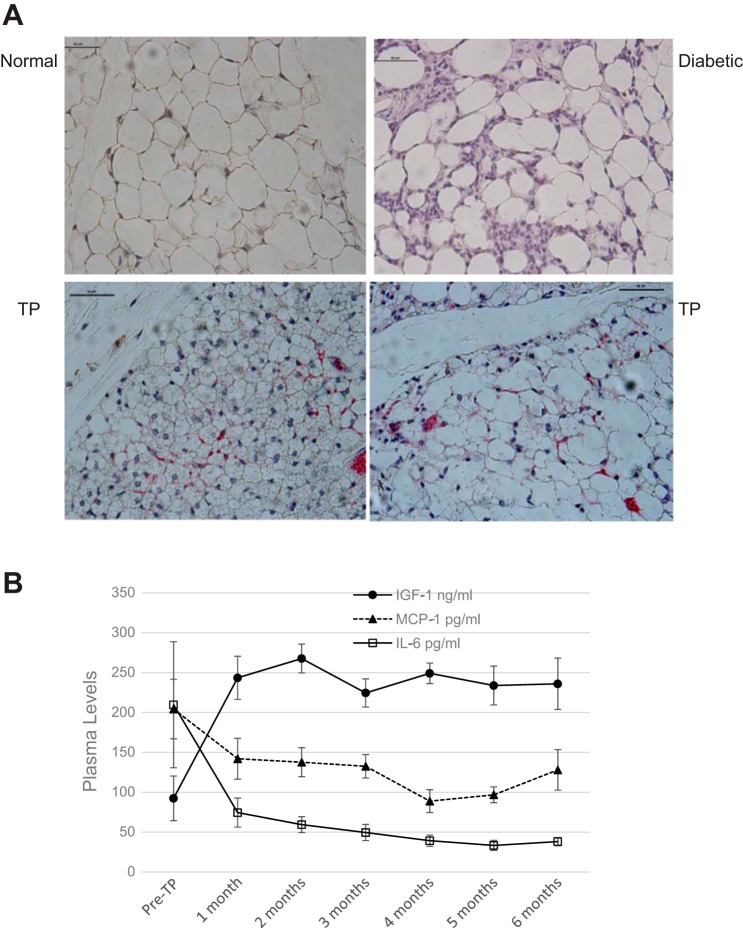
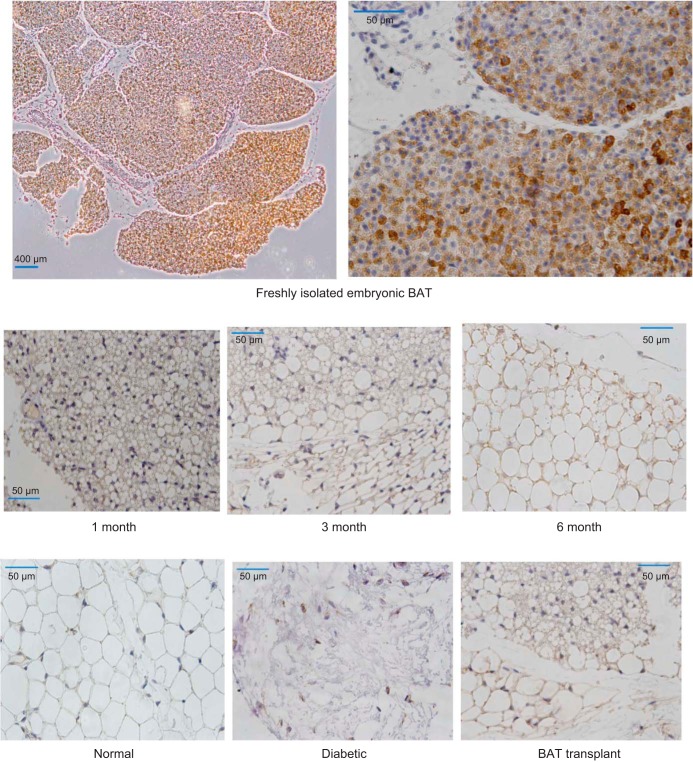
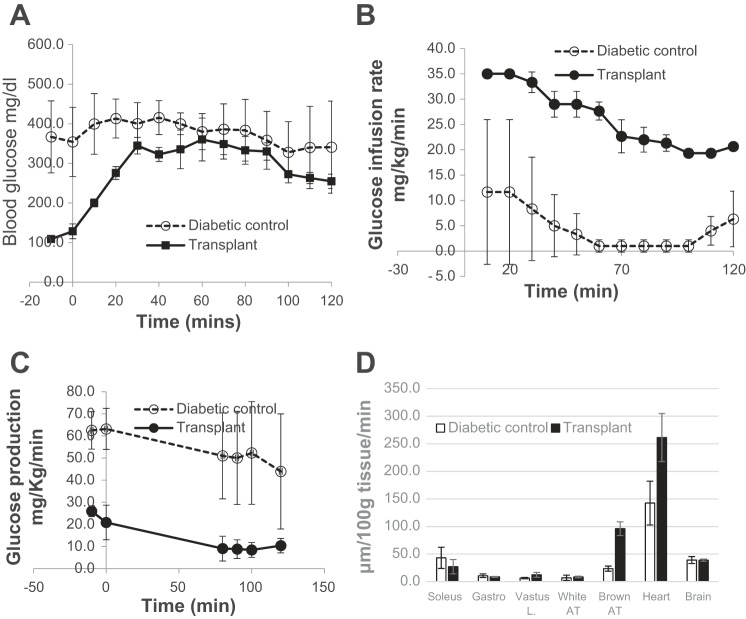
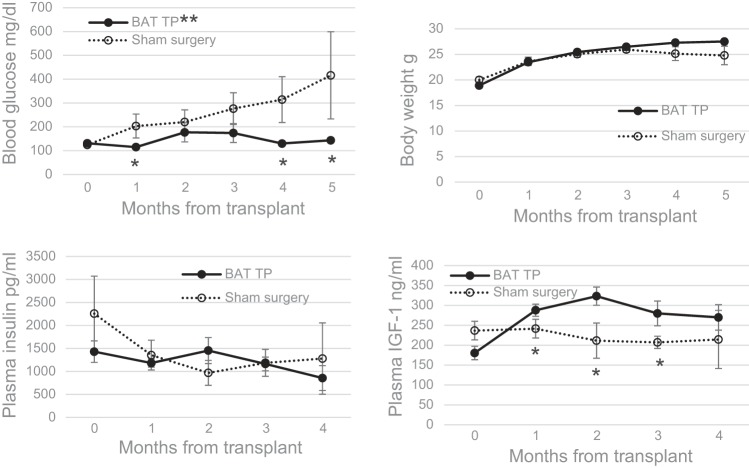
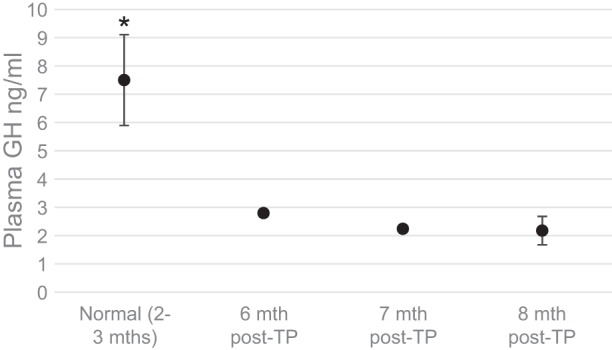
Traditional therapies for type 1 diabetes (T1D) involve insulin replacement or islet/pancreas transplantation and have numerous limitations. Our previous work demonstrated the ability of embryonic brown adipose tissue (BAT) transplants to establish normoglycemia without insulin in chemically induced models of insulin-deficient diabetes. The current study sought to extend the technique to an autoimmune-mediated T1D model and document the underlying mechanisms. In nonobese diabetic (NOD) mice, BAT transplants result in complete reversal of T1D associated with rapid and long-lasting euglycemia. In addition, BAT transplants placed prior to the onset of diabetes on NOD mice can prevent or significantly delay the onset of diabetes. As with streptozotocin (STZ)-diabetic models, euglycemia is independent of insulin and strongly correlates with decrease of inflammation and increase of adipokines. Plasma insulin-like growth factor-I (IGF-I) is the first hormone to increase following BAT transplants. Adipose tissue of transplant recipients consistently express IGF-I compared with little or no expression in controls, and plasma IGF-I levels show a direct negative correlation with glucose, glucagon, and inflammatory cytokines. Adipogenic and anti-inflammatory properties of IGF-I may stimulate regeneration of new healthy white adipose tissue, which in turn secretes hypoglycemic adipokines that substitute for insulin. IGF-I can also directly decrease blood glucose through activating insulin receptor. These data demonstrate the potential for insulin-independent reversal of autoimmune-induced T1D with BAT transplants and implicate IGF-I as a likely mediator in the resulting equilibrium.

Keywords: brown adipose tissue; insulin independent; insulin-like growth factor I; transplantation; type 1 diabetes.


Figures

Fig. 1.
Fig. 1.
Brown adipose tissue (BAT) transplants (TP) restore glucose homeostasis and body weight in nonobese diabetic (NOD) mice. A: nonfasting blood glucose levels before and at weekly intervals following BAT TP compared with untreated diabetic controls. Successful TP recipients (●) achieve and maintain euglycemia within 1 wk from TP, whereas diabetic controls (▲) and failed TP (○) become progressively hyperglycemic; n = 10. *P < 0.005 when the successful TP group is compared with other groups at corresponding time points or with their own pre-TP values. B: nonfasting blood glucose levels at monthly intervals in the successful TP group compared with normal nondiabetic controls; n = 10 at ≤2 mo, n = 8 at 3–6 mo, and n = 6 beyond 7 mo in the TP group; n = 8 in the control group; *P < 0.005 when pre-TP time point is compared with each post-TP time point or with normal control. C: body weight before and at weekly intervals following BAT TP compared with untreated diabetic controls. Successful TP recipients maintain pre-TP weight, whereas diabetic controls and failed TP progressively lose weight; n = 10. There was no significant difference between groups. D: body weight at monthly intervals in the successful TP group compared with normal nondiabetic controls; n = 10 at ≤2 mo, n = 8 at 3–6 mo, and n = 6 beyond 7 mo in the TP group; n = 8 in the control group. *P < 0.05 when post-TP values are compared with normal control or 5- and 8-mo time points are compared with pre-TP condition.
Fig. 2.
Fig. 2.
Effects of BAT TP are independent of insulin. A: plasma insulin levels at monthly intervals in the successful TP group compared with normal nondiabetic controls; n = 8. *P < 0.01 when any time point in the TP group is compared with normal control. B: pancreatic insulin content postmortem in each group; n = 6. *P < 0.005 when each group is compared with normal nondiabetic controls. C: pancreatic sections immunostained for insulin (brown). Top left: normal nondiabetic control; top right: untreated diabetic control; bottom left: 6 mo post-TP; bottom right: larger area of same at lower magnification. Insulin staining is deficient in diabetic control and absent in the TP.
Fig. 3.
Fig. 3.
BAT TP are followed by progressive increases of plasma adipokines and suppression of glucagon. Plasma levels of glucagon (A), leptin (B), adiponectin (C), and IGF-I (D) before and at monthly intervals following TP compared with normal nondiabetic control group; n = 8. *P < 0.05 when pre-TP condition is compared with all other conditions (for glucagon and IGF-I) and when pretransplant condition is compared with 2- and 3-mo time points post-TP (for adiponectin).
Fig. 4.
Fig. 4.
BAT transplants are followed by early increases in plasma adipokines and suppression of glucagon. Plasma levels of glucagon, leptin, adiponectin, and IGF-I during the first 4 wk post-TP. ●, NOD; ○, streptozotocoin (STZ)-treated C57BL/6 mice; n = 6 for NOD, n = 4 for STZ. *P < 0.05 when pretransplant condition is compared with 2, 3, and 4 wk post-TP in both groups (IGF-I), when pretransplant condition is compared with 2 and 4 wk post-TP in the NOD group (adiponectin), and when pretransplant condition is compared with each post-TP time point in the NOD group and 1- and 2-wk time points in the STZ group (glucagon).
Fig. 5.
Fig. 5.
Plasma adipokine levels in successful TP recipients in the first 4 wk post-TP compared with untreated diabetic control and failed TP groups; n = 6. *P < 0.05 when weeks 3 and 4 are compared between successful and failed TP (adiponectin) and when all time points post-TP are compared between successful and failed TP (IGF-I); **P < 0.01 when all time points post-TP are compared between successful TP and untreated diabetic controls.
Fig. 6.
Fig. 6.
BAT transplants are associated with decrease in adipose tissue inflammation. A: sections of subcutaneous adipose tissue from NOD mice stained with F4/80 (brown) for all macrophages and CD206 (red) for M2 macrophages. Scale bars, 60 μm. Top left: normal control; top right: diabetic control; bottom right and bottom left: successful TP characterized by smaller adipocytes overall, BAT morphology in many adipocytes, and increased staining for CD206. B: increase in plasma IGF-I levels correlates with the decrease in proinflammatory cytokines. Plasma levels of IGF-I (●), IL-6 (□), and monocyte chemoattractant protein (MCP-1; ▲) before and at monthly intervals following BAT transplants; n = 8. P < 0.05 when the pre-TP values for each factor are compared with corresponding post-TP values.
Fig. 7.
Fig. 7.
Expression of IGF-I (diaminobenzidine staining; brown) in different tissue sections. Top: freshly isolated embryonic BAT. Middle: adipose tissue in the BAT TP area at different time points from STZ-diabetic mice that became euglycemic following TP, showing consistent expression of IGF-I. Bottom: adipose tissue of normal and diabetic controls compared with 3-mo TP. IGF-I expression is evident only in the TP recipient.
Fig. 8.
Fig. 8.
Glucose uptake and metabolism are more efficient in BAT TP recipients. Hyperinsulinemic euglycemic clamps performed on NOD successful TP recipients and untreated diabetic controls. Glucose infusion rate (B) is significantly higher in the TP group compared with diabetic control group, whereas blood glucose (A) and endogenous glucose production (C) are significantly lower. D: glucose uptake by peripheral tissues. In the TP group, glucose uptake by the heart and BAT were significantly higher than in the control group, whereas the other tissues showed no difference; n = 3. A: P < 0.03 from −20 to 40 min. B: P < 0.0001 for all time points. C: P < 0.01 from −20 to 0 min, P < 0.08 from 80 to 120 min. D: P < 0.0001 for BAT, P < 0.07 for heart.
Fig. 9.
Fig. 9.
BAT TP prevent the onset of diabetes in NOD mice. TP were performed on normoglycemic NOD female mice at 7–10 wk of age prior to onset of diabetes. Blood parameters were compared with a control group that received sham surgeries at 7–10 wk of age. Blood glucose (A), body weight (B), plasma insulin (C), and plasma IGF-I (D) before and at monthly intervals following BAT TP compared with sham surgery group; n = 11 for BAT TP group, n = 10 for sham surgery group. *P < 0.05 when blood glucose values are compared between groups at 1-, 4-, and 5-mo time points and when plasma IGF-I values are compared at 1–3 mo; **P < 0.02 when the mean glucose values in the BAT TP group over time are compared with those of the sham surgery group.
Fig. 10.
Fig. 10.
Plasma growth hormone (GH) levels in NOD transplant recipients compared with normal controls. GH levels in preventive BAT TP recipients euglycemic at 6, 7, and 8 mo post-TP (n = 3) were compared with normal nondiabetic control mice at 8–12 wk of age (n = 8). *P < 0.05 when each transplant group is compared with normal controls. ●, plasma GH level for each condition denoted in the x-axis.

References

    1. Acerini CL, Patton CM, Savage MO, Kernell A, Westphal O, Dunger DB. Randomised placebo-controlled trial of human recombinant insulin-like growth factor I plus intensive insulin therapy in adolescents with insulin-dependent diabetes mellitus. Lancet 350: 1199–1204, 1997. - PubMed
    1. Attie AD, Scherer PE. Adipocyte metabolism and obesity. J Lipid Res 50 Suppl: S395–S399, 2009. - PMC - PubMed
    1. Ayala JE, Bracy DP, McGuinness OP, Wasserman DH. Considerations in the design of hyperinsulinemic-euglycemic clamps in the conscious mouse. Diabetes 55: 390–397, 2006. - PubMed
    1. Aydin F, Kaya A, Karapinar L, Kumbaraci M, Imerci A, Karapinar H, Karakuzu C, Incesu M. IGF-1 Increases with Hyperbaric Oxygen Therapy and Promotes Wound Healing in Diabetic Foot Ulcers. J Diabetes Res 2013: 567834, 2013. - PMC - PubMed
    1. Berg AH, Scherer PE. Adipose tissue, inflammation, and cardiovascular disease. Review Circ Res 96: 939–949, 2005. - PubMed

Publication types