

Comparing denominator degrees of freedom approximations for the generalized linear mixed model in analyzing binary outcome in small sample cluster-randomized trials
- PMID: 25899170
- PMCID: PMC4458010
- DOI: 10.1186/s12874-015-0026-x
Comparing denominator degrees of freedom approximations for the generalized linear mixed model in analyzing binary outcome in small sample cluster-randomized trials
Abstract
Background: Small number of clusters and large variation of cluster sizes commonly exist in cluster-randomized trials (CRTs) and are often the critical factors affecting the validity and efficiency of statistical analyses. F tests are commonly used in the generalized linear mixed model (GLMM) to test intervention effects in CRTs. The most challenging issue for the approximate Wald F test is the estimation of the denominator degrees of freedom (DDF). Some DDF approximation methods have been proposed, but their small sample performances in analysing binary outcomes in CRTs with few heterogeneous clusters are not well studied.
Methods: The small sample performances of five DDF approximations for the F test are compared and contrasted under CRT frameworks with simulations. Specifically, we illustrate how the intraclass correlation (ICC), sample size, and the variation of cluster sizes affect the type I error and statistical power when different DDF approximation methods in GLMM are used to test intervention effect in CRTs with binary outcomes. The results are also illustrated using a real CRT dataset.
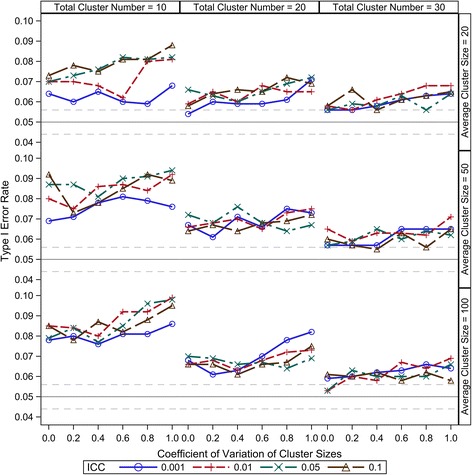
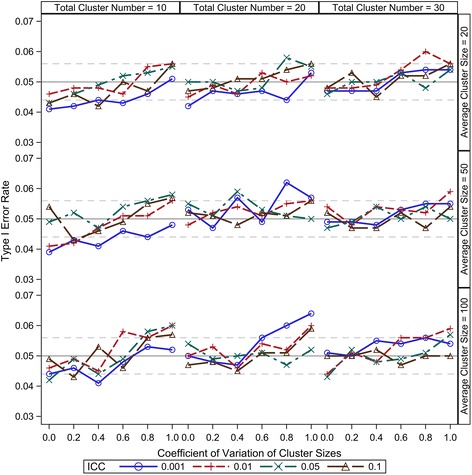
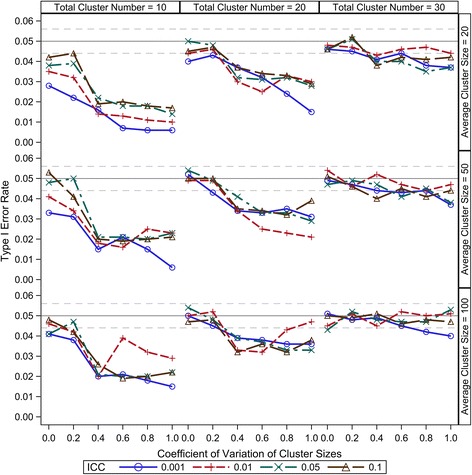
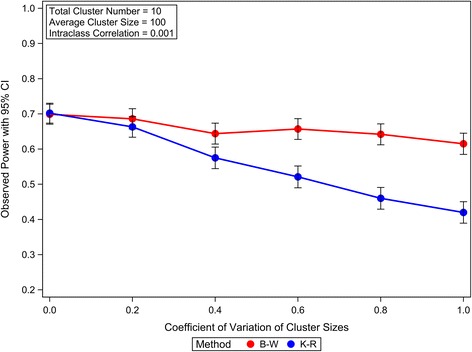
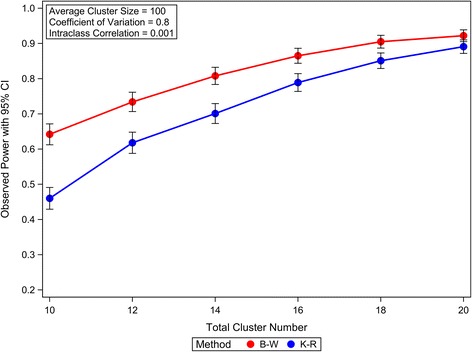
Results: Our simulation results suggest that the Between-Within method maintains the nominal type I error rates even when the total number of clusters is as low as 10 and is robust to the variation of the cluster sizes. The Residual and Containment methods have inflated type I error rates when the cluster number is small (<30) and the inflation becomes more severe with increased variation in cluster sizes. In contrast, the Satterthwaite and Kenward-Roger methods can provide tests with very conservative type I error rates when the total cluster number is small (<30) and the conservativeness becomes more severe as variation in cluster sizes increases. Our simulations also suggest that the Between-Within method is statistically more powerful than the Satterthwaite or Kenward-Roger method in analysing CRTs with heterogeneous cluster sizes, especially when the cluster number is small.
Conclusion: We conclude that the Between-Within denominator degrees of freedom approximation method for F tests should be recommended when the GLMM is used in analysing CRTs with binary outcomes and few heterogeneous clusters, due to its type I error properties and relatively higher power.
Figures


Similar articles
-
Small sample performance of bias-corrected sandwich estimators for cluster-randomized trials with binary outcomes.Stat Med. 2015 Jan 30;34(2):281-96. doi: 10.1002/sim.6344. Epub 2014 Oct 24. Stat Med. 2015. PMID: 25345738 Free PMC article.
-
Type I error control for cluster randomized trials under varying small sample structures.BMC Med Res Methodol. 2021 Apr 3;21(1):65. doi: 10.1186/s12874-021-01236-7. BMC Med Res Methodol. 2021. PMID: 33812367 Free PMC article.
-
Cluster randomised trials with a binary outcome and a small number of clusters: comparison of individual and cluster level analysis method.BMC Med Res Methodol. 2022 Aug 12;22(1):222. doi: 10.1186/s12874-022-01699-2. BMC Med Res Methodol. 2022. PMID: 35962318 Free PMC article.
-
Generalized estimating equations in cluster randomized trials with a small number of clusters: Review of practice and simulation study.Clin Trials. 2016 Aug;13(4):445-9. doi: 10.1177/1740774516643498. Epub 2016 Apr 19. Clin Trials. 2016. PMID: 27094487 Review.
-
Cluster randomized trials for pharmacy practice research.Int J Clin Pharm. 2016 Jun;38(3):607-14. doi: 10.1007/s11096-015-0205-1. Epub 2015 Dec 29. Int J Clin Pharm. 2016. PMID: 26715549 Review.
Cited by
-
The Role of Genetic Variations in the FAAH rs324420 Polymorphism and its Interaction with CRHR1 rs110402 and CNR1 rs2180619 in Anxiety and- Trauma Related Symptoms After Military Deployment.Chronic Stress (Thousand Oaks). 2024 Oct 7;8:24705470241285828. doi: 10.1177/24705470241285828. eCollection 2024 Jan-Dec. Chronic Stress (Thousand Oaks). 2024. PMID: 39484094 Free PMC article.
-
Affect and Social Judgment: The Roles of Physiological Reactivity and Interoceptive Sensitivity.Affect Sci. 2022 Apr 28;3(2):464-479. doi: 10.1007/s42761-022-00114-9. eCollection 2022 Jun. Affect Sci. 2022. PMID: 36046009 Free PMC article.
-
Analysis of multiple-period group randomized trials: random coefficients model or repeated measures ANOVA?Trials. 2022 Dec 7;23(1):987. doi: 10.1186/s13063-022-06917-2. Trials. 2022. PMID: 36476294 Free PMC article.
-
Inference for the treatment effect in staircase designs with continuous outcomes: a simulation study.BMC Med Res Methodol. 2025 May 10;25(1):127. doi: 10.1186/s12874-025-02567-5. BMC Med Res Methodol. 2025. PMID: 40348964 Free PMC article.
-
Statistical analysis plan for the control of blood pressure and risk attenuation-rural Bangladesh, Pakistan, Sri Lanka (COBRA-BPS) trial: a cluster randomized trial for a multicomponent intervention versus usual care in hypertensive patients.Trials. 2018 Nov 29;19(1):658. doi: 10.1186/s13063-018-3022-8. Trials. 2018. PMID: 30486858 Free PMC article.
References
-
- Eldridge SM, Ukoumunne OC, Carlin JB. The intra-cluster correlation coefficient in cluster randomized trials: a review of definitions. Int Stat Rev. 2009;77(3):378–394. doi: 10.1111/j.1751-5823.2009.00092.x. - DOI
Publication types
MeSH terms
Grants and funding
LinkOut - more resources
Full Text Sources
Other Literature Sources
Research Materials
