. 2015 Apr 20:4:26316.
doi: 10.3402/jev.v4.26316. eCollection 2015.

Extracellular vesicle in vivo biodistribution is determined by cell source, route of administration and targeting

Affiliations

Extracellular vesicle in vivo biodistribution is determined by cell source, route of administration and targeting

Oscar P B Wiklander et al. J Extracell Vesicles. .

Abstract

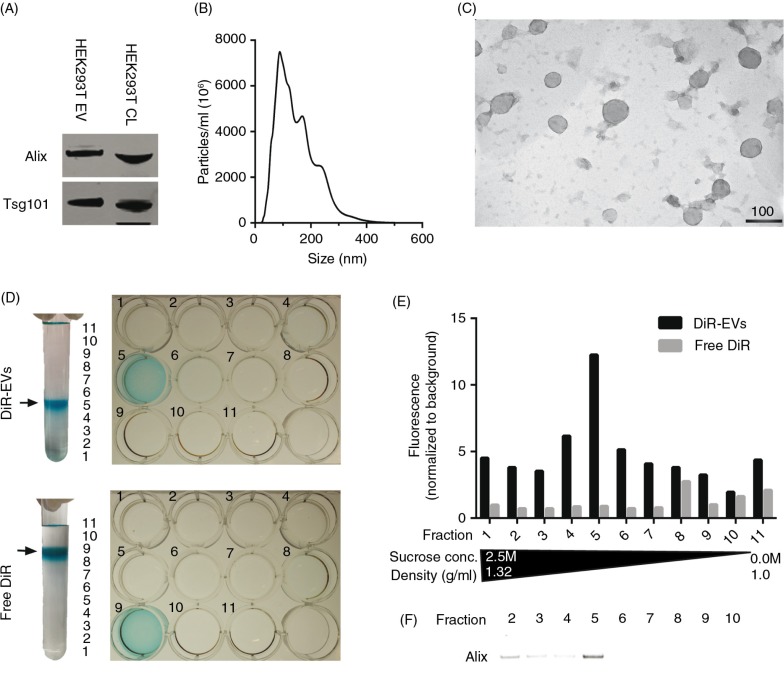
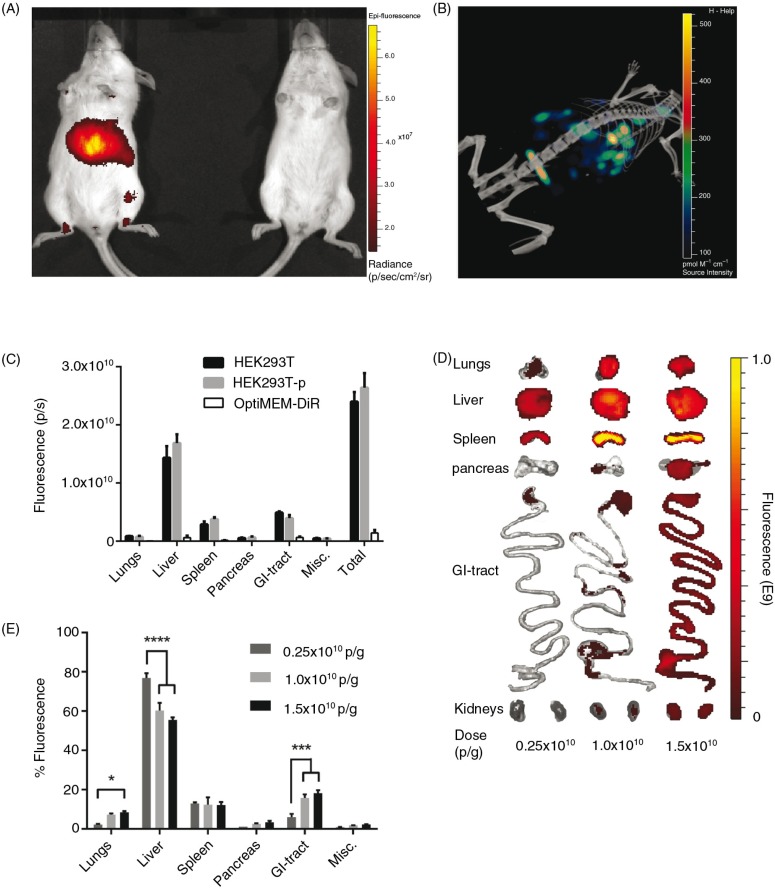
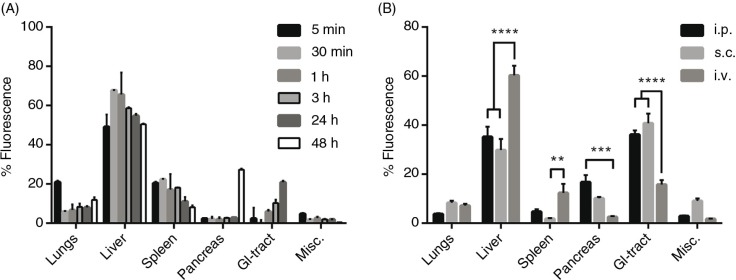
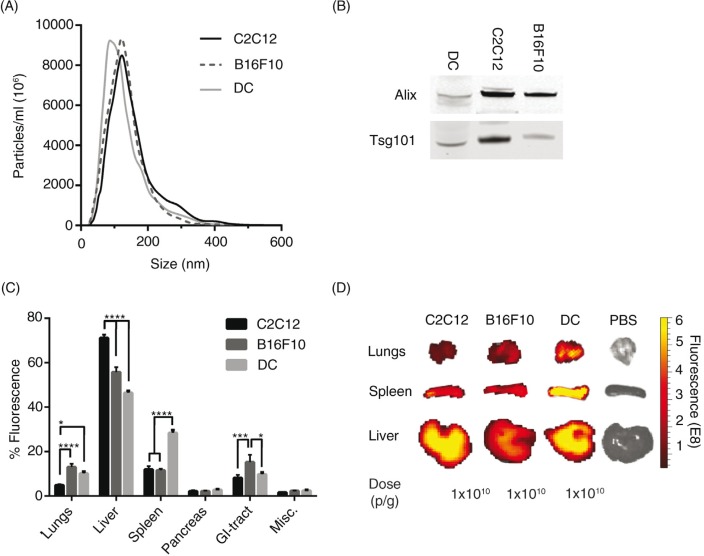
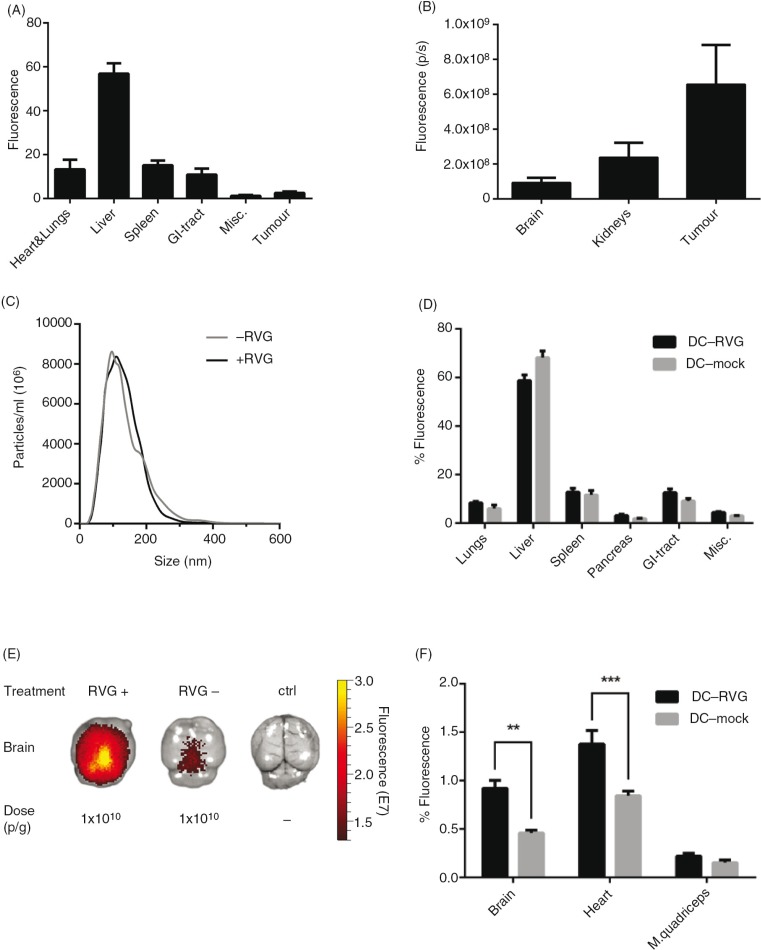
Extracellular vesicles (EVs) have emerged as important mediators of intercellular communication in a diverse range of biological processes. For future therapeutic applications and for EV biology research in general, understanding the in vivo fate of EVs is of utmost importance. Here we studied biodistribution of EVs in mice after systemic delivery. EVs were isolated from 3 different mouse cell sources, including dendritic cells (DCs) derived from bone marrow, and labelled with a near-infrared lipophilic dye. Xenotransplantation of EVs was further carried out for cross-species comparison. The reliability of the labelling technique was confirmed by sucrose gradient fractionation, organ perfusion and further supported by immunohistochemical staining using CD63-EGFP probed vesicles. While vesicles accumulated mainly in liver, spleen, gastrointestinal tract and lungs, differences related to EV cell origin were detected. EVs accumulated in the tumour tissue of tumour-bearing mice and, after introduction of the rabies virus glycoprotein-targeting moiety, they were found more readily in acetylcholine-receptor-rich organs. In addition, the route of administration and the dose of injected EVs influenced the biodistribution pattern. This is the first extensive biodistribution investigation of EVs comparing the impact of several different variables, the results of which have implications for the design and feasibility of therapeutic studies using EVs.

Keywords: biodistribution; drug delivery; exosomes; extracellular vesicles; microvesicles; nanotechnology; tissue targeting.


Figures

Fig. 1
Fig. 1
DiR labelling does not affect EV morphology and co-localizes with EVs. (A) Western Blot (WB) stained for Alix and Tsg101 on HEK293T purified, DiR-labelled EVs and cell lysate (CL) (whole WB-membrane shown in Supplementary Fig. 1A). (B) NTA profile of DiR-labelled HEK293T EVs showing an EV-like distribution with a mode size around 100 nm. The curve has been normalized to dilution factors. (C) Electron microscopy picture of DiR-labelled HEK-293T EVs. Scale bar represents 100 nm. (D) Image depicting DiR-EVs and free DiR sucrose gradients in UC tubes and subsequent 12-well plates containing the different fractions. (E) Fluorescent values (normalized to background) of the DiR-EVs and free DiR gradients (assayed from the 12-well plates depicted in 1D). (F) WB stained for Alix for DiR-EVs from fractions 2–10 (whole WB-membrane shown in Supplementary Fig. 1B).
Fig. 2
Fig. 2
Systemically delivered EVs display a dose-dependent increase in tissue uptake in mice. (A) Representative IVIS image 24 hours post-injection of a live mouse injected i.v. with 1.0×10¹⁰ p/g DiR-EVs (left) and PBS-treated control (right). (B) Representative co-registration of FLIT with CT-scan 24 hours post-injection of a mouse injected i.v. with 1.0×10¹⁰ p/g DiR-EVs. (C) Fluorescent signal in each organ 24 hours post-iv injection of HEK293T-EVs (1.0×10¹⁰ p/g) with (HEK293T-p) and without (HEK293T) perfusion and free OptiMEM-DiR. Misc.=brain, heart, kidneys and quadriceps muscle. N=4. The results represent mean+SEM. (D) Representative IVIS images of organs (24 hours post-injection) from mice injected i.v. with 1.5×10¹⁰ p/g, 1.0×10¹⁰ p/g and 0.25×10¹⁰ p/g of HEK293T EVs. (E) The percentage of fluorescent signal in each organ for the same experiment as in Fig. 2D (Absolute fluorescent signals are plotted in Supplementary Fig. 3). N=4, in E *represents p=0.05, **p=0.001 and ****p=0.0001. The results represent mean+SEM.
Fig. 3
Fig. 3
Distribution kinetics and effect of different injection routes of DiR-labelled EVs on tissue distribution. (A) Percentage fluorescent signal of each organ ex vivo at different time points after injection of 1.0×10¹⁰ p/g DiR-labelled HEK293T EVs (fluorescent signal in absolute numbers in Supplementary Fig. 4). (B) Percentage fluorescent signal in each organ following i.p., s.c. and i.v. injection of 1.0×10¹⁰ p/g DiR-labelled HEK293T EVs (Absolute fluorescent signals are plotted in Supplementary Fig. 5b). Misc.=brain, heart, kidneys and quadriceps muscle. N=3–4, **represents p<0.01, ***p<0.001 and ****p<0.0001. The results represent mean+SEM.
Fig. 4
Fig. 4
The biodistribution of EVs differs between cell sources. (A) Particle distribution of DiR-labelled EVs from mouse C2C12-, B16F10- and DC-cells measured by NTA. (B) Western Blot stained against Alix and Tsg101 of EVs from C2C12-, B16F10- and DC-cells (whole WB-membranes in Supplementary Fig. 7). (C) The percentage of fluorescent signal in each organ after injection of 1.0×10¹⁰ p/g DiR-labelled EVs from the 3 different mouse cell types (Absolute fluorescent signals are plotted in Supplementary Fig. 8). Misc.=brain, heart, kidneys and quadriceps muscle. (D) Representative spleen, liver and lung IVIS images from mice injected with EVs from the 3 different mouse cell sources and PBS-treated control. N=4, in C *represents p=0.05, ***p=0.001 and ****p=0.0001. The results represent mean+SEM.
Fig. 5
Fig. 5
EVs distribute to tumour tissue and can be targeted to the brain. (A) The percentage of fluorescent signal in each organ of tumour-bearing mice after injection of 1.0×10¹⁰ p/g HEK293T DiR-labelled EVs (Absolute fluorescent signals are plotted in Supplementary Fig. 9). (B) Fluorescent signal from tumour, kidneys and brain shown from the same mice described in Fig. 5A. (C) NTA of RVG-positive (+RVG) and RVG-negative (-RVG) DC-EVs. (D) The percentage of fluorescent signal in each organ after injection of 1.0×10¹⁰ p/g of +RVG and –RVG DC-EVs (Absolute fluorescent signals are plotted in Supplementary Fig. 10). (E) Representative image of mouse brains, harvested 24 hour post-injection of 1.0×10¹⁰ p/g of +RVG and –RVG DC-EVs. (F) The percentage of fluorescence signal in the brain, heart and muscle from the same mice as shown in Fig. 5D (Absolute fluorescent signals are plotted in Supplementary Fig. 11). Misc.=brain, heart, kidneys and quadriceps muscle. N=4, **represents p<0.01 and ***represents p<0.001, the results represent mean+SEM.

References

    1. EL Andaloussi S, Mager I, Breakefield XO, Wood MJ. Extracellular vesicles: biology and emerging therapeutic opportunities. Nat Rev Drug Discov. 2013;12:347–57. - PubMed
    1. Ratajczak J, Miekus K, Kucia M, Zhang J, Reca R, Dvorak P, et al. Embryonic stem cell-derived microvesicles reprogram hematopoietic progenitors: evidence for horizontal transfer of mRNA and protein delivery. Leukemia. 2006;20:847–56. - PubMed
    1. Peinado H, Aleckovic M, Lavotshkin S, Matei I, Costa-Silva B, Moreno-Bueno G, et al. Melanoma exosomes educate bone marrow progenitor cells toward a pro-metastatic phenotype through MET. Nat Med. 2012;18:883–91. - PMC - PubMed
    1. Al-Nedawi K, Meehan B, Micallef J, Lhotak V, May L, Guha A, et al. Intercellular transfer of the oncogenic receptor EGFRvIII by microvesicles derived from tumour cells. Nat Cell Biol. 2008;10:619–24. - PubMed
    1. Valadi H, Ekstrom K, Bossios A, Sjostrand M, Lee JJ, Lotvall JO. Exosome-mediated transfer of mRNAs and microRNAs is a novel mechanism of genetic exchange between cells. Nat Cell Biol. 2007;9:654–9. - PubMed