Controlled Clinical Trial
. 2015 Apr;20(4):046009.
doi: 10.1117/1.JBO.20.4.046009.

Evaluation of cortical plasticity in children with cerebral palsy undergoing constraint-induced movement therapy based on functional near-infrared spectroscopy

Affiliations
Controlled Clinical Trial

Evaluation of cortical plasticity in children with cerebral palsy undergoing constraint-induced movement therapy based on functional near-infrared spectroscopy

Jianwei Cao et al. J Biomed Opt. 2015 Apr.

Abstract

Sensorimotor cortex plasticity induced by constraint-induced movement therapy (CIMT) in six children (10.2±2.1 years old) with hemiplegic cerebral palsy was assessed by functional near-infrared spectroscopy (fNIRS). The activation laterality index and time-to-peak/duration during a finger-tapping task and the resting-state functional connectivity were quantified before, immediately after, and 6 months after CIMT. These fNIRS-based metrics were used to help explain changes in clinical scores of manual performance obtained concurrently with imaging time points. Five age-matched healthy children (9.8±1.3 years old) were also imaged to provide comparative activation metrics for normal controls. Interestingly, the activation time-to-peak/duration for all sensorimotor centers displayed significant normalization immediately after CIMT that persisted 6 months later. In contrast to this improved localized activation response, the laterality index and resting-state connectivity metrics that depended on communication between sensorimotor centers improved immediately after CIMT, but relapsed 6 months later. In addition, for the subjects measured in this work, there was either a trade-off between improving unimanual versus bimanual performance when sensorimotor activation patterns normalized after CIMT, or an improvement occurred in both unimanual and bimanual performance but at the cost of very abnormal plastic changes in sensorimotor activity.


Figures
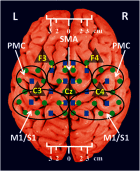
Fig. 1
Fig. 1
The fNIRS measurement geometry (sources: blue squares; detectors: green circles) spanned a field of view covering the premotor cortex (PMC), supplementary motor area (SMA) and M1/S1 (primary motor/sensory cortex) areas indicated by black ovals. Yellow lines connect the short distance source-detector pairs sampling the scalp hemodynamics. Dark gray triangles indicate the EEG International 10/20 system Cz, C3, C4, F3, and F4 locations.
Fig. 2
Fig. 2
Flowchart of postprocessing steps.
Fig. 3
Fig. 3
Laterality index for controls tapping with their dominant hand and children with cerebral palsy (CP) tapping with their affected hand across the three visits (white: controls, gray; children with CP). Error bars indicate ± one standard deviation. Asterisks indicate statistically significant differences in laterality index (p<0.01).
Fig. 4
Fig. 4
Group-wise resting-state functional connectivity in controls (a) and children with CP at the three assessment time points: (b) before therapy, (c) immediately after therapy, (d) 6 months later after therapy. Black line thickness represents the percentage of subjects with significant connectivity between a given pair of sensorimotor centers.
Fig. 5
Fig. 5
Time-to-peak/duration of activation for controls tapping with their dominant hand and children with CP tapping with their affected hand across the three visits (white: controls; gray: children with CP). Error bars indicate ± one standard deviation. Asterisks indicate statistically significant differences in time-to-peak/duration (p<0.05).
Fig. 6
Fig. 6
Change in clinical scores for six subjects with CP between visits (V1: before therapy, V2: immediately after therapy, V3: 6 months after therapy). (a) Change in scores between before and immediately after therapy (V2-V1). (b) Change in scores between before and 6 months after therapy (V3–V1). Thresholds for clinically significant improvements in Melbourne and AHA scores were 14 (vertical dashed lines) and 5 (horizontal dashed lines), respectively. Data for MACS1 subjects are inside ovals.
Fig. 7
Fig. 7
Change in clinical scores versus change in laterality index for MACS 2 subjects between visits (V1: before therapy, V2: immediately after therapy, V3: 6 months later after therapy). Change in Melbourne scores versus change in laterality index immediately after therapy (a) and (b) 6 months after therapy. Corresponding changes in AHA scores immediately after therapy (c) and (d) 6 months after therapy.

References

    1. Rosenbaum P., et al. , “A report: the definition and classification of cerebral palsy April 2006,” Dev. Med. Child Neurol. Suppl. 109(suppl 109), 8–14 (2007). - PubMed
    1. Kułak W., et al. , “Neurophysiologic and neuroimaging studies of brain plasticity in children with spastic cerebral palsy,” Exp. Neurol. 198(1), 4–11 (2006).EXNEAC10.1016/j.expneurol.2005.11.014 - DOI - PubMed
    1. Keogh J. M., Badawi N., “The origins of cerebral palsy,” Curr. Opin. Neurol. 19(2), 129–134 (2006).CONEEX10.1097/01.wco.0000218227.35560.0d - DOI - PubMed
    1. Houwink A., et al. , “A neurocognitive perspective on developmental disregard in children with hemiplegic cerebral palsy,” Res. Dev. Disabil. 32(6), 2157–2163 (2011).RDDIEF - PubMed
    1. Van de Winckel A., et al. , “How does brain activation differ in children with unilateral cerebral palsy compared to typically developing children, during active and passive movements, and tactile stimulation? An fMRI study,” Res. Dev. Disabil. 34(1), 183–197 (2013).RDDIEF - PubMed

Publication types