Review
. 2015 Aug;1854(8):1019-37.
doi: 10.1016/j.bbapap.2015.04.015. Epub 2015 Apr 18.

Enzyme Function Initiative-Enzyme Similarity Tool (EFI-EST): A web tool for generating protein sequence similarity networks

Affiliations
Review

Enzyme Function Initiative-Enzyme Similarity Tool (EFI-EST): A web tool for generating protein sequence similarity networks

John A Gerlt et al. Biochim Biophys Acta. 2015 Aug.

Abstract

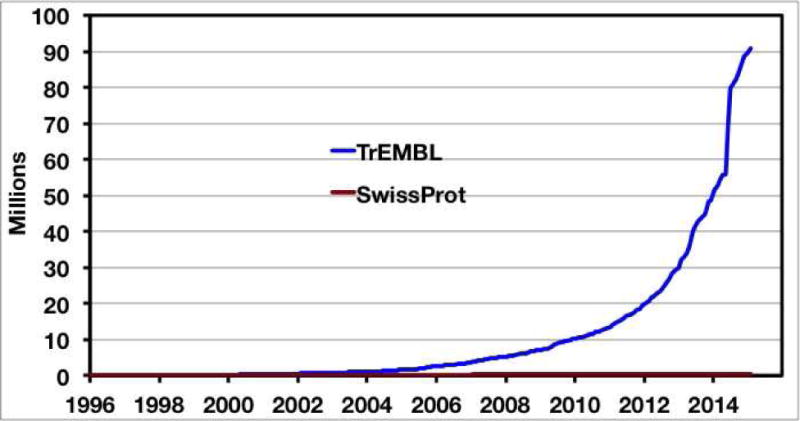
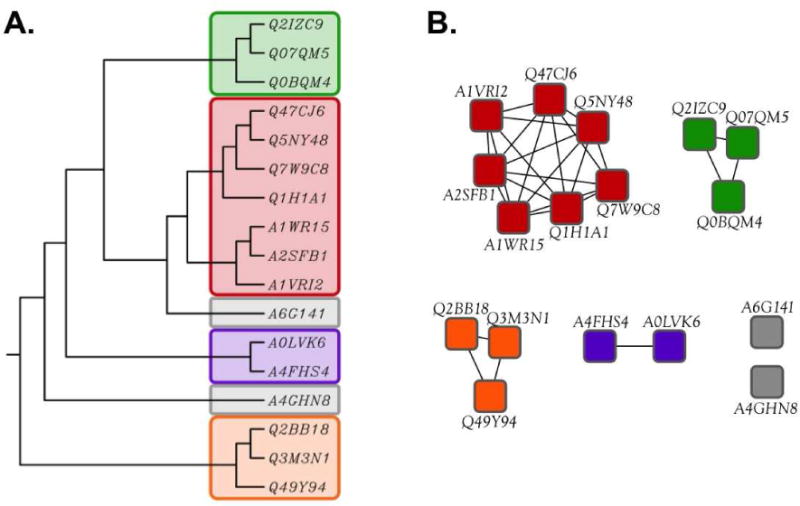
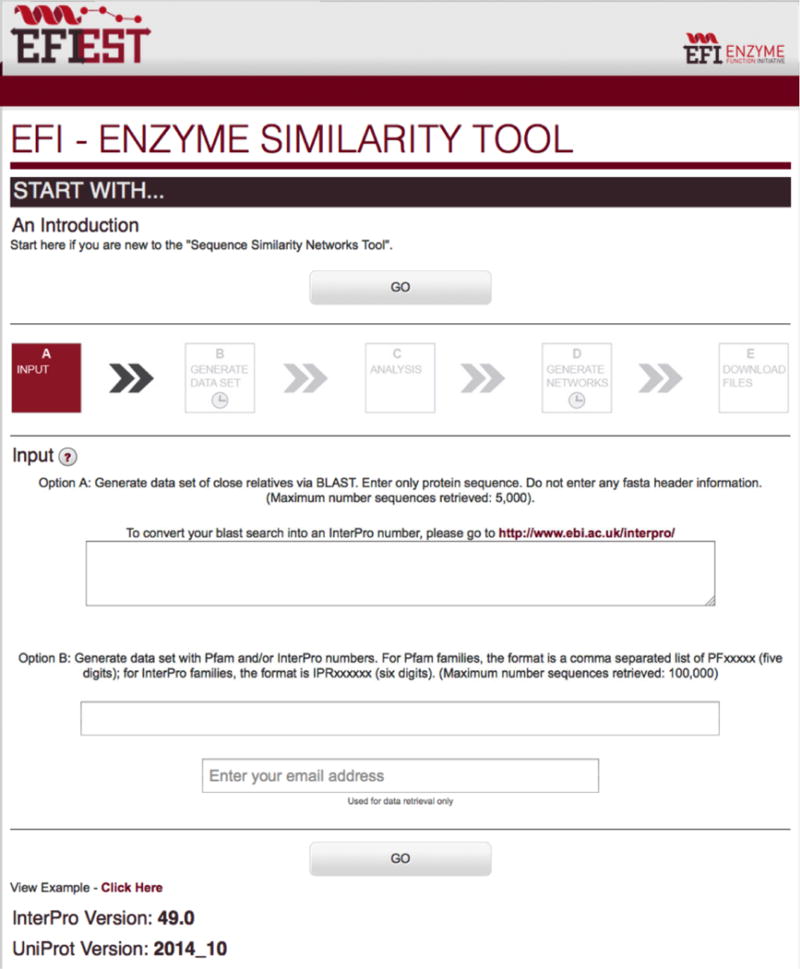
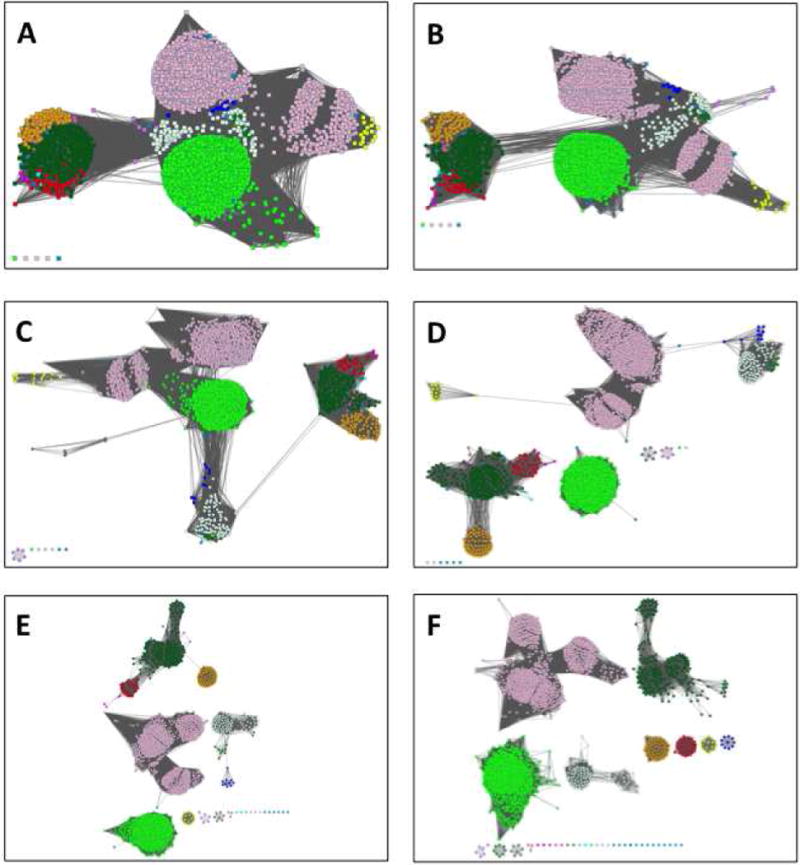
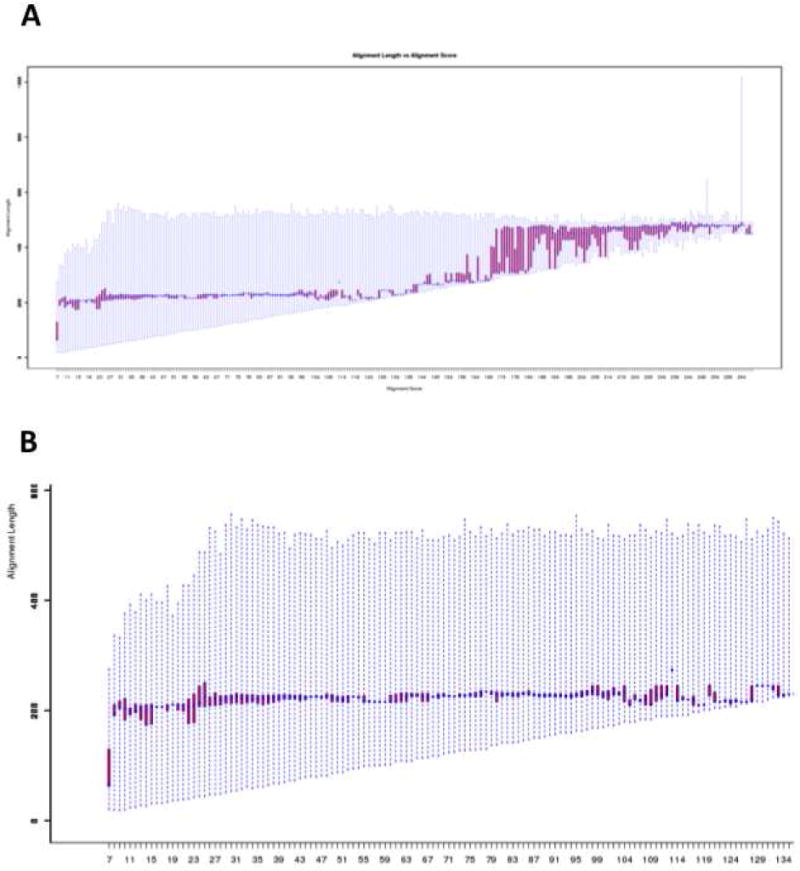
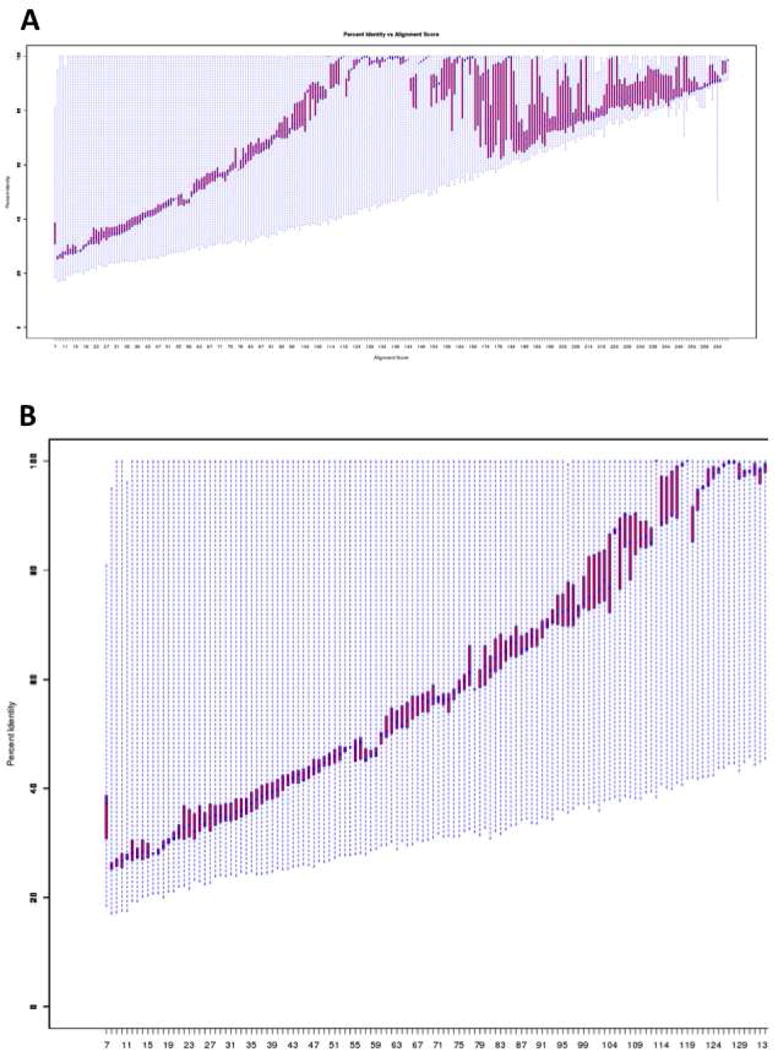
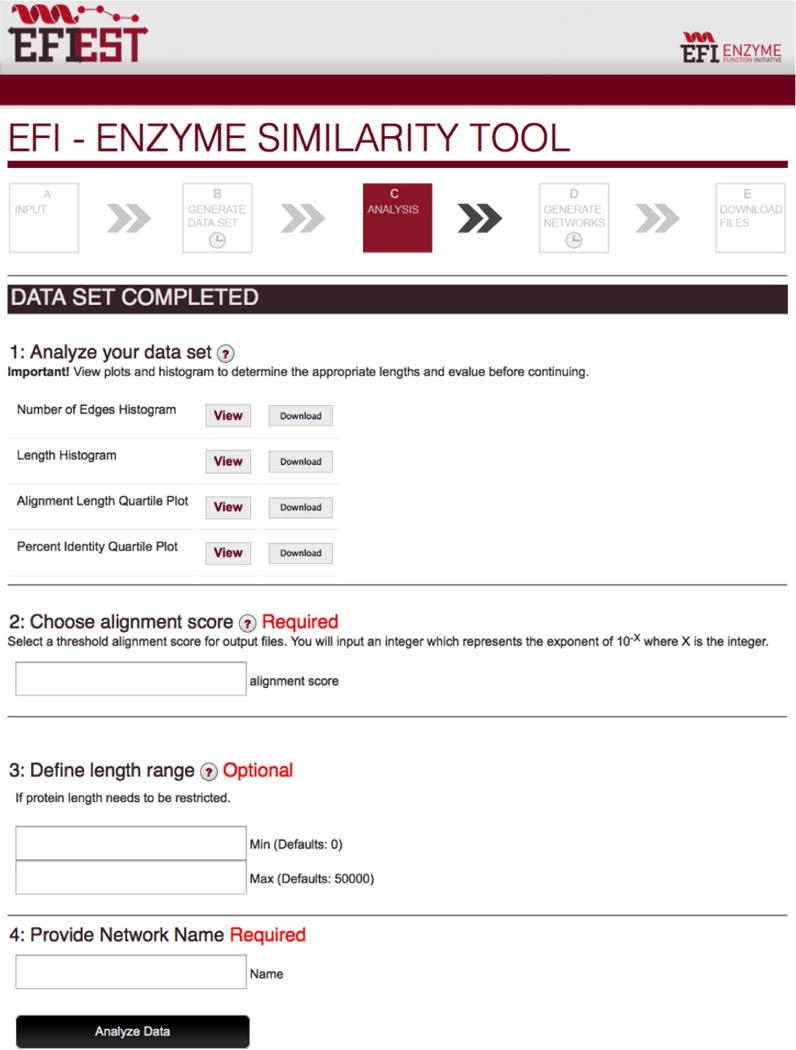
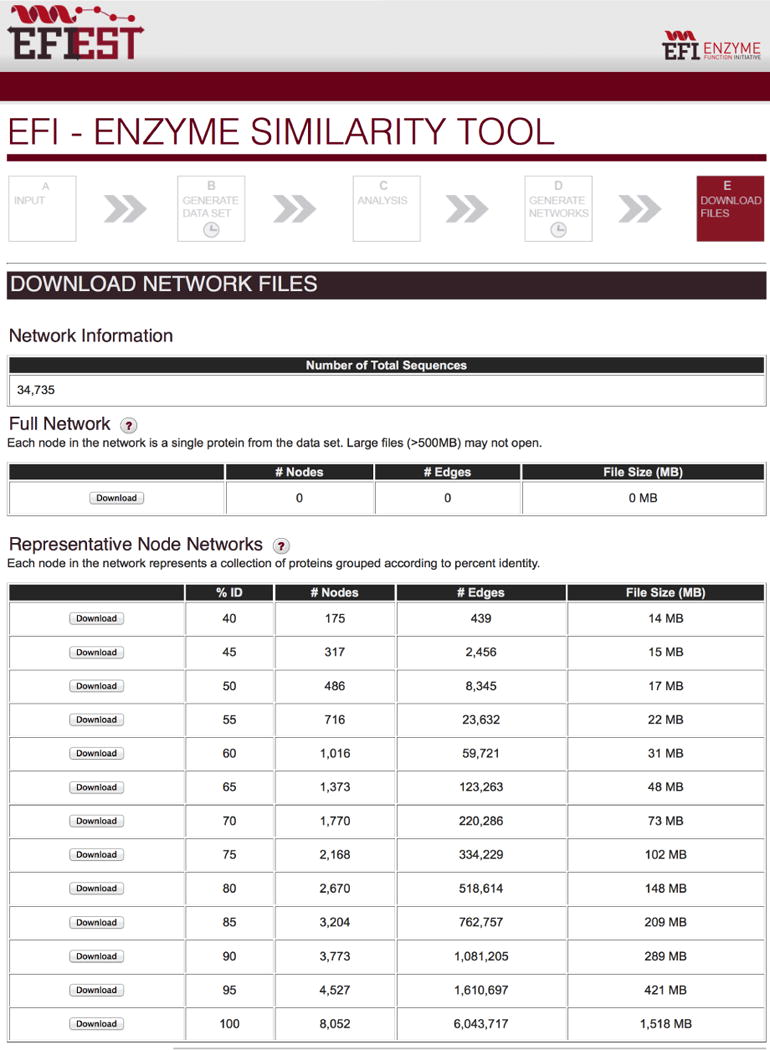
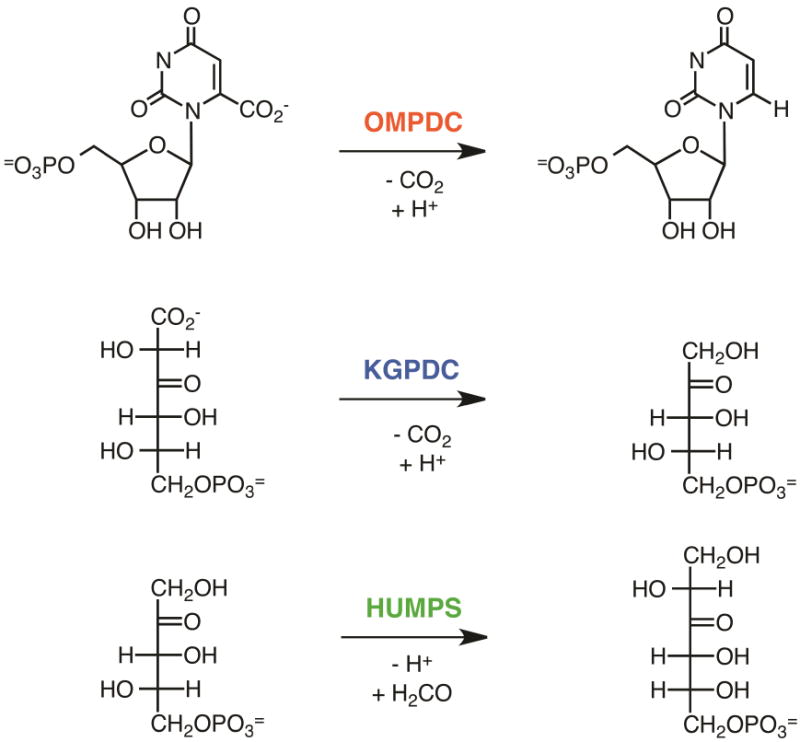
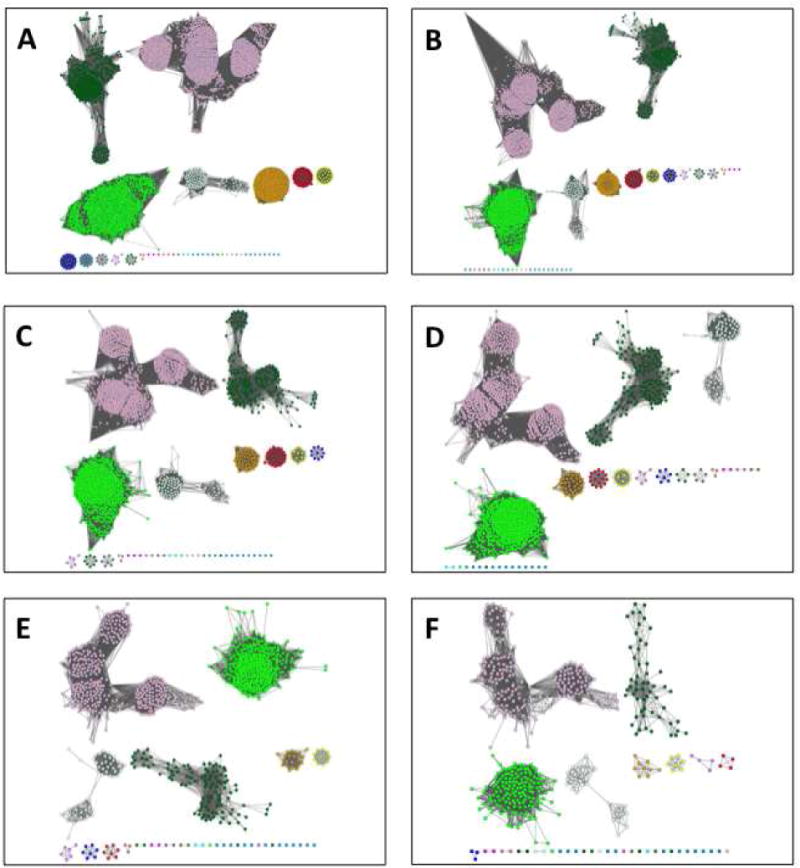
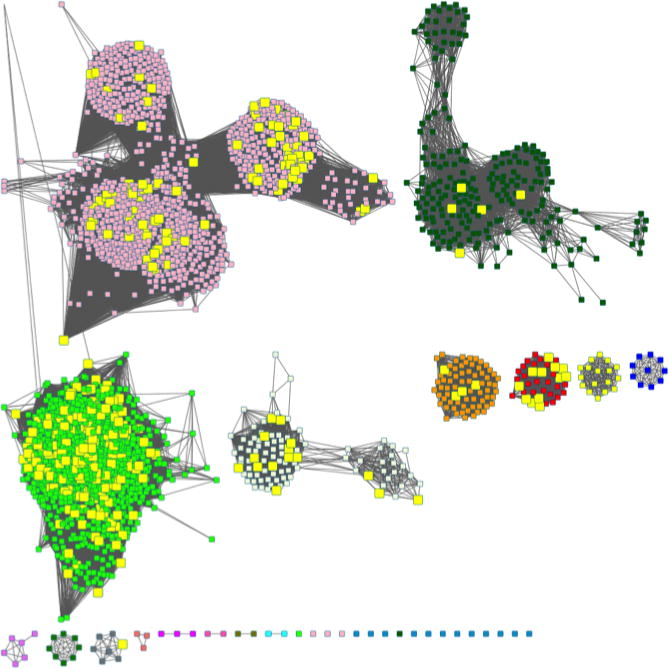
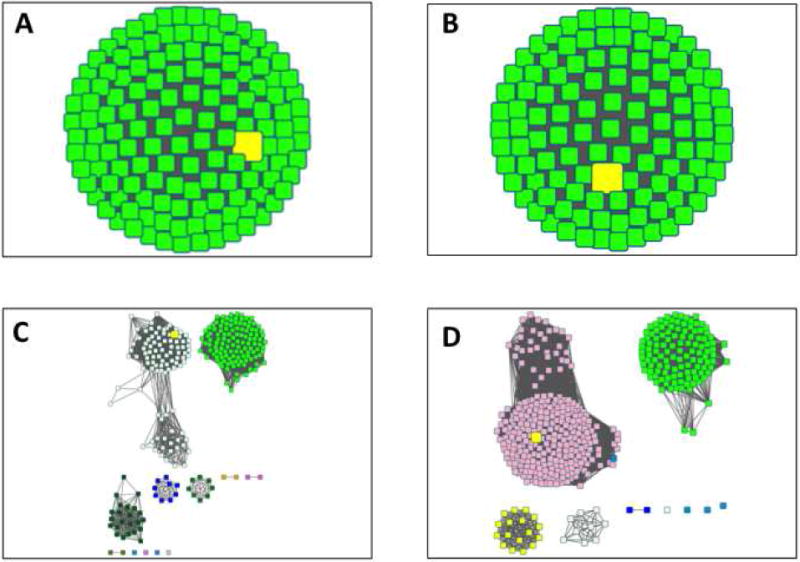
The Enzyme Function Initiative, an NIH/NIGMS-supported Large-Scale Collaborative Project (EFI; U54GM093342; http://enzymefunction.org/), is focused on devising and disseminating bioinformatics and computational tools as well as experimental strategies for the prediction and assignment of functions (in vitro activities and in vivo physiological/metabolic roles) to uncharacterized enzymes discovered in genome projects. Protein sequence similarity networks (SSNs) are visually powerful tools for analyzing sequence relationships in protein families (H.J. Atkinson, J.H. Morris, T.E. Ferrin, and P.C. Babbitt, PLoS One 2009, 4, e4345). However, the members of the biological/biomedical community have not had access to the capability to generate SSNs for their "favorite" protein families. In this article we announce the EFI-EST (Enzyme Function Initiative-Enzyme Similarity Tool) web tool (http://efi.igb.illinois.edu/efi-est/) that is available without cost for the automated generation of SSNs by the community. The tool can create SSNs for the "closest neighbors" of a user-supplied protein sequence from the UniProt database (Option A) or of members of any user-supplied Pfam and/or InterPro family (Option B). We provide an introduction to SSNs, a description of EFI-EST, and a demonstration of the use of EFI-EST to explore sequence-function space in the OMP decarboxylase superfamily (PF00215). This article is designed as a tutorial that will allow members of the community to use the EFI-EST web tool for exploring sequence/function space in protein families.

Keywords: Enzyme; Function discovery; Protein family; Protein sequence analysis; Web tool.


Figures

Figure 1
Figure 1
The growth of the UniProt/SwissProt and UniProt/TrEMBL databases.
Figure 2
Figure 2
A comparison of trees and sequence similarity networks. Panel A, a rooted phylogenetic tree (UPGMA) created with ClustalW; panel B, the sequence similarity network using the same sequence set as shown in Panel A. Proteins are identified by their UniProt accession IDs.
Figure 3
Figure 3
The “Start Page” page for EFI-EST (http://efi.igb.illinois.edu/efi-est/stepa.php).
Figure 4
Figure 4
The dependence of the SSN for the OMP decarboxylase superfamily (PF00215) on the minimum alignment score. Panel A, minimum alignment score 10; panel B, minimum alignment score 15; panel C, minimum alignment score 20; panel D, minimum alignment score 25; panel E, minimum alignment score 30; panel F, minimum alignment score 35 (isofunctional clusters). The networks are 80% representative node networks (see text for explanation).
Figure 5
Figure 5
InterPro homepage (http://www.ebi.ac.uk/interpro/).
Figure 6
Figure 6
The output of InterProScan5 using the sequence of MtOMPDC as the query.
Figure 7
Figure 7
Panel A, the “Length Histogram” for the OMP decarboxylase superfamily (PF00215) showing the number of sequences as a function of length (number of residues). Panel B, a portion of Panel A showing the presence of truncated fragments (< ~190 residues). Panel C, a portion of Panel A showing fragments.
Figure 8
Figure 8
The “Number of Edges Histogram” for the OMP decarboxylase superfamily (PF00215) showing the number of edges calculated by BLAST as a function of alignment score
Figure 9
Figure 9
Panel A, the “Alignment Length Quartile Plot” for the OMP decarboxylase superfamily (PF00215) showing the alignment length used to calculate alignment scores as a function of alignment score. Panel B, a portion of panel A (alignment scores < 130) showing the region describing alignment of single domain proteins.
Figure 10
Figure 10
Panel A, the “Percent Identity Quartile Plot” for the OMP decarboxylase superfamily (PF00215) showing the percent identity as a function of alignment score. Panel B, a portion of panel A (alignment scores < 130) showing the dependence of percent identity on alignment score for single domain proteins.
Figure 11
Figure 11
The “Data Set Completed” page for EFI-EST.
Figure 12
Figure 12
The “Download Network Files” page for EFI-EST showing the sizes of the full and representative networks [for the OMP decarboxylase superfamily (PF00215)] and the buttons for downloading the networks to the user’s computer.
Figure 13
Figure 13
Reactions catalyzed by the OMP decarboxylase superfamily.
Figure 14
Figure 14
Representative node networks for the OMP decarboxylase superfamily (PF00215) using a minimum alignment score of 35. The full network that is too large to be displayed contains 34,202 nodes and 149,161,337 edges. Panel A, 100% rep node network, 8,052 nodes, 6,043,717 edges. Panel B, 90% rep node network, 3,773 nodes, 1,081,205 edges. Panel C, 80% rep node network, 2,670 nodes, 518,614 nodes. Panel D, 70% rep node network, 1,770 nodes, 220,286 edges. Panel E, 60% rep node network, 1,016 nodes, 59,721 edges. Panel F, 50% rep node network, 486 nodes, 8,345 edges.
Figure 15
Figure 15
The 80% rep node network for the OMP decarboxylase superfamily (PF00215) with a minimum alignment score of 35 in which the metanodes with reviewed SwissProt status are highlighted in yellow.
Figure 16
Figure 16
Option A networks (80% rep node networks, minimum alignment score 35, minimum length 190 residues). Panel A, BsOMPDC query. Panel B, EcOMPDC query. Panel C, MtOMPDC query. Panel D, ScOMPDC query. The metanodes with the query sequences are highlighted in yellow.

References

    1. Schnoes AM, Brown SD, Dodevski I, Babbitt PC. Annotation error in public databases: misannotation of molecular function in enzyme superfamilies. PLoS Comput Biol. 2009;5:e1000605. - PMC - PubMed
    1. Caspi R, Altman T, Billington R, Dreher K, Foerster H, Fulcher CA, Holland TA, Keseler IM, Kothari A, Kubo A, Krummenacker M, Latendresse M, Mueller LA, Ong Q, Paley S, Subhraveti P, Weaver DS, Weerasinghe D, Zhang P, Karp PD. The MetaCyc database of metabolic pathways and enzymes and the BioCyc collection of Pathway/Genome Databases. Nucleic Acids Res. 2014;42:D459–71. - PMC - PubMed
    1. C. UniProt. UniProt: a hub for protein information. Nucleic Acids Res. 2015;43:D204–12. - PMC - PubMed
    1. Zhao S, Sakai A, Zhang X, Vetting MW, Kumar R, Hillerich B, San Francisco B, Solbiati J, Steves A, Brown S, Akiva E, Barber A, Seidel RD, Babbitt PC, Almo SC, Gerlt JA, Jacobson MP. Prediction and characterization of enzymatic activities guided by sequence similarity and genome neighborhood networks. Elife. 2014:3. - PMC - PubMed
    1. Hermann JC, Ghanem E, Li Y, Raushel FM, Irwin JJ, Shoichet BK. Predicting substrates by docking high-energy intermediates to enzyme structures. J Am Chem Soc. 2006;128:15882–91. - PubMed

Publication types

MeSH terms

Substances