. 2015 Aug;29(8):3302-14.
doi: 10.1096/fj.14-263343. Epub 2015 Apr 21.

Fabrication of 3-dimensional multicellular microvascular structures

Affiliations

Fabrication of 3-dimensional multicellular microvascular structures

Sebastian F Barreto-Ortiz et al. FASEB J. 2015 Aug.

Abstract

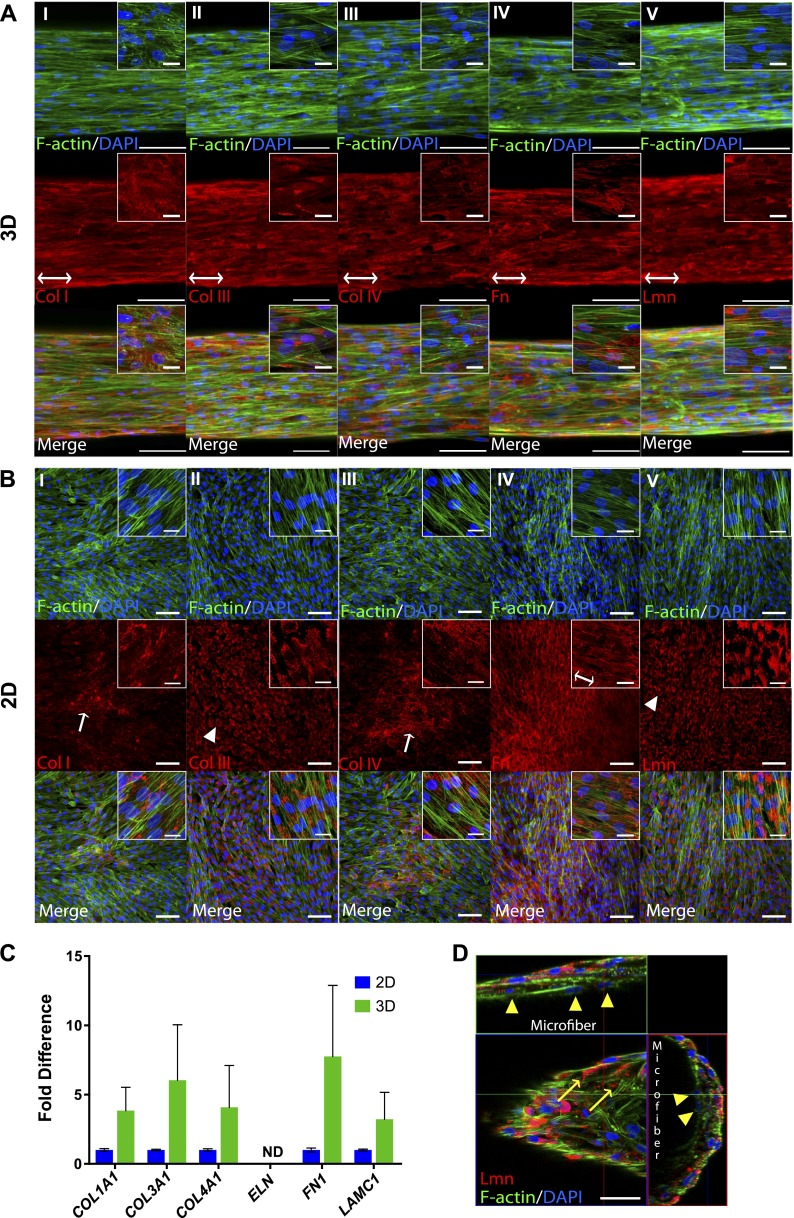
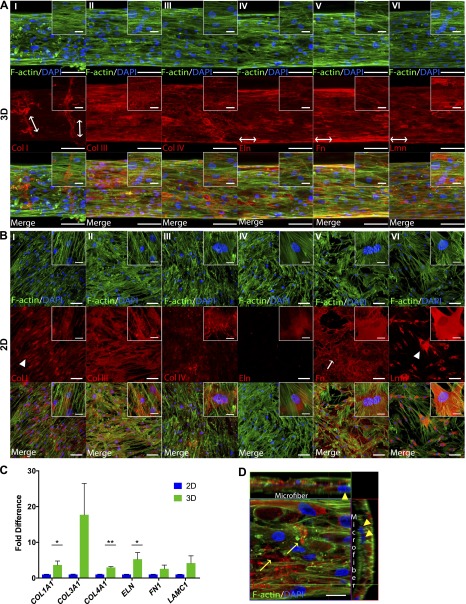
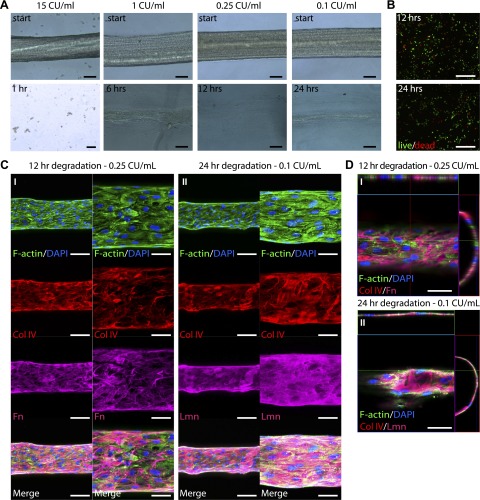
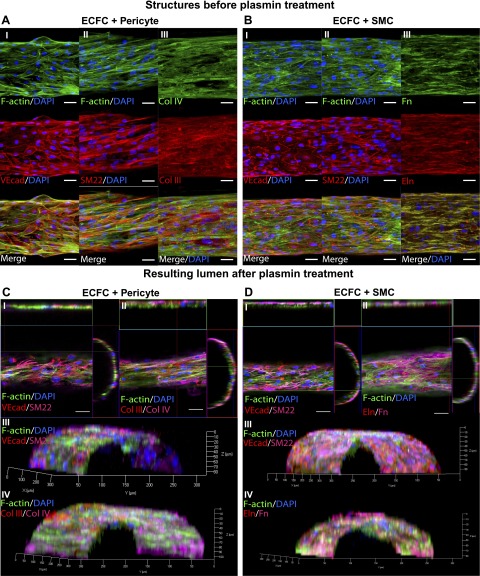
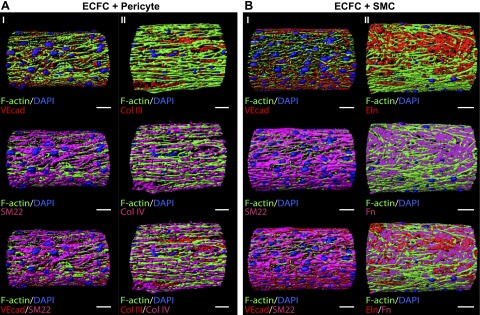
Despite current advances in engineering blood vessels over 1 mm in diameter and the existing wealth of knowledge regarding capillary bed formation, studies for the development of microvasculature, the connecting bridge between them, have been extremely limited so far. Here, we evaluate the use of 3-dimensional (3D) microfibers fabricated by hydrogel electrospinning as templates for microvascular structure formation. We hypothesize that 3D microfibers improve extracellular matrix (ECM) deposition from vascular cells, enabling the formation of freestanding luminal multicellular microvasculature. Compared to 2-dimensional cultures, we demonstrate with confocal microscopy and RT-PCR that fibrin microfibers induce an increased ECM protein deposition by vascular cells, specifically endothelial colony-forming cells, pericytes, and vascular smooth muscle cells. These ECM proteins comprise different layers of the vascular wall including collagen types I, III, and IV, as well as elastin, fibronectin, and laminin. We further demonstrate the achievement of multicellular microvascular structures with an organized endothelium and a robust multicellular perivascular tunica media. This, along with the increased ECM deposition, allowed for the creation of self-supporting multilayered microvasculature with a distinct circular lumen following fibrin microfiber core removal. This approach presents an advancement toward the development of human microvasculature for basic and translational studies.

Keywords: endothelial cell; extracellular matrix; fibrin; microfiber; perivascular cell.


Figures

Figure 1.
Figure 1.
Deposition of Col IV, Fn, and Lmn by ECFCs in 3D vs. 2D. Confocal Z-stack image projections are shown of ECM in (A) 3D fibrin microfibers and (B) 2D fibrin-coated surfaces. Red indicates corresponding ECM, blue shows nuclei, and green indicates F-actin. Scale bars, 100 μm. Inset scale bars, 25 μm. C) RT-PCR analysis of expression of ECM genes by ECFCs cultured on 2D vs. 3D. Error bars represent SEM. Significance levels in the distribution are represented by *P < 0.05 and **P < 0.01 (n ≥ 3).
Figure 2.
Figure 2.
Deposition of Col I, III, and IV, Fn, and Lmn by pericytes in 3D vs. 2D. Confocal Z-stack image projections are shown of ECM in (A) 3D fibrin microfibers and (B) 2D fibrin-coated surfaces. Red indicates corresponding ECM, blue shows nuclei, and green indicates F-actin. Arrows and arrowheads point to randomly deposited and nonpolymerized ECM proteins, respectively. Double-headed arrows show alignment direction of organized ECM deposition. Scale bars, 100 μm. Inset scale bars, 25 μm. C) RT-PCR analysis of expression of ECM genes by SMCs cultured on 2D vs. 3D. ND, not detected. Error bars represent SEM. D) Orthogonal view of pericytes grown on microfibers. Arrowheads point to cells underneath the outer cell layer; arrows point to extracellularly deposited Lmn. Scale bar, 50 μm.
Figure 3.
Figure 3.
Deposition of Col I, III, and IV, Eln, Fn, and Lmn by SMCs in 3D vs. 2D. Confocal Z-stack image reconstructions are shown of ECM in (A) 3D fibrin fibers and (B) 2D fibrin-coated surfaces. Red indicates corresponding ECM, blue shows nuclei, and green indicates F-actin. Arrows and arrowheads point to randomly deposited and nonpolymerized ECM proteins, respectively. Double-headed arrows show alignment direction of organized ECM deposition. Scale bars, 100 μm. Inset scale bars, 25 μm. C) RT-PCR analysis of expression of ECM genes by pericytes cultured on 2D vs. 3D. Error bars represent SEM (n ≥ 2). Significance levels in the distribution are represented by *P < 0.05 and **P < 0.01. D) Orthogonal view of pericytes grown on microfibers. Arrowheads point to cells underneath the outer cell layer; arrows point to extracellularly deposited Lmn. Scale bar, 20 μm.
Figure 4.
Figure 4.
Fiber degradation and viability of cells and ECM after plasmin treatment. A) Light-microscopy images of fibrin microfibers treated with plasmin. Scale bars, 100 μm. B) Immunofluorescence images of viability assays of ECFCs after 12- and 24-hour treatments with plasmin. Red indicates dead cells; green shows live cells. Scale bars, 500 μm. C) Confocal Z-stack image projections of fibrin fibers with ECFCs for 5 days and treated with plasmin for (I) 12 and (II) 24 hours. Scale bars, 100 μm (left) and 50 μm (right). D) Orthogonal view of structures after plasmin treatments. Green indicates F-actin, blue shows nuclei, red indicates Col IV, and magenta shows Fn (I) and Lmn (II) (n ≥ 2). Scale bars, 50 μm.
Figure 5.
Figure 5.
ECFC and perivascular cell cocultures on fibrin microfibers. Confocal Z-stack image projections are shown of ECFCs grown for 5 days on fibrin microfibers followed by 5 days more of (A) pericyte coculture. Red indicates (I) VEcad, (II) SM22, and (III) Col III, blue shows nuclei, and green indicates F-actin. B) SMC coculture. Red indicates (I) VEcad, (II) SM22, and (III) Eln, blue shows nuclei, and green indicates F-actin. Confocal Z-stack image 3D reconstructions are shown of structures cultured for 5 days with ECFCs followed by 5 more days with perivascular cells and then treated for 12 hours with 0.25 CU/ml plasmin. C) Pericyte coculture. Red indicates (I and III) VEcad and (II and IV) Col III, magenta shows (I and III) SM22 and (II and IV) Col IV, blue indicates nuclei, and green shows F-actin. D) SMC coculture. Red indicates (I and III) VEcad and (II and IV) Eln, magenta shows (I and III) SM22 and (II and IV) Fn, blue indicates nuclei, and green shows F-actin. Scale bars, 50 μm (n ≥ 2).
Figure 6.
Figure 6.
Spatial-volume rendering of multicellular microvascular structures after plasmin treatment. Structures were cultured for 5 days with ECFCs followed by 5 more days with perivascular cells and then treated for 12 hours with 0.25 CU/ml plasmin. A) Pericyte coculture. Red indicates (I) VEcad and (II) Col III, magenta shows (I) SM22 and (II) Col IV, blue indicates nuclei, and green shows F-actin. B) SMC coculture. Red indicates (I) VEcad and (II) Eln, magenta shows (I) SM22 and (II) Fn, blue indicates nuclei, and green shows F-actin. Scale bars, 50 μm.

References

    1. Huang G. Y., Zhou L. H., Zhang Q. C., Chen Y. M., Sun W., Xu F., Lu T. J. (2011) Microfluidic hydrogels for tissue engineering. Biofabrication 3, 012001 - PubMed
    1. Auger F. A., Gibot L., Lacroix D. (2013) The pivotal role of vascularization in tissue engineering. Annu. Rev. Biomed. Eng. 15, 177–200 - PubMed
    1. Roy S., Ha J., Trudeau K., Beglova E. (2010) Vascular basement membrane thickening in diabetic retinopathy. Curr. Eye Res. 35, 1045–1056 - PubMed
    1. Hibbs R. G., Burch G. E., Phillips J. H. (1958) The fine structure of the small blood vessels of normal human dermis and subcutis. Am. Heart J. 56, 662–670 - PubMed
    1. Yen A., Braverman I. M. (1976) Ultrastructure of the human dermal microcirculation: the horizontal plexus of the papillary dermis. J. Invest. Dermatol. 66, 131–142 - PubMed

Publication types

LinkOut - more resources