. 2015 May 26;43(10):5221-35.
doi: 10.1093/nar/gkv373. Epub 2015 Apr 21.

Crystal structure of the Bloom's syndrome helicase indicates a role for the HRDC domain in conformational changes

Affiliations

Crystal structure of the Bloom's syndrome helicase indicates a role for the HRDC domain in conformational changes

Joseph A Newman et al. Nucleic Acids Res. .

Abstract

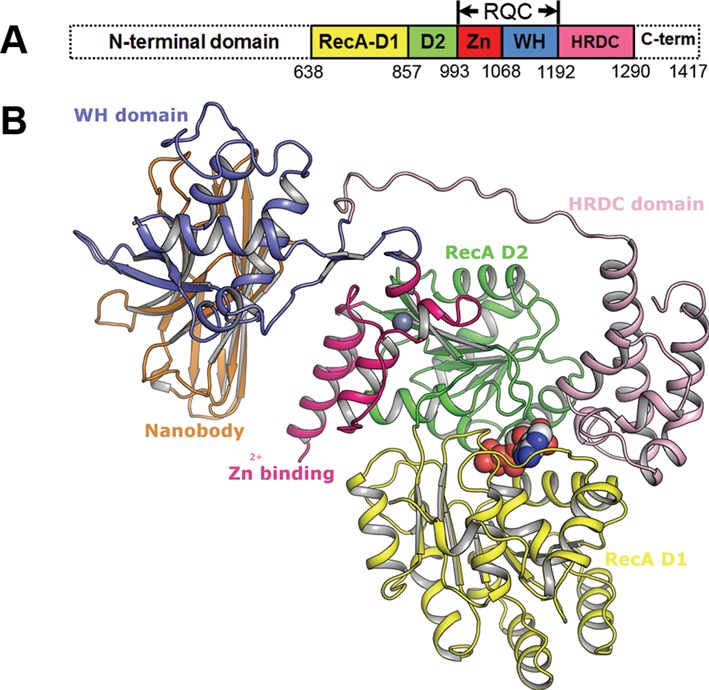
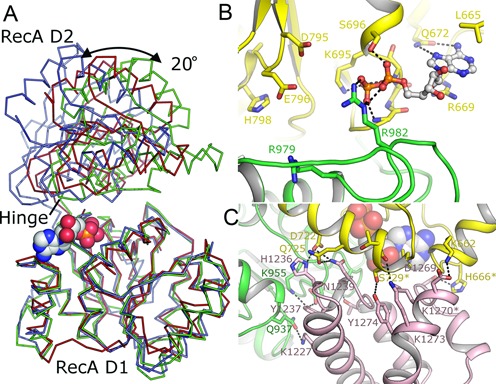
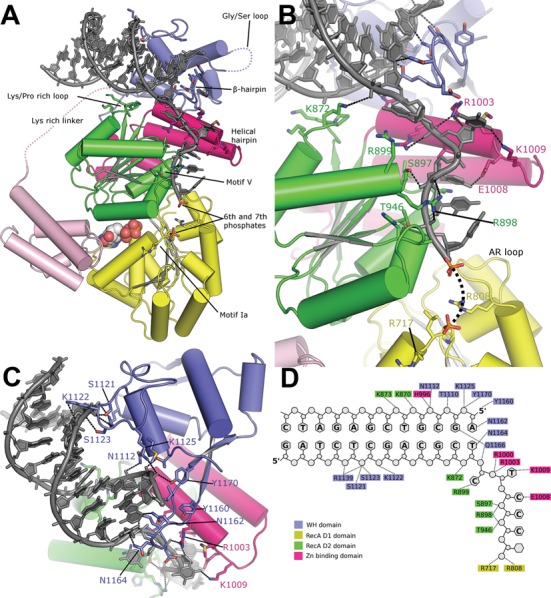
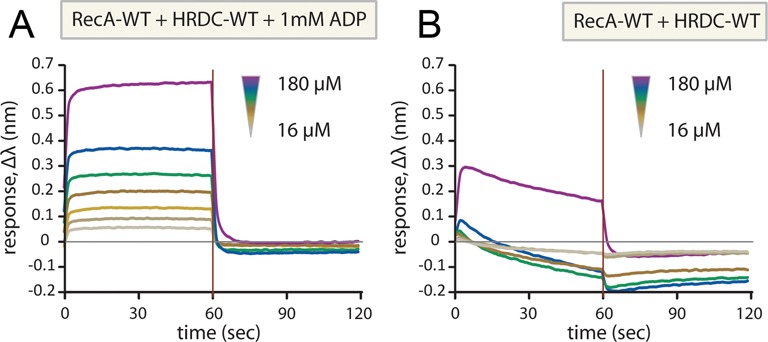
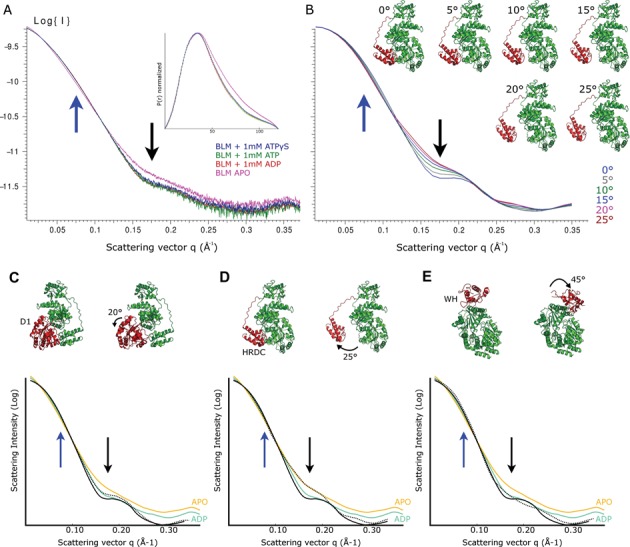
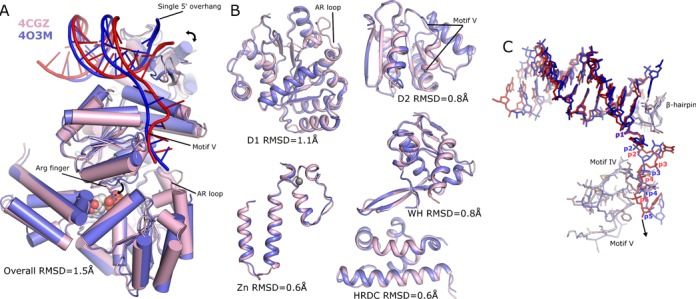
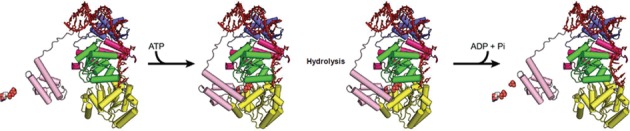
Bloom's syndrome helicase (BLM) is a member of the RecQ family of DNA helicases, which play key roles in the maintenance of genome integrity in all organism groups. We describe crystal structures of the BLM helicase domain in complex with DNA and with an antibody fragment, as well as SAXS and domain association studies in solution. We show an unexpected nucleotide-dependent interaction of the core helicase domain with the conserved, poorly characterized HRDC domain. The BLM-DNA complex shows an unusual base-flipping mechanism with unique positioning of the DNA duplex relative to the helicase core domains. Comparison with other crystal structures of RecQ helicases permits the definition of structural transitions underlying ATP-driven helicase action, and the identification of a nucleotide-regulated tunnel that may play a role in interactions with complex DNA substrates.


Figures

Figure 1.
Figure 1.
Structure of the BLM Nanobody complex. (A) Conserved domains in BLM protein. (B) Structure of the BLM nanobody complex with domains labelled and coloured as in (A), and the ADP and bound zinc ion are shown in the sphere representation. This figure and all subsequent molecular graphics figures were created using the program PyMOL (Schrödinger LCC).
Figure 2.
Figure 2.
Structural details of the nucleotide binding site and the HRDC. (A) Comparison between BLM (green), human RECQ1 (blue) and E. coli RecQ (red) structures superposed on the basis of the D1 domain reveals conformational differences in the relative positioning of the D1-D2 domains, which affect the distance between D2 and the nucleotide bound to D1. (B) Close-up view of the nucleotide binding site with the ADP moiety in the ball and stick format and key interacting residues and motifs labelled. (C) Close-up view of the interface between the HRDC domain and the two RecA domains, with polar contacts highlighted. Residues highlighted with an asterisk were mutated to test their effect on BLM activity.
Figure 3.
Figure 3.
The structure of the BLM-DNA complex. (A) Overview of the BLM-DNA complex with key structural features involved in positioning of the DNA labelled and the expected path of missing loop regions indicated by dashed lines. (B) Close-up of the interface between the WH domain and the double-stranded DNA. (C) The interaction of the 3′-single-stranded overhang with BLM. The sixth and seventh phosphates are shown in stick representation in the positions revealed in the low-resolution structure of the BLM-DNA complex II. (D) A schematic summary of BLM-DNA contacts.
Figure 4.
Figure 4.
Investigation of the interaction of isolated HRDC domain (residues 1206–1298) with the two RecA domains (residues 636–1072) by BLI. The biotinylated HRDC domain was immobilized on the tips, which were then dipped in solutions of the RecA-domains in the concentration range indicated, in the presence (A) or absence (B) of ADP.
Figure 5.
Figure 5.
SAXS measurements and interpretation. (A) Experimental SAXS curves for various BLM nucleotide complexes with the corresponding pair distance distribution p(r) shown in the inset. Blue and black arrows highlight the scattering at q = 0.075 and 0.175 Å2, respectively. (B) Calculated scattering curves for various models with the HRDC and linker region (shown in red) rotated by the indicated angle. (C–E) Comparison of experimental and theoretical SAXS curves for three hypothetical types of domain movements. The solid black line represents the calculated curve for BLM in the BLM DNA complex (contribution of the DNA is omitted) and the dashed line represents the calculated curve following the domain movement. For the experimental data only the APO- and ADP-bound forms are shown and are fitted with a smoothed curve for clarity. (C) Movements of the relative positioning of the D1-D2 domain by up to 20° (based on the conformation of human RECQ1). (D) Movements of the HRDC domain and the linker region by 25°. (E) Movements of the WH domain (based on the conformation of the WH domain in E. coli RecQ).
Figure 6.
Figure 6.
Activities of the HRDC/RecA-core interaction defective mutants BLM(S729A) and BLM(H666A). For each assay, a representative gel and its associated quantification are shown. (A) Helicase efficiency assayed on a forked duplex substrate in the absence (−) or in the presence of increasing concentration of BLM(WT), BLM(S729A) or BLM(H666A). (B) Quantification of helicase assay shown in (A). (C) Branch migration efficiency assayed on a 4-way junction substrate in the absence (−) or in the presence of increasing concentration of BLM(WT), BLM(S729A) or BLM(H666A). (D) Quantification of branch migration assay shown in (C). (E) dHJ dissolution efficiency assayed on a short synthetic dHJ junction substrate in the absence (−) or in the presence of increasing concentration of BLM(WT), BLM(S729A) or BLM(H666A) and in the absence (−) or in the presence (+) of TopoIIIα/Rmi1/Rmi2 (TRR). (F) Quantification of dissolution assay shown in (E). (G-H) All three mutantsH666A, S729A and K1270V were able to suppress the enhanced sister chromatid exchange frequency in BS cells, indicating that the mutant proteins are functional in a cellular context. GMO8505 cells, an SV40 immortalized BS cell line, were transfected with wt or mutant BLM. PSNG13 (BLM-) and PSNF5 (BLM+) were used as controls. The number of SCE per chromosome (G) and the distribution of SCE frequency per chromosome (H) were plotted for each sample. Data represent at least 3 experiments, with error bars showing the standard deviation. For each experiment, a minimum of 500 chromosomes per sample were counted.
Figure 7.
Figure 7.
Comparison of the BLM-DNA complex (4CGZ) with 4O3M. (A) Overall comparison of the BLM-DNA complex (pink with red DNA) and 4O3M (blue with dark blue DNA), with the same view as in Figure 3A. (B) Comparison of individual domains with key structural differences labelled. (C) Comparison of the DNA substrates aligned by superposition of the WH domain. The conserved motifs IV and V on 4CGZ contact phosphates p4 and p5, whereas in 4O3M they make similar contacts to p3 and p4, consistent with a conformation that represents pre- and post-translocation states, respectively.
Figure 8.
Figure 8.
Model of the coupling of ATP hydrolysis/DNA translocation cycle with HRDC-mediated conformational change. We assume that in the absence of nucleotide the HRDC domain is disengaged, and the two RecA domains adopt a different relative orientation in which the distance between ssDNA binding motifs on D1 and D2 is approximately equal to the phosphate to phosphate distance of one nucleotide step (which in our model is based on the conformation of HsRECQ1). Nucleotide binding and hydrolysis is accompanied by the association of the HRDC domain, the adoption of the conformation of D1 and D2 found in the BLM crystal structures and the transition of the DNA from the pre-translocation state (found in our structure), to the post-translocation state based on PDB: 4O3M.

References

    1. German J., Sanz M.M., Ciocci S., Ye T.Z., Ellis N.A. Syndrome-causing mutations of the BLM gene in persons in the Bloom's Syndrome Registry. Hum. Mutat. 2007;28:743–753. - PubMed
    1. Guo R.B., Rigolet P., Ren H., Zhang B., Zhang X.D., Dou S.X., Wang P.Y., Amor-Gueret M., Xi X.G. Structural and functional analyses of disease-causing missense mutations in Bloom syndrome protein. Nucleic Acids Res. 2007;35:6297–6310. - PMC - PubMed
    1. Kaneko H., Orii K.O., Matsui E., Shimozawa N., Fukao T., Matsumoto T., Shimamoto A., Furuichi Y., Hayakawa S., Kasahara K., et al. BLM (the causative gene of Bloom syndrome) protein translocation into the nucleus by a nuclear localization signal. Biochem. Biophys. Res. Commun. 1997;240:348–353. - PubMed
    1. German J., Archibal R., Bloom D. Chromosomal breakage in a rare and probably genetically determined syndrome of man. Science. 1965;148:506–507. - PubMed
    1. Chu W.K., Hickson I.D. RecQ helicases: multifunctional genome caretakers. Nat. Rev. Cancer. 2009;9:644–654. - PubMed

Publication types