. 2015 Apr 9:11:26.
doi: 10.1186/s13007-015-0070-x. eCollection 2015.

Image analysis of anatomical traits in stalk transections of maize and other grasses

Affiliations

Image analysis of anatomical traits in stalk transections of maize and other grasses

Sven Heckwolf et al. Plant Methods. .

Abstract

Background: Grass stalks architecturally support leaves and reproductive structures, functionally support the transport of water and nutrients, and are harvested for multiple agricultural uses. Research on these basic and applied aspects of grass stalks would benefit from improved capabilities for measuring internal anatomical features. In particular, methods suitable for phenotyping populations of plants are needed.

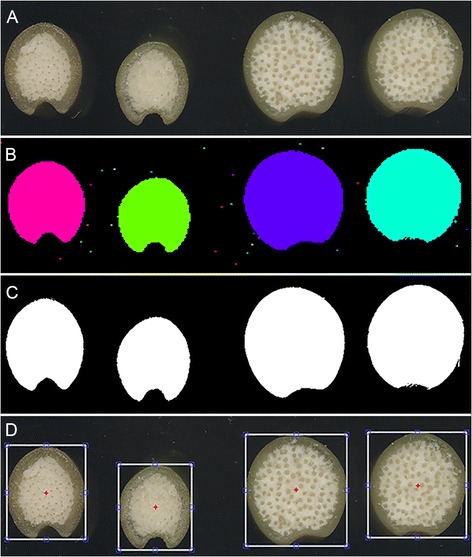
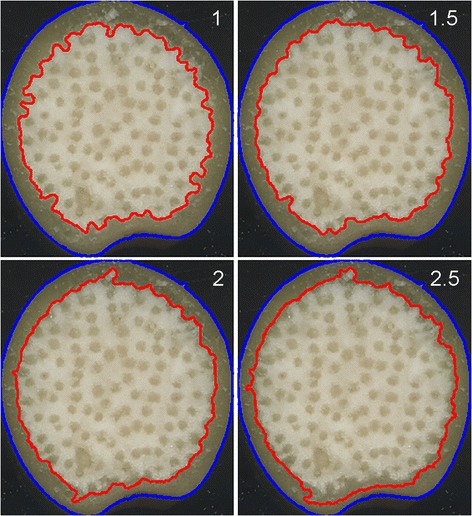
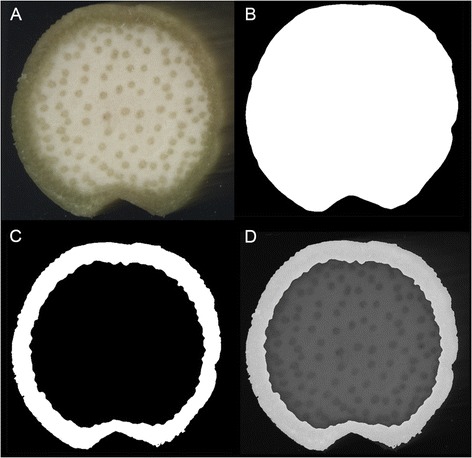
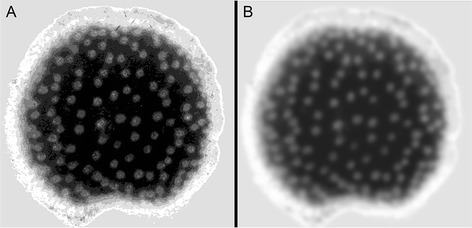
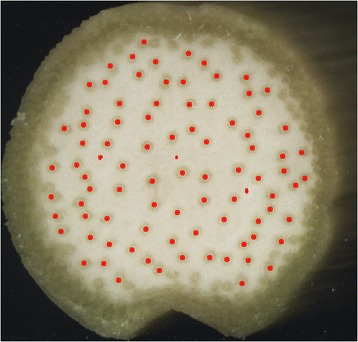
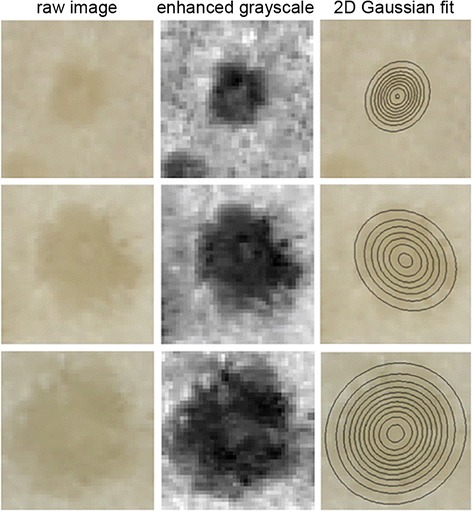
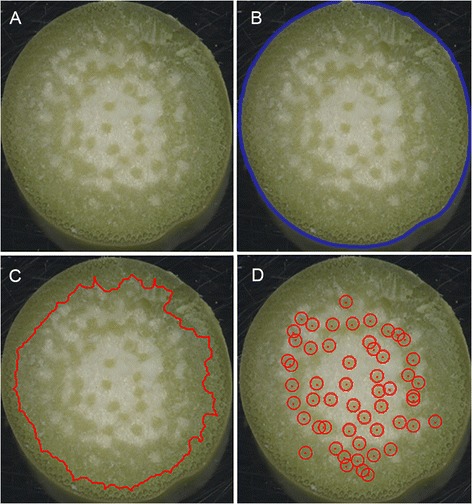
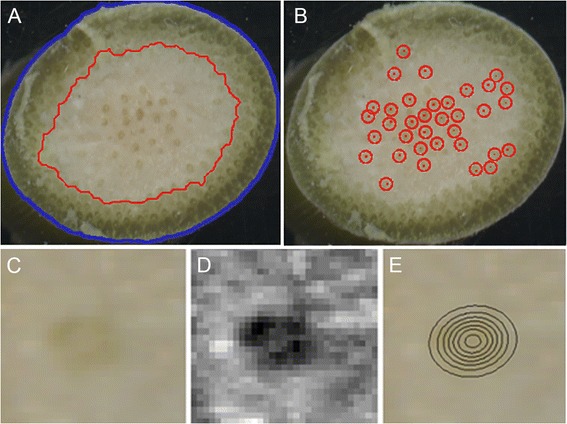
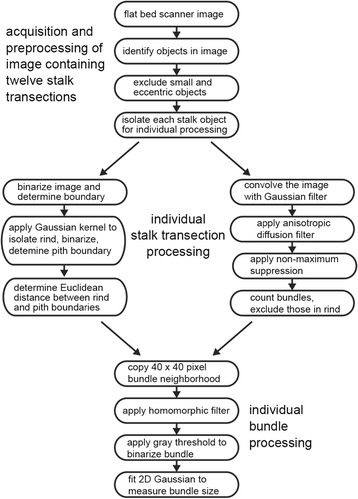
Results: To meet the need for large-scale measurements of stalk anatomy features, we developed custom image processing software that utilized a variety of global thresholding, local filtering, and feature detection methods to measure rind thickness, pith area, vascular bundle counts, and individual vascular bundle size from digital images of hand-cut transections of stalks collected with a flatbed document scanner. The tool determined vascular bundle number with an average accuracy of 90% across maize genotypes that varied five-fold for this trait. The method is demonstrated on maize, sorghum, and Miscanthus stalks. The computer source code is staged for download.

Conclusions: Simplicity of sample preparation and semi-automated analyses enabled by this tool greatly increase measurement throughput relative to standard microscopy-based techniques while maintaining high accuracy. The tool is expected to be useful in genetic and physiological studies of the relationships between stalk anatomy and traits such as biofuel suitability, water use efficiency, or nutrient transport.


Figures

Figure 1
Figure 1
The initial processing steps of maize stalk transections. A) Original, unprocessed images of four stalk transections. The two on the left are the same genotype. The two on the right are the same genotype but different from those on the left. B) Segmenting all non-background objects by a simple thresholding technique identifies the stalk samples and smaller non-stalk objects such as scratches and debris. C) A filtering step based on object size and shape results in a binary image consisting of background and stalk samples. D) A crop box centered on each of the stalk objects is placed on the original image to allow the user to make adjustments to the scenes to be processed.
Figure 2
Figure 2
Discerning the pith/rind boundary. Processing of the green channel of the original image with a Gaussian filter suppresses the rind region to establish the boundary of the pith (red line). The result depends on the width of the Gaussian filter used to convolve the image. Results from filter width 1, 1.5, 2, and 2.5 are shown.
Figure 3
Figure 3
Determining rind width. A) An original stalk transection image. B) Image after binarization. C) Black pith mask determined from boundary found as shown in Figure 2 imposed in the binarized transection to segment the rind (white). D) Rind segment overlayed on the image in A. The width of the rind is the average distance between each point on the pith boundary and its nearest point on the sample perimeter.
Figure 4
Figure 4
Processing to highlight vascular bundles. A grayscale representation of a stalk transection before (A) and after (B) anisotropic filtering. This step renders the vascular bundles as bright spots of mostly uniform intensity that will appear as single rather than split peaks in a gray value intensity plot.
Figure 5
Figure 5
Vascular bundle localization. The position of each peak in grayscale value detected after the filtering step shown in Figure 4 is projected on to the original image and labeled in red. At this stage, the user may choose to select bundles not detected by the program.
Figure 6
Figure 6
Accuracy of vascular bundle counting. A random set of 41 transection images was used to test the accuracy of the tool. A) The vascular bundles located in the pith in 41 transections were counted by a human and by the tool. Each point in the scatter plot represents the two numbers associated with each different section. The diagonal line represents perfect agreement. B) The number of bundles automatically counted relative to the number determined by eye was converted to a percent accuracy value for each transection and presented as a frequency histogram. Fitting a normal distribution to the histogram determined the mean accuracy value to be 90%.
Figure 7
Figure 7
Measuring vascular bundle size. Each row is a different individual vascular bundle. A small, medium, and large bundle was selected for presentation. The left column shows the original unprocessed color image. The center column shows the processed grayscale image enhanced by a homomorphic filtering step. The right column shows the level contours of a 2D Gaussian distribution fit to enhanced grayscale map. The outermost ring is taken as a measure of the size of the bundle.
Figure 8
Figure 8
Applying the tool to transections of Sorghum bicolor stalks. A) Unprocessed image of a hand-cut transection of a sorghum stalk. B) Stalk perimeter (blue line) determined from a binary representation of the transection superimposed on the original image. C) Rind/pith boundary (red line) superimposed on the original image. D) Detected vascular bundles (red circles) superimposed on the original image.
Figure 9
Figure 9
Applying the tool to transections of Miscanthus gigantum stalks. A) Stalk perimeter (blue line) and rind/pith boundary (red line) superimposed on the orginial, unprocessed color image. B) Detected vascular bundles (red circles). C) An individual vascular bundle in the unprocessed image. D) Grayscale representation of A after processing including homomorphic filtering. E) Level contours of the 2D Gaussian distribution fit to the grayscale image in D projected onto the original image. This shows the method measures the very small vascular bundles in thin stalks of Miscanthus.
Figure 10
Figure 10
Flow chart showing the image processing steps from image acquisition to measurement of vascular bundle size.

References

    1. Wang Y, Li J. Genes controlling plant architecture. Curr Op Biotech. 2006;17:123–129. doi: 10.1016/j.copbio.2006.02.004. - DOI - PubMed
    1. Dimond AE. Pressure and flow relations in vascular bundles of the tomato plant. Plant Physiol. 1966;41:119–131. doi: 10.1104/pp.41.1.119. - DOI - PMC - PubMed
    1. Payvandi S, Daly KR, Jones DL, Talboys P, Zygalakis KC, Roose T. A mathematical model of water and nutrient transport in xylem vessels of a wheat plant. Bull Math Biol. 2014;76:566–596. doi: 10.1007/s11538-013-9932-4. - DOI - PubMed
    1. Bruce DM. Mathematical modeling of the cellular mechanics of plants. Philos Trans R Soc Lond B Biol Sci. 2003;358:1437–1444. doi: 10.1098/rstb.2003.1337. - DOI - PMC - PubMed
    1. Zdunek A, Umeda M. Influence of cell size and cell wall volume fraction on failure properties of potato and carrot tissue. J Texture Studies. 2005;36:25–43. doi: 10.1111/j.1745-4603.2005.00002.x. - DOI

LinkOut - more resources