

The fossil record of phenotypic integration and modularity: A deep-time perspective on developmental and evolutionary dynamics
- PMID: 25901310
- PMCID: PMC4413270
- DOI: 10.1073/pnas.1403667112
The fossil record of phenotypic integration and modularity: A deep-time perspective on developmental and evolutionary dynamics
Abstract
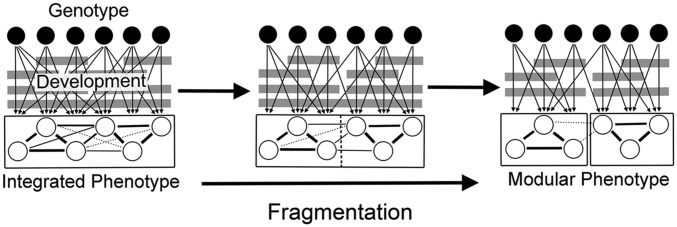
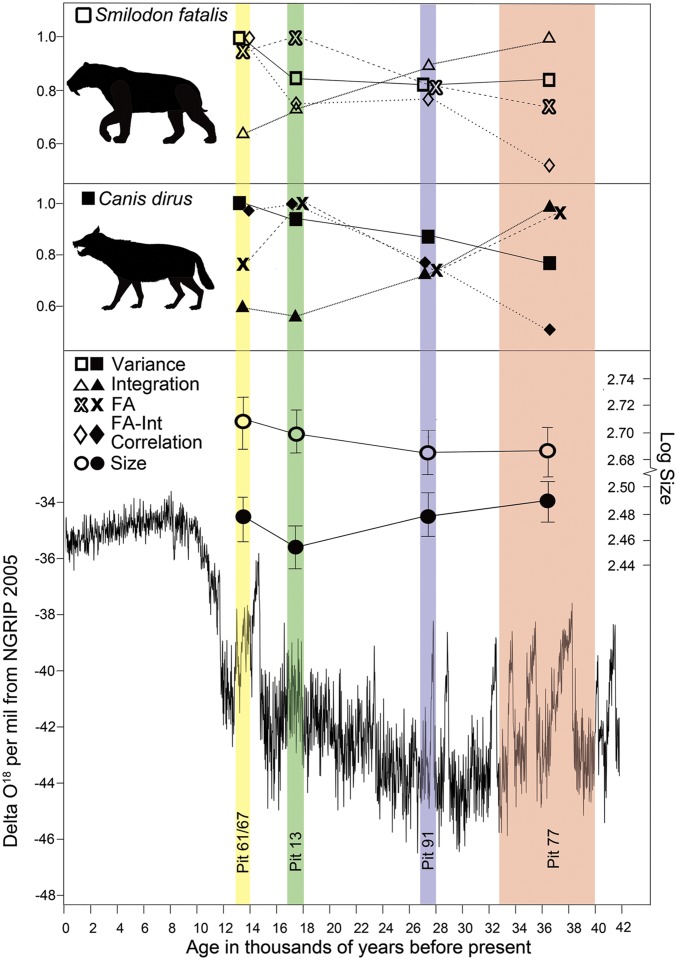
Variation is the raw material for natural selection, but the factors shaping variation are still poorly understood. Genetic and developmental interactions can direct variation, but there has been little synthesis of these effects with the extrinsic factors that can shape biodiversity over large scales. The study of phenotypic integration and modularity has the capacity to unify these aspects of evolutionary study by estimating genetic and developmental interactions through the quantitative analysis of morphology, allowing for combined assessment of intrinsic and extrinsic effects. Data from the fossil record in particular are central to our understanding of phenotypic integration and modularity because they provide the only information on deep-time developmental and evolutionary dynamics, including trends in trait relationships and their role in shaping organismal diversity. Here, we demonstrate the important perspective on phenotypic integration provided by the fossil record with a study of Smilodon fatalis (saber-toothed cats) and Canis dirus (dire wolves). We quantified temporal trends in size, variance, phenotypic integration, and direct developmental integration (fluctuating asymmetry) through 27,000 y of Late Pleistocene climate change. Both S. fatalis and C. dirus showed a gradual decrease in magnitude of phenotypic integration and an increase in variance and the correlation between fluctuating asymmetry and overall integration through time, suggesting that developmental integration mediated morphological response to environmental change in the later populations of these species. These results are consistent with experimental studies and represent, to our knowledge, the first deep-time validation of the importance of developmental integration in stabilizing morphological evolution through periods of environmental change.
Keywords: Late Pleistocene; carnivorans; macroevolution; modularity; phenotypic integration.
Conflict of interest statement
The authors declare no conflict of interest.
Figures
Similar articles
-
First records of Canis dirus and Smilodon fatalis from the late Pleistocene Tule Springs local fauna, upper Las Vegas Wash, Nevada.PeerJ. 2016 Jun 21;4:e2151. doi: 10.7717/peerj.2151. eCollection 2016. PeerJ. 2016. PMID: 27366649 Free PMC article.
-
Morphological homeostasis in the fossil record.Semin Cell Dev Biol. 2019 Apr;88:91-104. doi: 10.1016/j.semcdb.2018.05.016. Epub 2018 May 30. Semin Cell Dev Biol. 2019. PMID: 29787861 Review.
-
Subchondral defects resembling osteochondrosis dissecans in joint surfaces of the extinct saber-toothed cat Smilodon fatalis and dire wolf Aenocyon dirus.PLoS One. 2023 Jul 12;18(7):e0287656. doi: 10.1371/journal.pone.0287656. eCollection 2023. PLoS One. 2023. PMID: 37436967 Free PMC article.
-
Modularity of a Cambrian ptychoparioid trilobite cranidium.Evol Dev. 2011 Jan-Feb;13(1):96-109. doi: 10.1111/j.1525-142X.2010.00459.x. Evol Dev. 2011. PMID: 21210946
-
The fossil record of fish ontogenies: insights into developmental patterns and processes.Semin Cell Dev Biol. 2010 Jun;21(4):400-13. doi: 10.1016/j.semcdb.2009.11.004. Epub 2009 Nov 13. Semin Cell Dev Biol. 2010. PMID: 19914384 Review.
Cited by
-
The future of the fossil record: Paleontology in the 21st century.Proc Natl Acad Sci U S A. 2015 Apr 21;112(16):4852-8. doi: 10.1073/pnas.1505146112. Proc Natl Acad Sci U S A. 2015. PMID: 25901304 Free PMC article. No abstract available.
-
Rethinking Living Fossils.Bioscience. 2018 Oct 1;68(10):760-770. doi: 10.1093/biosci/biy084. Epub 2018 Aug 15. Bioscience. 2018. PMID: 30385890 Free PMC article.
-
Intraspecific variation and directional casque asymmetry in adult southern cassowaries (Casuarius casuarius).J Anat. 2022 Oct;241(4):951-965. doi: 10.1111/joa.13733. Epub 2022 Aug 7. J Anat. 2022. PMID: 35933695 Free PMC article.
-
On Information Rank Deficiency in Phenotypic Covariance Matrices.Syst Biol. 2022 Jun 16;71(4):810-822. doi: 10.1093/sysbio/syab088. Syst Biol. 2022. PMID: 34735008 Free PMC article.
-
Patterns of skeletal integration in birds reveal that adaptation of element shapes enables coordinated evolution between anatomical modules.Nat Ecol Evol. 2021 Sep;5(9):1250-1258. doi: 10.1038/s41559-021-01509-w. Epub 2021 Jul 19. Nat Ecol Evol. 2021. PMID: 34282318
References
-
- Olson EC, Miller RL. Morphological Integration. Univ of Chicago Press; Chicago: 1958.
-
- Berg RL. The ecological significance of corelation pleiades. Evolution. 1960;14:171–180.
-
- Pigliucci M, Preston K. Phenotypic Integration. Oxford Univ Press; Oxford: 2004.
-
- Schlosser G, Wagner GP, editors. Modularity in Development and Evolution. Univ of Chicago Press; Chicago: 2004.
-
- Wagner GP. Homologues, natural kinds and the evolution of modularity. Am Zool. 1996;36(1):36–43.
MeSH terms
LinkOut - more resources
Full Text Sources
Other Literature Sources
Miscellaneous
