. 2015 Apr 22;10(4):e0119719.
doi: 10.1371/journal.pone.0119719. eCollection 2015.

Peak torque and rate of torque development influence on repeated maximal exercise performance: contractile and neural contributions

Affiliations

Peak torque and rate of torque development influence on repeated maximal exercise performance: contractile and neural contributions

Baptiste Morel et al. PLoS One. .

Abstract

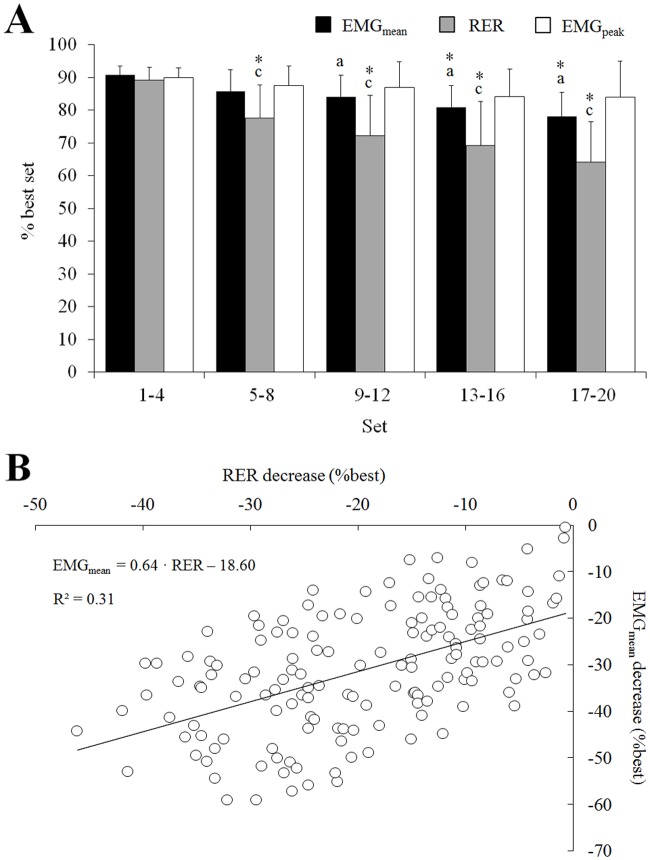
Rapid force production is critical to improve performance and prevent injuries. However, changes in rate of force/torque development caused by the repetition of maximal contractions have received little attention. The aim of this study was to determine the relative influence of rate of torque development (RTD) and peak torque (T(peak)) on the overall performance (i.e. mean torque, T(mean)) decrease during repeated maximal contractions and to investigate the contribution of contractile and neural mechanisms to the alteration of the various mechanical variables. Eleven well-trained men performed 20 sets of 6-s isokinetic maximal knee extensions at 240° · s(-1), beginning every 30 seconds. RTD, T(peak) and T(mean) as well as the Rate of EMG Rise (RER), peak EMG (EMG(peak)) and mean EMG (EMG(mean)) of the vastus lateralis were monitored for each contraction. A wavelet transform was also performed on raw EMG signal for instant mean frequency (if(mean)) calculation. A neuromuscular testing procedure was carried out before and immediately after the fatiguing protocol including evoked RTD (eRTD) and maximal evoked torque (eT(peak)) induced by high frequency doublet (100 Hz). T(mean) decrease was correlated to RTD and T(peak) decrease (R(²) = 0.62; p<0.001; respectively β=0.62 and β=0.19). RER, eRTD and initial if(mean) (0-225 ms) decreased after 20 sets (respectively -21.1 ± 14.1, -25 ± 13%, and ~20%). RTD decrease was correlated to RER decrease (R(²) = 0.36; p<0.05). The eT(peak) decreased significantly after 20 sets (24 ± 5%; p<0.05) contrary to EMG(peak) (-3.2 ± 19.5 %; p=0.71). Our results show that reductions of RTD explained part of the alterations of the overall performance during repeated moderate velocity maximal exercise. The reductions of RTD were associated to an impairment of the ability of the central nervous system to maximally activate the muscle in the first milliseconds of the contraction.


Conflict of interest statement

Competing Interests: One of the authors is affiliated to a commercial company (Almerys). This company works on telecommunication and D. Saboul is employed in the research department. Nevertheless, the authors declare no conflict of interest since D. Saboul worked on the present study for methodological supply concerning the EMG signal analysis which is not related to Almerys commercial’s activity. Furthermore, this does not alter the authors’ adherence to PLOS ONE policies on sharing data and materials.

Figures

Fig 1
Fig 1. Experimental design (A) and neuromuscular testing procedure (B).
Arrows indicate the timing of (A) blood micro sampling for lactate analysis (Lapre and Lapost) and (B) motor nerve stimulation. Three types of stimulation were performed: doublet stimulation at 100 Hz, doublet stimulation at 10 Hz and single twitch (Tw). Stimulations were delivered during the isometric maximal voluntary contraction (IMVC) and on the relaxed potentiated muscle (baseline).
Fig 2
Fig 2. Torque and EMG signals recorded at the start and end of the exercise protocol.
A- Illustration of typical changes in average torque traces recorded during set 1 (black line) and set 20 (grey line) and associated changes in the torque variables extracted: Tmean (dash-dotted lines), Tpeak (triangles) and RTD (dotted lines). B—Illustration of the typical changes in average EMG RMS signal of VL muscle recorded during set 1 (black line) and set 20 (grey line) and associated changes in the EMG variables extracted: EMGmean (dash-dotted lines), EMGpeak (triangles) and RER (dotted lines).
Fig 3
Fig 3. Variations of the torque variables during the exercise protocol.
Mean torque (Tmean), peak torque (Tpeak) and rate of torque development (RTD) decrease over the 20 sets (A) as well as the multiple linear regression of Tmean predicted by Tpeak and RTD (B) is presented. Data are mean ± SD for four sets. Significant difference from set 1–4: * <0.05. Significant difference between Tmean and RTD from the same sets: a; Significant difference between Tmean and Tpeak from the same sets: b; Significant difference between RTD and Tpeak from the same sets: c.
Fig 4
Fig 4. Changes in the EMG variables during the exercise protocol.
Mean EMGrms (EMGmean), peak EMGrms (EMGpeak) and rate of EMG rise (RER) decrease over the 20 sets (A) as well as the simple linear regression of EMGmean predicted by RER (B) is presented. Data are mean ± SD for four sets. Significant difference from set 1–4: * <0.05. Significant difference between EMGmean and RER from the same sets: a; Significant difference between EMGmean and EMGpeak from the same sets: b; Significant difference between RER and EMGpeak from the same sets: c.
Fig 5
Fig 5. Relationship between changes in rate of EMG rise and variations of rate of torque development during the exercise protocol.
The simple linear regression of the rate of torque development (RTD) predicted by the rate of rate of EMG rise (RER) is presented.
Fig 6
Fig 6. Changes in time-frequency EMG parameters during the exercise protocol.
Instant mean power frequency (ifmean) during the first (black) and the twentieth (grey) set within each portion (75 ms) of the contraction is presented on panel A (A). Significant differences first vs. twentieth set: *: p<0.05, **: p<0.01, ***: p<0.001. Wavelet transform representation of the vastus lateralis EMG signal of one contraction is presented for the first (B) and the twentieth (C) set. The intensity patterns are indicated on a colour scale (0–100% of the first set), with red corresponding to higher intensities. The frequency content is expressed in pseudo-frequencies (Hz) calculated from wavelet transform. Data are mean of the eight contractions of the eleven subjects for the first and the twentieth set.
Fig 7
Fig 7. Changes pre- vs. post-fatigue for peak and ‘rate of’ data.
Tpeak: voluntary peak torque; eTpeak: evoked peak torque; nEMGpeak: peak EMGrms normalized with Mmax; RTD: voluntary rate of torque development; eRTD: evoked rate of torque development; nRER: rate of EMG Rise normalized with Mmax. Data are mean ±SD. Significant changes post- vs pre-fatigue: *: p<0.05, **: p<0.01, ***: p<0.001.

References

    1. Bigland-Ritchie B, Woods J. Changes in muscle contractile properties and neural control during human muscular fatigue. Muscle Nerve. 1984;7: 691–699. - PubMed
    1. Christian RJ, Bishop DJ, Billaut F, Girard O. Peripheral fatigue is not critically regulated during maximal, intermittent, dynamic leg extensions. J Appl Physiol. 2014;117: 1063–1073. 10.1152/japplphysiol.00988.2013 - DOI - PubMed
    1. Buckthorpe MW, Pain MT, Folland JP. Bilateral deficit in explosive force production is not caused by changes in agonist neural drive. PLOS ONE. 2013;8: e57549 10.1371/journal.pone.0057549 - DOI - PMC - PubMed
    1. Harwood B, Choi I, Rice CL. Reduced motor unit discharge rates of maximal velocity dynamic contractions in response to a submaximal dynamic fatigue protocol. J Appl Physiol. 2012;113: 1821–1830. 10.1152/japplphysiol.00879.2012 - DOI - PubMed
    1. Cheng AJ, Rice CL. Fatigue-induced reductions of torque and shortening velocity are muscle dependent. Med Sci Sport Exer. 2010;42: 1651–1659. 10.1249/MSS.0b013e3181d6c5b5 - DOI - PubMed