. 2015 Aug;156(8):2969-83.
doi: 10.1210/en.2015-1161. Epub 2015 Apr 22.

Formin 1 Regulates Ectoplasmic Specialization in the Rat Testis Through Its Actin Nucleation and Bundling Activity

Affiliations

Formin 1 Regulates Ectoplasmic Specialization in the Rat Testis Through Its Actin Nucleation and Bundling Activity

Nan Li et al. Endocrinology. 2015 Aug.

Abstract

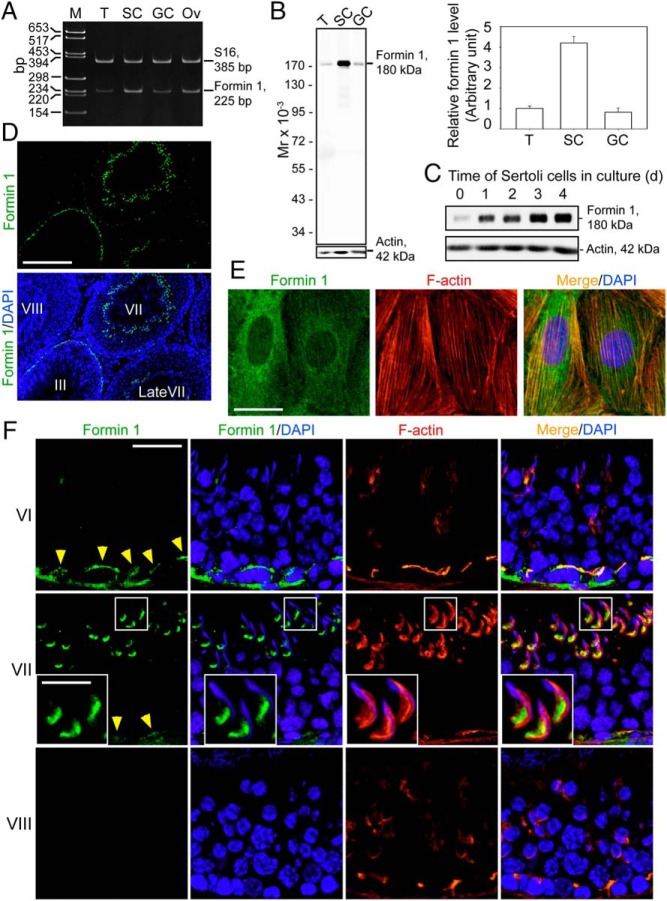
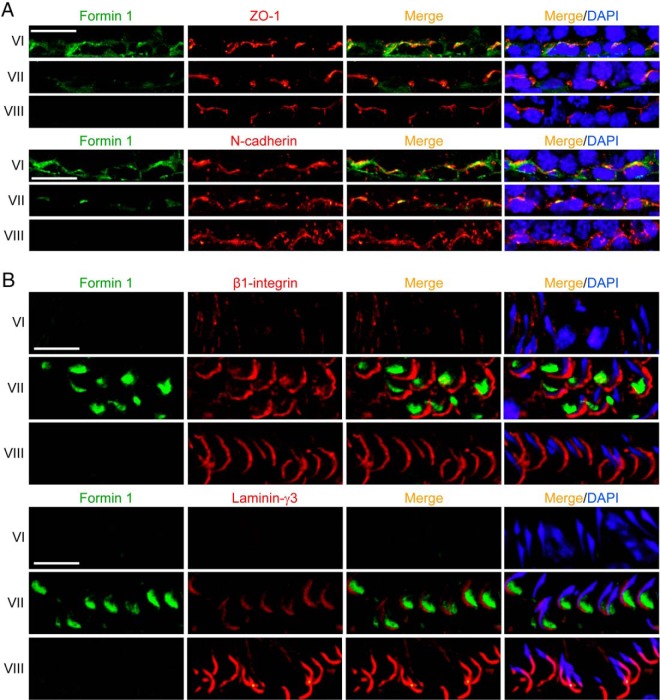
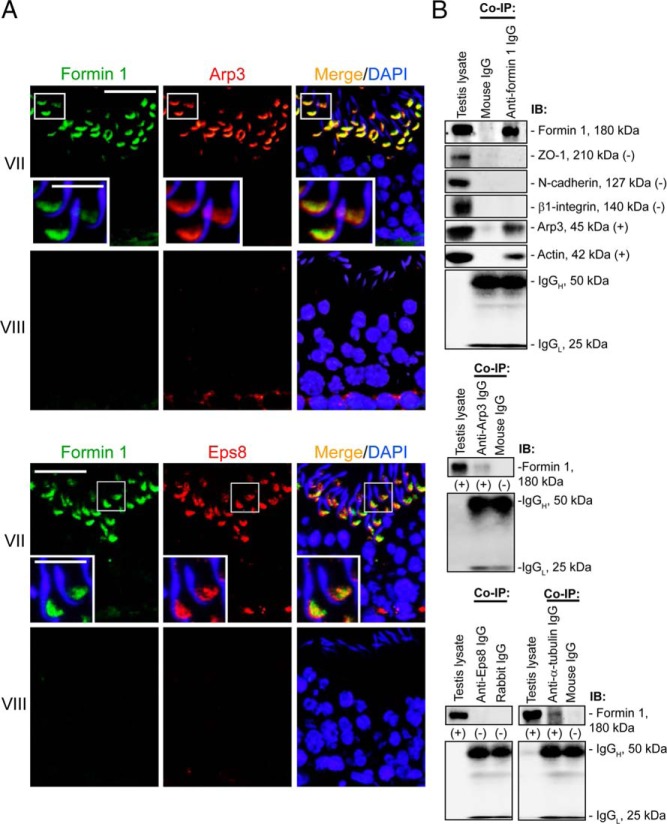
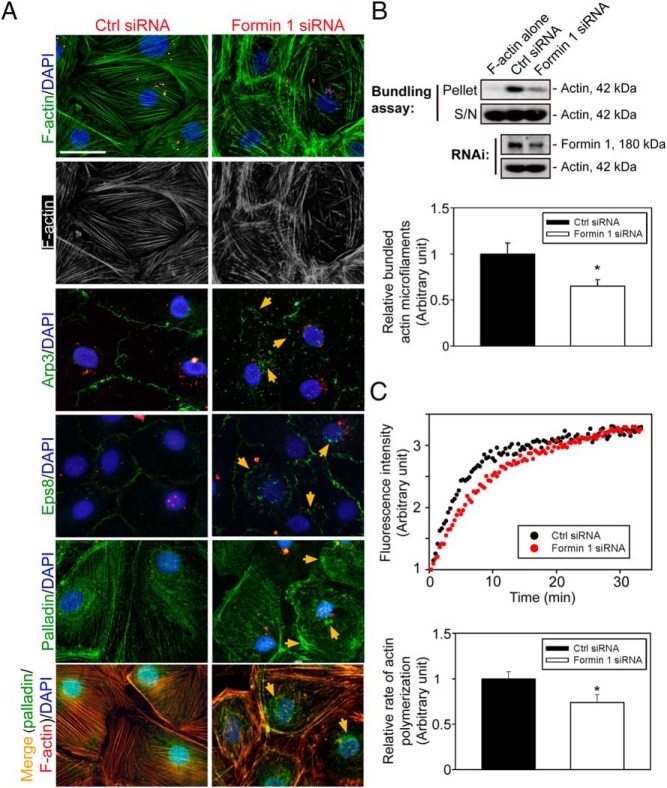
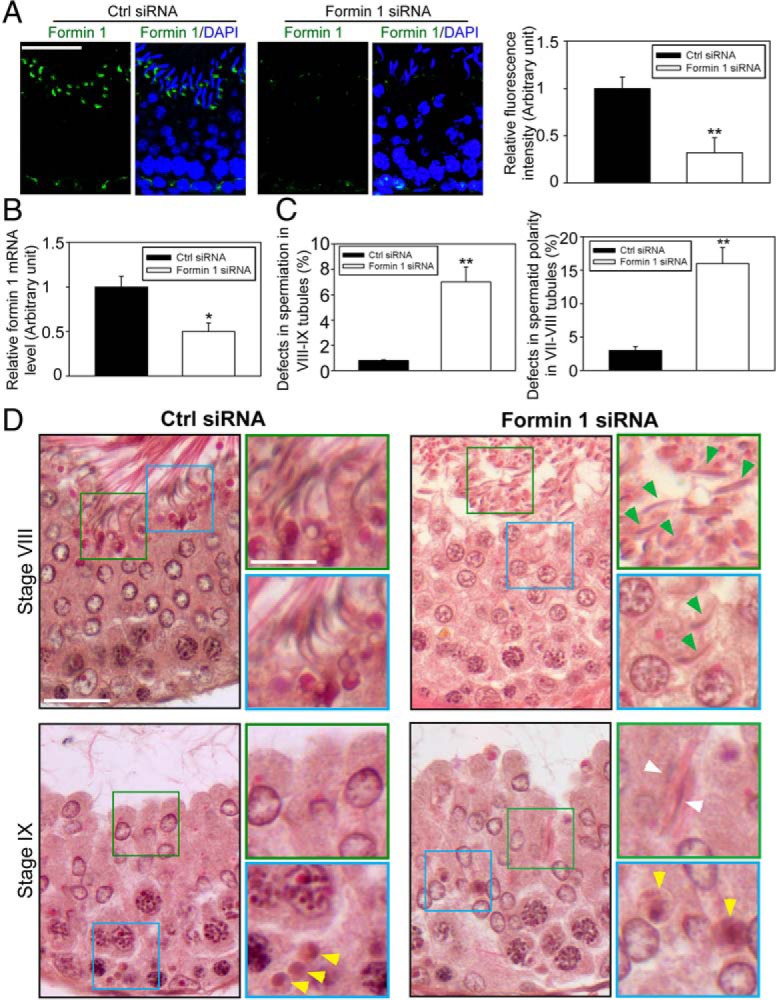
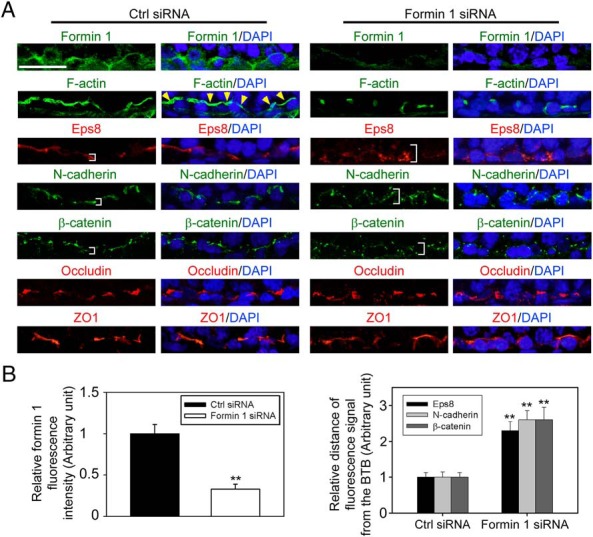
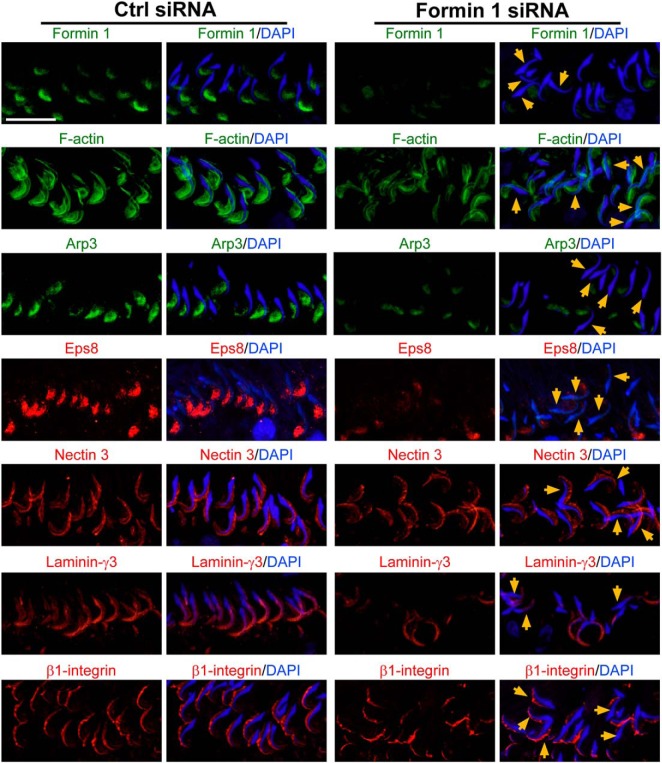
During spermatogenesis, developing spermatids and preleptotene spermatocytes are transported across the adluminal compartment and the blood-testis barrier (BTB), respectively, so that spermatids line up near the luminal edge to prepare for spermiation, whereas preleptotene spermatocytes enter the adluminal compartment to differentiate into late spermatocytes to prepare for meiosis I/II. These cellular events involve actin microfilament reorganization at the testis-specific, actin-rich Sertoli-spermatid and Sertoli-Sertoli cell junction called apical and basal ectoplasmic specialization (ES). Formin 1, an actin nucleation protein known to promote actin microfilament elongation and bundling, was expressed at the apical ES but limited to stage VII of the epithelial cycle, whereas its expression at the basal ES/BTB stretched from stage III to stage VI, diminished in stage VII, and was undetectable in stage VIII tubules. Using an in vitro model of studying Sertoli cell BTB function by RNA interference and biochemical assays to monitor actin bundling and polymerization activity, a knockdown of formin 1 in Sertoli cells by approximately 70% impeded the tight junction-permeability function. This disruptive effect on the tight junction barrier was mediated by a loss of actin microfilament bundling and actin polymerization capability mediated by changes in the localization of branched actin-inducing protein Arp3 (actin-related protein 3), and actin bundling proteins Eps8 (epidermal growth factor receptor pathway substrate 8) and palladin, thereby disrupting cell adhesion. Formin 1 knockdown in vivo was found to impede spermatid adhesion, transport, and polarity, causing defects in spermiation in which elongated spermatids remained embedded into the epithelium in stage IX tubules, mediated by changes in the spatiotemporal expression of Arp3, Eps8, and palladin. In summary, formin 1 is a regulator of ES dynamics.


Figures

Figure 1.
Figure 1.
Cellular and stage-specific localization of formin 1 in the rat testis. A, Expression of formin 1 in adult rat testes (T), Sertoli cells (SC), and GCs vs ovary (Ov; positive control) were analyzed by RT-PCR with S-16 as a loading PCR control using corresponding specific primer pairs (Supplemental Table 2). M, DNA markers in base pairs. The identity of the PCR product was confirmed by direct nucleotide sequencing. B, Specificity of the antiformin 1 antibody (Supplemental Table 1) was assessed by immunoblotting, using lysates obtained from adult rat testes (T), SC, and GCs with β-actin as a protein loading control. Each bar in the histogram is a mean ± SD of three experiments. Formin 1 protein level in T was arbitrarily set at 1. C, Relative steady-state protein level of formin 1 expressed by Sertoli cells when cultured in vitro for 0–4 days in serum-free F12/DMEM medium with β-actin as a protein loading control. D, Stage-specific localization of formin 1 (green fluorescence) in the seminiferous epithelium of adult rats testes. Cell nuclei were visualized by DAPI (blue). Scale bar, 130 μm. E, Staining of Sertoli cells with antiformin 1 antibody (green fluorescence) and rhodamine phalloidin (red fluorescence) to visualize formin 1 and F-actin, respectively, illustrating partial colocalization of formin 1 and F-actin in Sertoli cell cytosol. Sertoli cell nuclei were visualized by DAPI (blue). Scale bar, 15 μm. F, Stage-specific expression of formin 1 (green fluorescence) and its colocalization with F-actin (red) in the seminiferous epithelium of adult rat testes. Cell nuclei were visualized by DAPI (blue). Formin 1 colocalized with F-actin at the BTB (annotated by yellow arrowheads) and tunica propria at stages III-VI, and formin 1 expression rapidly diminished at stage VII and became virtually nondetectable at stage VIII at the basal ES when the BTB undergoes extensive restructuring to facilitate the transport of preleptotene spermatocytes. However, at the apical ES, formin 1 restrictively expressed at stage VII, colocalizing with F-actin at the concave side of the elongating spermatid. Scale bar, 40 μm; inset, 12 μm.
Figure 2.
Figure 2.
Formin 1 is a component of basal and apical ES in the seminiferous epithelium in adult rat testes. A, Dual-labeled immunofluorescence analysis illustrated partial colocalization of formin 1 (green fluorescence) with TJ protein ZO-1 (red fluorescence) and basal ES protein N-cadherin (red) at the BTB, most notably at stage VI, and the expression of formin 1 at the basal ES was weakened at stage VII; and at stage VIII, formin 1 was virtually nondetectable at the basal ES during BTB restructuring. Scale bar, 30 μm. B, Formin 1 (green fluorescence) was expressed only at stage VII of the epithelial cycle at the apical ES, and it was partially colocalized with Sertoli cell-specific apical ES protein β1-integrin (red fluorescence) at the concave (ventral) side of spermatid heads because most of β1-integrin expression was restricted to the convex (dorsal) side of spermatid heads. Formin 1, however, was not colocalized with spermatid-specific apical ES protein laminin-γ3 (red fluorescence), which was localized to the spermatid head except its rear end at the apical ES. Scale bar, 20 μm.
Figure 3.
Figure 3.
Formin 1 structurally interacts with branched actin nucleation protein Arp3 and also cytoskeletal proteins actin and α-tubulin. A, At stage VII, formin 1 (green fluorescence) colocalized with actin regulating proteins Arp3 (a branched actin nucleation protein; red fluorescence) (upper panel) and Eps8 (red fluorescence, an actin barbed end capping and bundling protein) (lower panel) at the apical ES in the seminiferous epithelium, at the concave (ventral) side of spermatid heads; formin 1 expression at the basal ES/BTB was already weakened, and Arp3 expression was virtually undetectable, even though Eps8 remained highly expressed. At stage VIII, the expression of formin 1 and Eps8 at the apical ES and basal ES/BTB became undetectable, but the expression of Arp3 was high at the basal ES but none at the apical ES. Scale bar, 40 μm; inset, 12 μm. B, A study by Co-IP to assess the interaction between formin 1 and selected component proteins of the ES and cytoskeletal elements. Rabbit or mouse IgG served as a negative control, and testis lysate without subjected to Co-IP served as a positive control. Formin 1 was found to interact with Arp3 (also confirmed when anti-Arp3 IgG, besides antiformin 1 IgG, was used as an immunoprecipitating antibody), actin, and tubulin but not Eps8. Data shown herein are representative findings of an experiment that was repeated three to four times that yielded similar results. IB, immunoblotting.
Figure 4.
Figure 4.
Knockdown of formin 1 at the Sertoli cell BTB in vitro by RNAi perturbs the TJ permeability barrier function via changes in the localization of basal ES proteins. Sertoli cells cultured for 3 days with an established functional TJ permeability barrier were transfected with rat formin 1-specific siRNA duplexes (Formin 1 siRNA) vs nontargeting negative control (Ctrl siRNA) for 24 hours (ie, d 4). Thereafter cells were washed twice to remove transfection reagents and cultured for additional 24 hours (ie, d 5) before their termination for RNA extraction, cell lysate preparation, or staining with specific antibody. A, Knockdown of formin 1 by formin 1-specific siRNA duplexes at 50 nM vs nontargeting negative controls was examined by RT-PCR. M, DNA marker in base pairs. B, A study by immunoblotting that illustrated the expression of formin 1 was knockdown up to approximately 70% (see also histogram in lower panel) without any apparent off-target effects when other selected BTB-associated proteins were examined. Actin and GAPDH served as protein loading controls. Each bar in the histogram is a mean ± SD of four experiments. **, P < .01. C, Cytotoxicity of siRNA duplexes at varying concentrations on Sertoli cells was examined by sodium 3′-[1-(phenylaminocarbonyl)-3,4-tetrazolium]-bis(4-methoxy-6-nitro) benzene sulfonic acid hydrate (XTT) assay on day 5 in cultures with transfection performed on day 3, which monitored cell viability. In short, no cytotoxicity to Sertoli cells was detected at a dose of siRNA duplexes at or less than 200 nM. D, A knockdown of formin 1 was found to perturb the Sertoli cell TJ permeability barrier. Each data point is a mean ± SD of triplicate bicameral units from a representative experiment, which was repeated three times and yielded similar results excluding pilot experiments. *, P < .05. E, A study by IF that confirmed the silencing of formin 1 by approximately 75% (see F, composite data of four experiments; **, P < .01), when the cellular distribution of basal ES proteins N-cadherin and β-catenin, but not TJ proteins occludin and ZO-1, were perturbed in which these proteins no longer tightly localized to the cell-cell interface (annotated by orange arrowheads) but were internalized instead. siGLO red transfection indicator (red fluorescence; Dharmacon) was used to track successful transfection. Scale bar, 15 μm, which applies to other micrographs. GAPDH, glyceraldehyde-3-phosphate dehydrogenase.
Figure 5.
Figure 5.
Knockdown of formin 1 altered the organization of actin microfilaments in Sertoli cells mediated by changes in the localization of Arp3, Eps8, and palladin. A, Knockdown of formin 1 led to truncation and disorganization of actin microfilaments in Sertoli cells, and many of these microfilaments were shortened and failed to stretch across the entire Sertoli cell. These changes apparently were mediated by changes in the localization of branched actin nucleation protein Arp3 that effectively converted actin microfilaments from a bundled to branched/unbundled configuration. Arp3 was found to be extensively internalized (annotated by orange arrows), which thus induced microfilament branching and truncation in the Sertoli cell cytosol. The actin microfilament barbed-end capping and bundling protein Eps8 as well as the actin cross-linking and bundling protein palladin were also found to be mislocalized in which Eps8 was internalized (annotated by orange arrows); and palladin (green fluorescence) no longer tightly associated with actin microfilaments across the Sertoli cell in the cytosol as noted in controls (see merge image from a different experiment) but appeared as patches of aggregates (annotated by orange arrows), thereby failing to confer actin microfilaments into a bundled configuration as noted in control cells. siGLO red transfection indicator (red fluorescence; Dharmacon) was used to track successful transfection. Scale bar, 15 μm, which applies to other micrographs. B, A study by biochemical assay to confirm findings shown in panel A by assessing actin bundling activity (top panel) after formin 1 knockdown (lower panel), in which the pellet contained bundled actin microfilaments, whereas S/N (supernatant) contained single (ie, unbundled) actin microfilaments. Findings shown on the upper panel are summarized in the histogram on the lower panel with each bar represents a mean ± SD of four experiments. *, P < .05. C, Knockdown of formin 1 was also found to perturb actin polymerization after formin 1 knockdown (upper panel). The kinetics of actin polymerization was assessed during the initial 8 minutes of the actin polymerization assay (see lower panel) using data shown on the upper panel (see Materials and Methods for details), illustrating the knockdown of formin 1 indeed perturbed actin polymerization kinetics, with each bar representing a mean ± SD of three experiments. *, P < .05. Ctrl, control.
Figure 6.
Figure 6.
Knockdown of formin 1 in the testis in vivo perturbs spermatid adhesion and polarity in the seminiferous epithelium. Testes of adult rats (∼70 dpp, day postpartum, ∼325–350 g body weight) were transfected with formin 1-specific siRNA duplexes vs nontargeting negative controls on days 0, 1, and 2; and rats were euthanized on day 5 (n = 6 rats). Thereafter testes were collected, one of the two testes from each rat was frozen in liquid nitrogen for lysate preparation and RNA extraction) or to obtain frozen sections for immunofluorescence analysis (IF) (ie, n = 3 testes from 3 rats), and the other testis was fixed in Bouin's fixative to obtain paraffin sections for histological analysis (ie, n = 3 testes from three rats). A, Frozen sections of testes from both groups were stained for formin 1 (green), cell nuclei were visualized with DAPI (blue). Scale bar, 40 μm, which applies to other micrographs. Due to the stage-specific expression of formin 1 at the apical ES in stage VII tubules, we focused our analysis on this stage. At least 30 stage VII tubules of each testis from formin 1 knockdown group (n = 3 rats) vs control group (n = 3 rats) were analyzed (see histogram on the right panel, with each bar represents a mean ± SD of three rats in which formin 1 fluorescence signal was considerably diminished after formin 1 knockdown in vivo; **, P < .01). B, The steady-state formin 1 mRNA level in the testis of formin 1 knockdown vs control groups was examined by quantitative PCR, with GAPDH serving as a loading and PCR control. The mRNA level of formin 1 was reduced by at least 50% in the testis in vivo in the formin 1 vs nontargeting control group with three rats for each group; *, P < .05. C, Stage VIII-IX tubules displaying defects of spermiation was scored (∼30 VIII-IX tubules per testis were randomly scored with three rats with a total of ∼100 tubules). A tubule was scored to have defects in spermiation wherein more than five elongated spermatids per cross-section of a tubule were found to be embedded inside the seminiferous epithelium that failed to undergo spermiation. Stage VII-VIII tubule was scored when more than five spermatids lose their polarity and considered to have defects in spermatid polarity. Data were expressed as percentage of stage VII-IX tubules with defects in both groups; **, P < .01. D, Histological analysis of cross-sections of testes in both groups in stage VIII and IX tubules. Control testes were transfected with nontargeting negative control siRNA duplexes (left panel) vs formin 1-specific siRNA duplexes (right panel). Defects in spermiation were noted in formin 1 knockdown testes at both stage VIII and also IX tubules in which spermatids were entrapped inside the epithelium (annotated by white arrowheads) and many spermatids were found to lose their polarity in which spermatid heads no longer pointing toward the basement membrane but deviated at 90° from the intended orientation (annotated by green arrowheads). Boxed areas in green or blue was magnified and shown in insets. Scale bar, 40 μm; inset, 12 μm. Ctrl, control.
Figure 7.
Figure 7.
Knockdown of formin 1 in adult rat testes in vivo perturbs the distribution of F-actin, actin regulatory proteins, and basal ES proteins at the BTB. A, Testes transfected with formin 1-specific siRNA duplexes vs nontargeting negative control duplexes were used to obtain frozen sections and stained for formin 1 (green fluorescence), F-actin (green fluorescence), actin barded-end capping and bundling protein Eps8 (red fluorescence), basal ES proteins N-cadherin (green fluorescence) and β-catenin (green fluorescence), and TJ proteins occludin (red fluorescence) and ZO-1 (red fluorescence). Cell nuclei were visualized with DAPI (blue). Because formin 1 was highly expressed at the basal ES/BTB in stage VI tubules, considerably diminished in stage VII tubules, and virtually nondetectable in stage VIII tubules, this analysis was performed in stage VI tubules. Expression of formin 1 became considerably diminished at the BTB in stage VI tubules after formin 1 silencing vs controls. In control testes, F-actin was prominently expressed and appeared as a continuous belt surrounding the BTB (see yellow arrowheads), after formin 1 knockdown, and F-actin no longer surrounded the BTB continuously but appeared broken into fragments. This is likely due to the mislocalization of Eps8, which no longer tightly localized to the BTB (see white brackets). This misorganization of F-actin then impeded the distribution of basal ES proteins N-cadherin and β-catenin because these adhesion proteins also localized diffusely from the BTB (see white brackets) after formin 1 knockdown vs testes transfected with nontargeting negative control duplexes (right panel). Scale bar, 30 μm, which applies to other micrographs. B, Composite data of findings shown in panel A in which each bar represents a mean ± SD three testes, illustrating the knockdown of formin 1 (left panel) perturbed the localization of Eps8, N-cadherin, and β-catenin at the BTB; **, P < .01. Ctrl, control.
Figure 8.
Figure 8.
Knockdown of formin 1 in adult rat testes in vivo perturbs the distribution of F-actin, actin regulatory proteins, and apical ES proteins, leading to defects in spermatid polarity and spermiation. Testes transfected with formin 1-specific siRNA duplexes (Formin 1 siRNA) vs nontargeting negative control duplexes (Ctrl siRNA) were used to obtain frozen sections and stained for formin 1 (green fluorescence), F-actin (green fluorescence), actin barbed-end nucleation protein Arp3 (green fluorescence), actin barbed-end capping and bundling protein Eps8 (red fluorescence), and apical ES proteins nectin 3 (red fluorescence), laminin-γ3 (red fluorescence), and β1-integrin (red fluorescence). Cell nuclei were visualized with DAPI (blue). Because formin 1 was highly expressed at the apical ES, mostly at the concave (ventral) side of spermatid heads, in stage VII tubules, this analysis was performed using VII tubules. After formin 1 knockdown, the expression of formin 1 at the apical ES was considerably diminished, and many spermatids had lost their polarity in which their heads no longer pointed toward the basement membrane but deviated by at least 90° from the intended orientation (annotated by orange arrows). F-actin no longer tightly localized surrounding both the concave (ventral) and convex (dorsal) side of spermatid heads as shown in control testes but limited mostly to the tip of spermatid heads. The defects in F-actin organization at the apical ES is likely the result of mislocalization of Arp3 and Eps8 in these stage VII tubules, which thus contributed to the mislocalization of apical ES adhesion proteins nectin 3 and laminin-γ3 (both of which are spermatid specific proteins) but also Sertoli cell-specific apical ES protein β1-integrin. These defects thus perturbed spermatogenesis as illustrated in Figure 6, such as defects in spermiation in which spermatids were found to be embedded in the seminiferous epithelium in stage VIII and IX tubules due to defects in spermatid adhesion as a result of F-actin microfilament reorganization at the apical ES. Scale bar, 30 μm, which applies to other micrographs. Ctrl, control.

Similar articles

Cited by

References

    1. Franca LR, Auharek SA, Hess RA, Dufour JM, Hinton BT. Blood-tissue barriers: Morphofunctional and immunological aspects of the blood-testis and blood-epididymal barriers. Adv Exp Med Biol. 2012;763:237–259. - PubMed
    1. Pelletier RM. The blood-testis barrier: the junctional permeability, the proteins and the lipids. Prog Histochem Cytochem. 2011;46:49–127. - PubMed
    1. Cheng CY, Mruk DD. The blood-testis barrier and its implication in male contraception. Pharmacol Rev. 2012;64:16–64. - PMC - PubMed
    1. Hess RA, de Franca LR. Spermatogenesis and cycle of the seminiferous epithelium. Adv Exp Med Biol. 2008;636:1–15. - PubMed
    1. de Kretser DM, Kerr JB. The cytology of the testis. In: Knobil E, Neill JB, Ewing LL, Greenwald GS, Markert CL, Pfaff DW, eds. The Physiology of Reproduction. Vol 1 New York: Raven Press; 1988:837–932.

Publication types

MeSH terms