. 2015 Apr 30;520(7549):697-701.
doi: 10.1038/nature14418. Epub 2015 Apr 22.

TP53 loss creates therapeutic vulnerability in colorectal cancer

Affiliations

TP53 loss creates therapeutic vulnerability in colorectal cancer

Yunhua Liu et al. Nature. .

Erratum in

Abstract

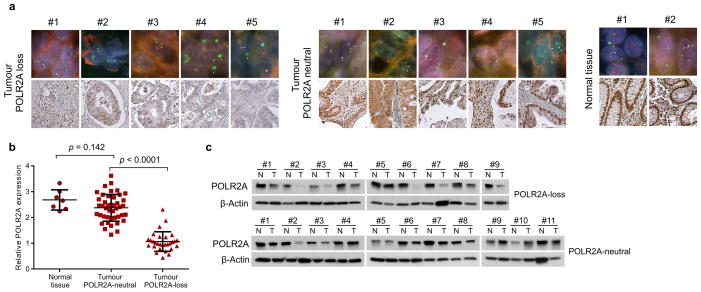
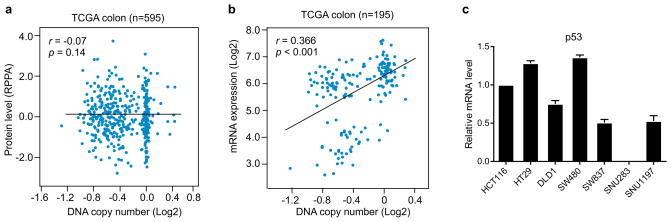
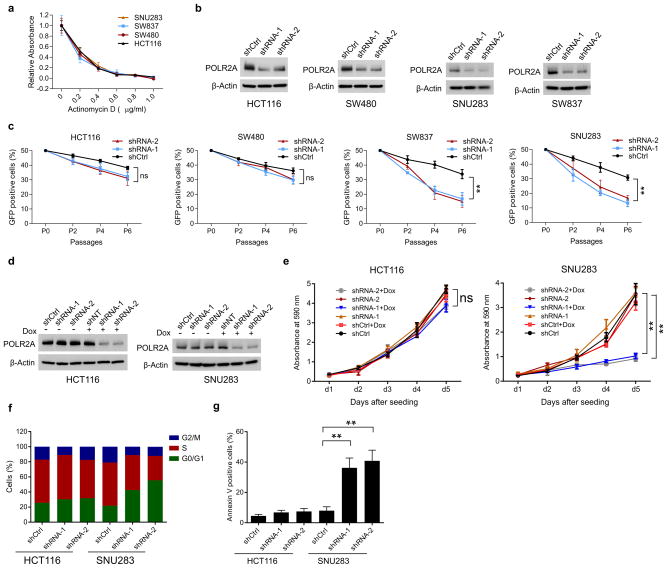
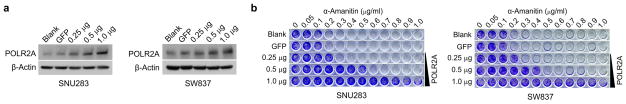
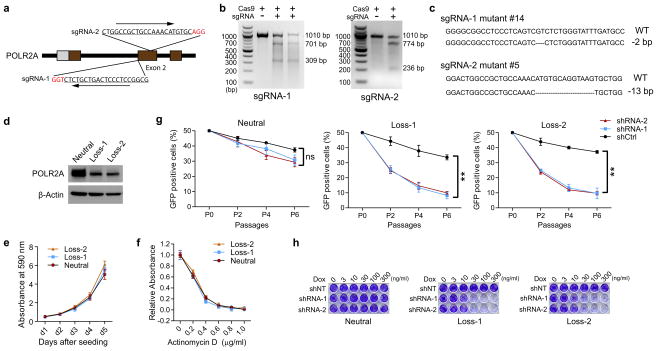
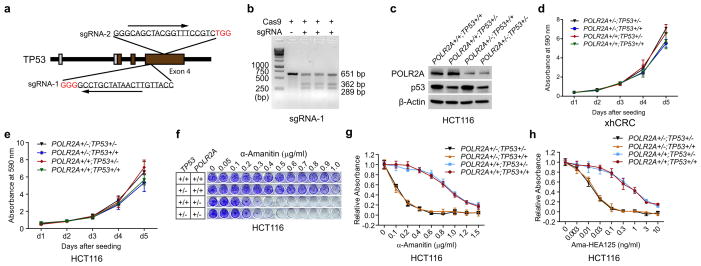
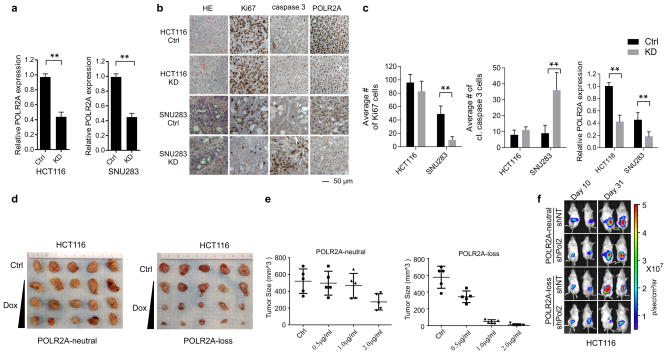
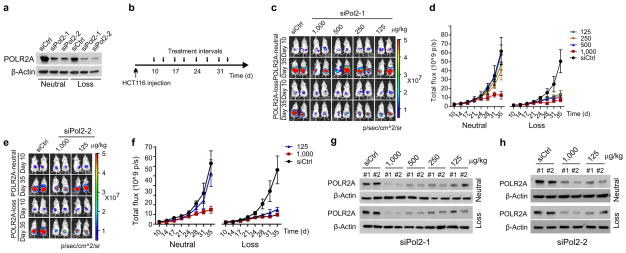
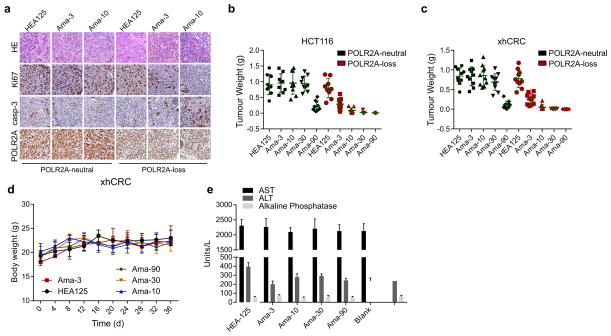
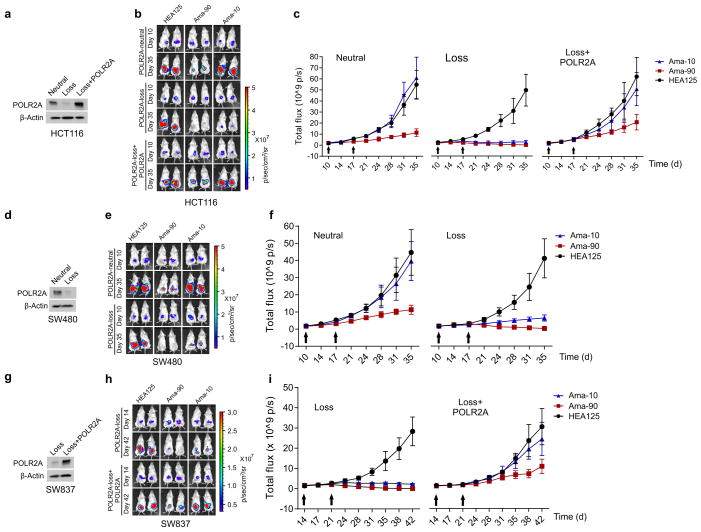
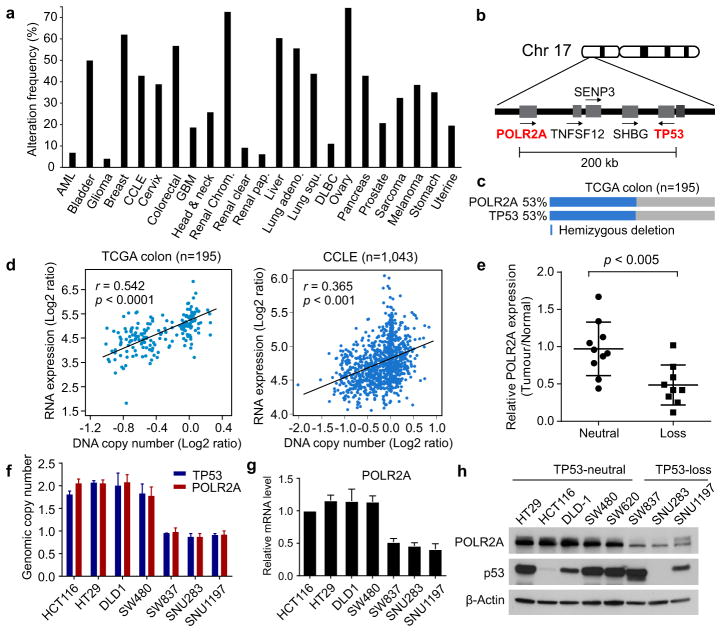
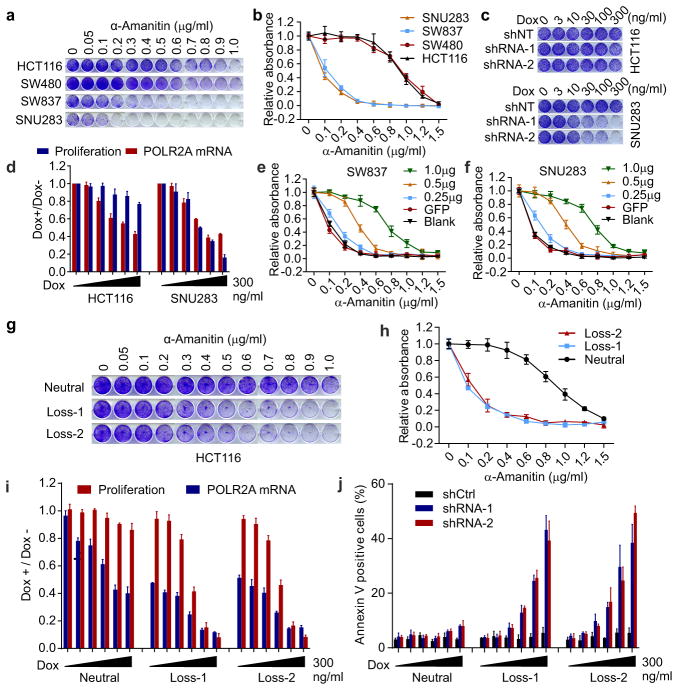
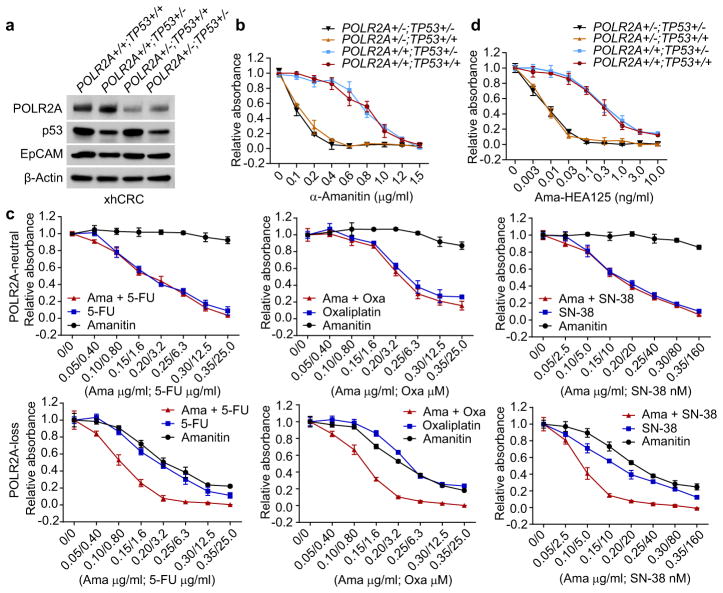
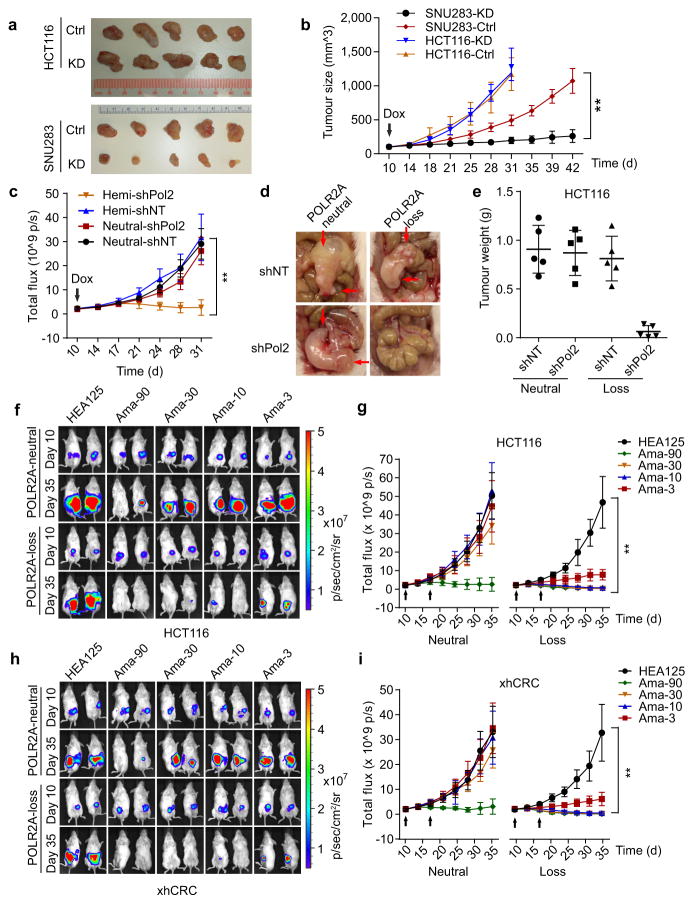
TP53, a well-known tumour suppressor gene that encodes p53, is frequently inactivated by mutation or deletion in most human tumours. A tremendous effort has been made to restore p53 activity in cancer therapies. However, no effective p53-based therapy has been successfully translated into clinical cancer treatment owing to the complexity of p53 signalling. Here we demonstrate that genomic deletion of TP53 frequently encompasses essential neighbouring genes, rendering cancer cells with hemizygous TP53 deletion vulnerable to further suppression of such genes. POLR2A is identified as such a gene that is almost always co-deleted with TP53 in human cancers. It encodes the largest and catalytic subunit of the RNA polymerase II complex, which is specifically inhibited by α-amanitin. Our analysis of The Cancer Genome Atlas (TCGA) and Cancer Cell Line Encyclopedia (CCLE) databases reveals that POLR2A expression levels are tightly correlated with its gene copy numbers in human colorectal cancer. Suppression of POLR2A with α-amanitin or small interfering RNAs selectively inhibits the proliferation, survival and tumorigenic potential of colorectal cancer cells with hemizygous TP53 loss in a p53-independent manner. Previous clinical applications of α-amanitin have been limited owing to its liver toxicity. However, we found that α-amanitin-based antibody-drug conjugates are highly effective therapeutic agents with reduced toxicity. Here we show that low doses of α-amanitin-conjugated anti-epithelial cell adhesion molecule (EpCAM) antibody lead to complete tumour regression in mouse models of human colorectal cancer with hemizygous deletion of POLR2A. We anticipate that inhibiting POLR2A will be a new therapeutic approach for human cancers containing such common genomic alterations.


Conflict of interest statement

J. Anderl and A. Pahl are employees of Heidelberg Pharma GmbH. The other authors declare no conflict of interest.

Figures

Extended Data Figure 1
Extended Data Figure 1. Expression of POLR2A correlates with its gene copy number in human colon tumours
a, Upper row: double-colour FISH analysis using a probe for chromosome 17 centromere (green) and locus-specific probe for POLR2A (red) on human colon tissue microarray. Bottom row: Immunohistochemical staining of POLR2A in the corresponding tissue samples. Hemizygous loss of the POLR2A gene was determined and the results are shown in Supplementary Table 2. b, Quantification of POLR2A expression in human colon normal (n = 7), POLR2A-neutral (n = 43)or -loss (n = 29) tumour tissue samples. Error bars, s.d. c, Protein levels of POLR2A and β-Actin in matched normal and CRC tissue samples.
Extended Data Figure 2
Extended Data Figure 2. Expression of TP53 is not associated with its gene copy number
a, b, Scatterplots of TP53 copy number versus protein expression (a) or mRNA expression (b) in colorectal tumours in TCGA database. Pearson correlation coefficient (r) and p value are displayed. c, Relative mRNA expression of TP53 in human CRC cell lines (normalized to that in HCT116 cell line). Data are mean and s.d. of three independent experiments.
Extended Data Figure 3
Extended Data Figure 3. POLR2Aloss cells are highly sensitive to POLR2A inhibition
a, Cell proliferation of POLR2Aneutral and POLR2Aloss cells treated with actinomycin D. b, Knockdown efficiency of POLR2A-specific shRNAs in HCT116, SW480, SW837 and SNU283 cells. c, Effect of POLR2A knockdown on the proliferation of four colorectal cancer cell lines. Cells expressing GFP and control or POLR2A-specific shRNAs were sorted and mixed with control GFP-negative cells (1:1) and the GFP positive cells were quantified at passage 2, 4 and 6. **p < 0.01, ns: not significant. d, Protein levels of POLR2A in HCT116 and SNU283 cells expressing Dox-inducible POLR2A shRNAs (1.0 μg ml−1 Dox). e, Cell proliferation of HCT116 and SNU283 cells expressing Dox-inducible POLR2A shRNA in the presence of 300 ng ml−1 Dox. **p < 0.01. f, g, Cell cycle profiles (f) and apoptosis (g) of control or POLR2A shRNA-expressing HCT116 and SNU283 cells. ** p < 0.01. Data are mean and s.d. of three independent experiments in the figure.
Extended Data Figure 4
Extended Data Figure 4. Ectopic expression of POLR2A restores the resistance of POLR2Aloss cells to α-Amanitin treatment
a, Protein levels of POLR2A in SNU283 and SW837 cells expressing increasing amounts of exogenous POLR2A. b, Crystal violet staining of SNU283 and SW837 cells treated with α-Amanitin after transfection with increasing amounts of POLR2A expression vector DNA.
Extended Data Figure 5
Extended Data Figure 5. Mono-allelic knockout of POLR2A sensitizes HCT116 cells to POLR2A inhibition
a, Schematic illustration of the Cas9/sgRNA-targeting sites in the POLR2A gene. Two single-guide RNA(sgRNA)-targeting sequences are shown and the protospacer-adjacent motif (PAM) sequences are highlighted in red. b, Efficiency of the Cas9-mediated cleavage of POLR2A in HCT116 cells measured by the Surveyor assay. c, Sequences of mutant POLR2A alleles in the cell colonies #14 and #5. PAM sequences are highlighted in red. Small deletions in the targeted region led to open reading frame shift, producing only a short stretch of the N-terminal peptide without any functional domains of POLR2A. d, Protein levels of POLR2A in POLR2Aneutral and POLR2Aloss HCT116 cells. e, Growth curves of POLR2Aneutral and POLR2Aloss HCT116 cells. f, Relative proliferation of POLR2Aneutral and POLR2Aloss cells treated with actinomycin D. g, Effect of POLR2A knockdown on the POLR2Aneutral and POLR2Aloss HCT116 cells. Experiments were performed as described in Extended Data Fig. 3c. **p < 0.01, ns: not significant. h, Dox-induced partial suppression of POLR2A inhibited the growth of POLR2Aloss HCT116 cells, but not of parental POLR2Aneutral HCT116 cells. Data are mean and s.d. of three independent experiments in the figure.
Extended Data Figure 6
Extended Data Figure 6. Sensitivity of POLR2Aloss cells to POLR2A inhibition is independent of p53
a, Schematic illustration of the Cas9/sgRNA-targeting sites in the TP53 gene. Two sgRNA-targeting sequences are shown and the PAM sequences are highlighted in red. b, Efficiency of the Cas9-mediated cleavage of TP53 in HCT116 cells measured by Surveyor assay. c, Protein levels of POLR2A and p53 in a panel of isogenic HCT116 cells. d, Growth curves of POLR2Aneutral and POLR2Aloss xhCRC cells. e, Growth curves of POLR2Aneutral and POLR2Aloss HCT116 cells. f, g, Crystal staining images (f) and cell survival curves (g) of POLR2Aneutral and POLR2Aloss HCT116 cells treated with α-Amanitin. h, Cell survival curves of POLR2Aneutral and POLR2Aloss HCT116 cells in response to the treatment of Ama-HEA125. Data are mean and s.d. of three independent experiments in the figure.
Extended Data Figure 7
Extended Data Figure 7. Dose-dependent suppression of POLR2A inhibits tumorigenesis in POLR2Aloss, but not POLR2Aneutral tumours
a, Quantification of POLR2A mRNA expression levels in subcutaneously xenografted HCT116 and SNU283 tumours expressing control or POLR2A shRNA (n = 5 mice per group). ** p < 0.01. Data are mean and s.d. b, Immunohistochemical staining of the aforementioned xenograft tumours. HE: haematoxylin and eosin. c, Cells positive for Ki67 (cell proliferation) or cleaved caspase-3 (apoptosis) per field and POLR2A expression in (b) were quantified. ** p < 0.01. n = 10 fields. Data are mean and s.d. d, Gross tumour images of xenograft tumours derived from subcutaneously implanted POLR2Aneutral and POLR2Aloss HCT116 cells (1 × 10⁶ cells injected). Both cell lines express control or Dox-inducible POLR2A shRNAs. After the initial establishment of tumours (100 mm3), mice were treated with (0.5, 1 and 2 μg ml−1) Dox in drinking water. n = 5 mice per group. e, Quantification of tumour sizes as shown in (d). Data are mean and s.d. f, Representative bioluminescent images of orthotopically implanted HCT116 tumours expressing Dox-inducible control or POLR2A shRNA following Dox treatment.
Extended Data Figure 8
Extended Data Figure 8. Suppression of POLR2A with DOPC-encapsulated POLR2A siRNA inhibits the growth of POLR2Aloss tumours
a, Protein levels of POLR2A following transfection of control siRNA or POLR2A siRNAs (#1 and #2) in HCT116 cells. b, Schematic illustration of orthotopic injection of HCT116 cells (1 × 10⁶ cells) followed by siRNA-DOPC nanoliposome treatment. c–f, Representative bioluminescent images (c, e) and tumour growth curves (d, f) of orthotopic xenograft tumours derived from POLR2Aneutral and POLR2Aloss HCT116 cells that received intraperitoneal injections of control (1,000μg kg−1) or POLR2A siRNAs (125, 250, 500 and 1,000 μg kg−1) twice weekly. n = 10 mice per group. Error bars, s.e.m. (g, h) Representative protein levels of POLR2A in xenograft tumours following control or POLR2A siRNA treatment.
Extended Data Figure 9
Extended Data Figure 9. Suppression of POLR2A selectively inhibits the POLR2Aloss tumour growth
a, Immunohistochemical staining of xenografted xhCRC tumours. HE: haematoxylin and eosin. b, c, Tumour weights of orthotopically implanted HCT116 (b) and xhCRC (c) tumours. n = 10 mice per group. Data are mean and s.d. d, e, Body weights (d) and liver enzymes (e) including alanine aminotransferase (ALT), aspartate aminotransferase (AST) and alkaline phosphatase in peripheral blood. Data are mean and s.d. n = 5 mice.
Extended Data Figure 10
Extended Data Figure 10. Suppression of POLR2A by Ama-HEA125 inhibits the growth of POLR2Aloss tumours
a, d, g Protein levels of POLR2A in HCT116 (a), SW480 (d), or SW837 (g) cells. These cell lines are POLR2A-neutral, POLR2A-loss, or POLR2A-restored. b–c, e–f, h–i, Representative bioluminescent images (b, e, h) and tumour growth curves (c, f, i) of orthotopic xenograft tumours derived from the corresponding cells as indicated. All of them received dual intraperitoneal injections of anti-EpCAM antibody (3.6 mg kg−1) or Ama-HEA125 antibody-drug conjugate (10 and 90 μg kg−1, corresponding to 0.4 and 3.6 mg IgG kg−1). n = 10 mice per group. Error bars, s.e.m.
Figure 1
Figure 1. Expression of POLR2A, but not TP53, is correlated with the gene copy number
a, Frequencies of hemizygous deletion of TP53 in human cancers. b, Schematic diagram of genes adjacent to TP53 in human genome. c, Concomitant deletion of POLR2A in human CRCs harbouring hemizygous loss of TP53. d, Scatterplots of POLR2A copy number versus mRNA expression in TCGA and CCLE databases. Pearson correlation coefficient (r) and p value are displayed. e, POLR2A protein levels in matched normal and CRC tissue samples. Error bars, s.d. f, g, Copy numbers (f) and relative mRNA expression levels (g) of POLR2A in human CRC cell lines. Data are mean and s.d. of three independent experiments. h, Protein levels of POLR2A and p53 in human CRC cell lines.
Figure 2
Figure 2. POLR2Aloss cells are highly sensitive to the POLR2A inhibition
a, b, POLR2Aloss cells (SW837, SNU283) are significantly more sensitive to α-Amanitin treatment than POLR2Aneutral cells (HCT116, SW480). Crystal violet staining of cells (a) and quantification analyses (b) are shown. c, Dox-induced suppression of POLR2A inhibited the proliferation of SNU283 cells, but not of HCT116 cells. d, Correlation between POLR2A mRNA expression and cell proliferation in HCT116 and SNU283 cells expressing Dox-inducible POLR2A shRNA. e, f, Survival curves of SW837 (e) and SNU283 (f) cells treated with α-Amanitin after transfection with increasing amounts of PORL2A expression vector DNA. g, h, POLR2Aloss HCT116 cells are significantly more sensitive to α-Amanitin treatment than the parental POLR2Aneutral cells. Crystal violet staining of cells (g) and quantification analyses (h) are shown. i, j, Correlation between POLR2A mRNA expression and cell proliferation (i) or apoptosis (j) in POLR2Aneutral and POLR2Aloss HCT116 cells. Data are mean and s.d. of three independent experiments in the figure.
Figure 3
Figure 3. The sensitivity of POLR2Aloss cells to POLR2A inhibition is independent of p53
a, Protein levels of POLR2A, p53 and EpCAM in a panel of isogenic human xhCRC cell lines. b, Cell proliferation of isogenic xhCRC cells treated with α-Amanitin. c, Sensitivity of isogenic xhCRC cells to 5-FU, Oxaliplatin (Oxa) or SN-38 treatment combined with or without α-Amanitin. d, Cell proliferation of isogenic xhCRC cells treated with Ama-HEA125. Data are mean and s.d. of three independent experiments in the figure.
Figure 4
Figure 4. Suppression of POLR2A selectively inhibits the POLR2Aloss tumour growth
a, b, Gross tumour images (a) and growth curves (b) of xenograft tumours derived from subcutaneously implanted HCT116 or SNU283 cells expressing control or Dox-inducible POLR2A shRNA. n = 5 mice per group. Error bars, s.e.m. ce, Tumour growth curves (c, **p < 0.01, error bars, s.e.m.), gross tumour images (d) and weights (e, error bars, s.d.) of xenograft tumours derived from orthotopically implanted POLR2Aneutral and POLR2Aloss HCT116 cells expressing Dox-inducible control or POLR2A shRNA. n = 5 mice per group. f–i, Representative bioluminescent images (f, h)and tumour growth curves (g, i)of orthotopic xenograft tumours derived from POLR2Aneutral and POLR2Aloss HCT116 (f, g) or xhCRC cells (h, i) that received dual intraperitoneal injections of HEA125 antibody or Ama-HEA125 antibody-drug conjugate (3, 10, 30 and 90 μg kg−1). n = 10 mice per group. Error bars, s.e.m.

Comment in

References

    1. Petitjean A, et al. Impact of mutant p53 functional properties on TP53 mutation patterns and tumor phenotype: lessons from recent developments in the IARC TP53 database. Hum Mutat. 2007;28(6):622–629. - PubMed
    1. Vazquez A, et al. The genetics of the p53 pathway, apoptosis and cancer therapy. Nat Rev Drug Discov. 2008;7(12):979–987. - PubMed
    1. Cheok CF, et al. Translating p53 into the clinic. Nat Rev Clin Oncol. 2011;8(1):25–37. - PubMed
    1. Lane DP, Cheok CF, Lain S. p53-based cancer therapy. Cold Spring Harb Perspect Biol. 2010;2(9):a001222. - PMC - PubMed
    1. Chene P. Inhibiting the p53-MDM2 interaction: an important target for cancer therapy. Nat Rev Cancer. 2003;3(2):102–109. - PubMed

Publication types

MeSH terms