

doi: 10.1115/1.4030408.
Epub 2015 Jun 9.
Development and Validation of a Musculoskeletal Model of the Fully Articulated Thoracolumbar Spine and Rib Cage
- PMID: 25901907
- PMCID: PMC5101035
- DOI: 10.1115/1.4030408
Item in Clipboard
Development and Validation of a Musculoskeletal Model of the Fully Articulated Thoracolumbar Spine and Rib Cage
J Biomech Eng.
2015 Aug.
Abstract
We developed and validated a fully articulated model of the thoracolumbar spine in opensim that includes the individual vertebrae, ribs, and sternum. To ensure trunk muscles in the model accurately represent muscles in vivo, we used a novel approach to adjust muscle cross-sectional area (CSA) and position using computed tomography (CT) scans of the trunk sampled from a community-based cohort. Model predictions of vertebral compressive loading and trunk muscle tension were highly correlated to previous in vivo measures of intradiscal pressure (IDP), vertebral loading from telemeterized implants and trunk muscle myoelectric activity recorded by electromyography (EMG).
Figures

(a) Image of the new musculoskeletal spine model shown with and without muscles. (b) The model can simulate sagittally symmetric and asymmetric activities. Here, the model is simulating 30 deg trunk flexion and 20 deg trunk lateral bending to the right.

Method for calculating muscle group CSA and moment arm in the model at different transverse planes, facilitating comparisons to muscle group CSA and moment arm made on axial CT images. The example above shows the calculation of trapezius CSA and moment arm at the T9 midvertebral plane in the model (a), which we would like to compare to measurements of trapezius CSA and moment arm made on axial CT at the T9 midplane (b). The four trapezius fascicles in the model that cross the T9 midplane are schematically shown in (c), where they are plotted relative to the T9 vertebral body centroid. The size of the circles is equal to the CSA of the individual fascicles, and these areas are summed to get trapezius CSA at T9. The centroid of the fascicles is then calculated and used to find the ML and AP moment arms of the muscle group relative to the vertebral centroid.
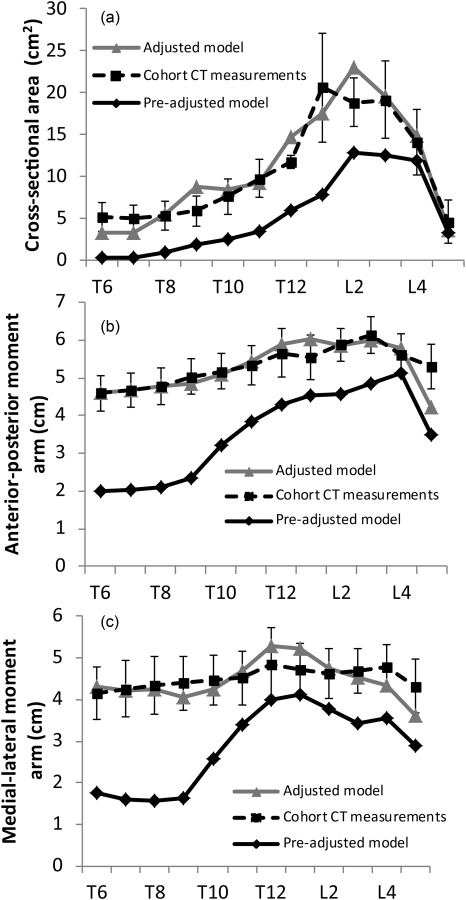
Muscle anatomy for the baseline model (pre-adjusted model) was derived from prior cadaver studies and anatomical descriptions. We generated a new model with muscle group CSA and position scaled to match average in vivo values of muscle CSA and position that were measured on CT scans in a sample of older males (cohort CT measurements) at the vertebral midslices of T6–L5 for several major muscle groups. (a)–(c) The improvement in CSA, AP moment arm, and ML moment arm for the erector spinae muscle group in the adjusted versus pre-adjusted model. The error bars are ±1 standard deviations of the measured data.

The model was used to simulate activities for which IDP measurements have been previously reported. Vertebral compressive force predicted by the model was converted to an estimated IDP using vertebral area and a correction factor of 0.66. IDP estimated by the model was correlated with IDP measurements made in the lumbar (a) and thoracic spine (b). The error bars in (b) are the range of IDP reported by Polga et al. [46]. The dashed lines represent unity.

The model was used to simulate the activities reported in Rohlmann et al. [51], for which vertebral loading at L1 was recorded from telemeterized vertebral implants in two individuals. (a) Vertebral loading is expressed as a percentage of standing load. Error bars are the range of data reported in the study. (b) The correlation between measured and model predicted loading is shown.

The model was used to simulate a range of activities for which trunk muscle myoelectric activity has been previously reported by (a) Takahashi et al. at L3 [49], (b) Schultz et al. at L1–L5 [48], and (c) Andersson et al. at T4 [45]. Measured myoelectric activity was correlated with the sum of erector spinae fascicle tensions predicted by the model at the spine levels measured.
References
-
- Delp, S. L. , Anderson, F. C. , Arnold, A. S. , Loan, P. , Habib, A. , John, C. T. , Guendelman, E. , and Thelen, D. G. , 2007, “OpenSim: Open-Source Software to Create and Analyze Dynamic Simulations of Movement,” IEEE Trans. Biomed. Eng., 54(11), pp. 1940–1950. 10.1109/TBME.2007.901024 - DOI - PubMed
Publication types
MeSH terms
Grants and funding
LinkOut - more resources
Full Text Sources
Other Literature Sources
