. 2015 Apr 22;10(4):e0122621.
doi: 10.1371/journal.pone.0122621. eCollection 2015.

Characterization of the Ubiquitin-Conjugating Enzyme Gene Family in Rice and Evaluation of Expression Profiles under Abiotic Stresses and Hormone Treatments

Affiliations

Characterization of the Ubiquitin-Conjugating Enzyme Gene Family in Rice and Evaluation of Expression Profiles under Abiotic Stresses and Hormone Treatments

Zhiguo E et al. PLoS One. .

Abstract

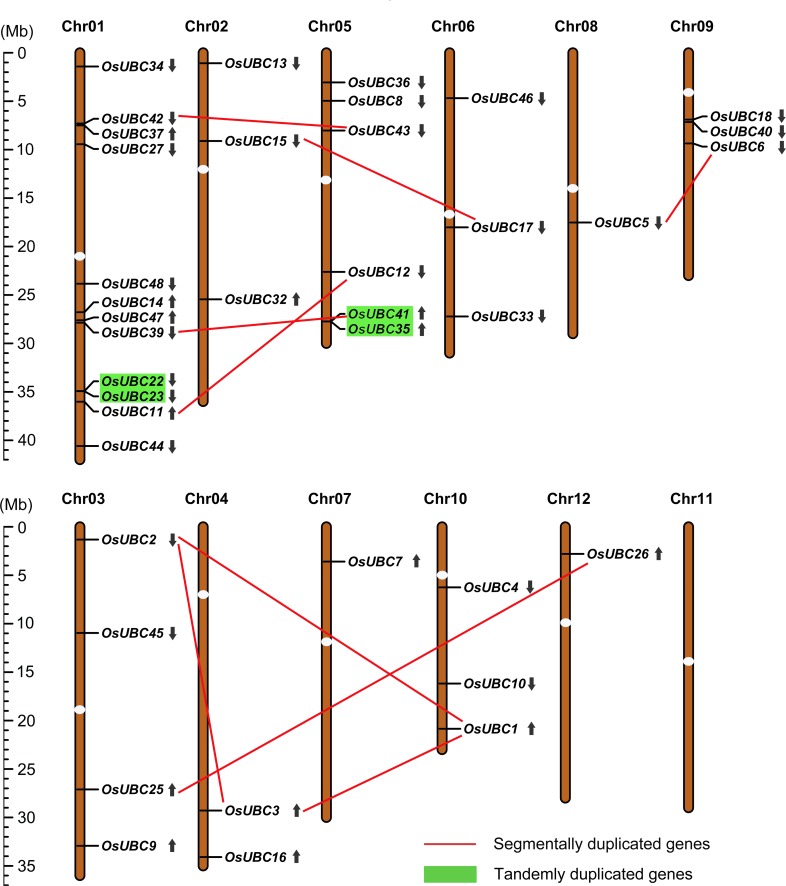
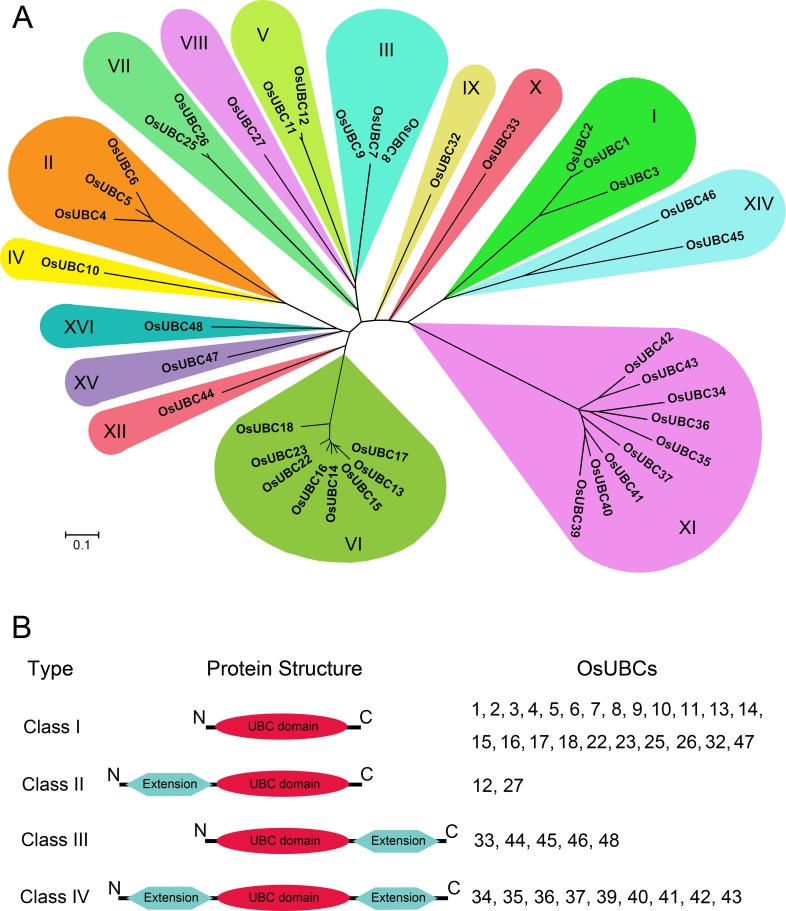
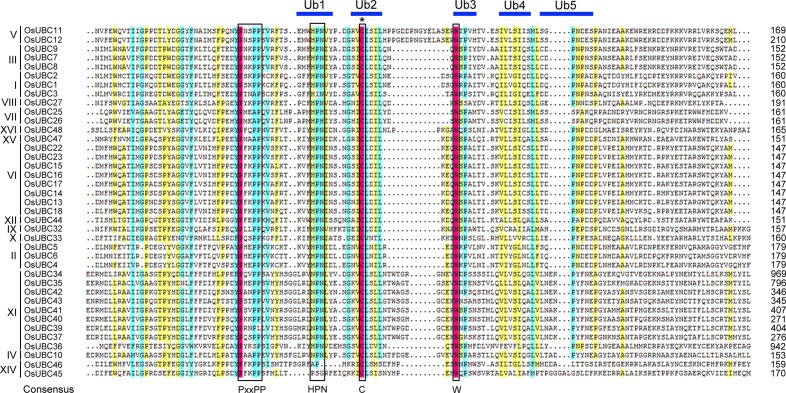
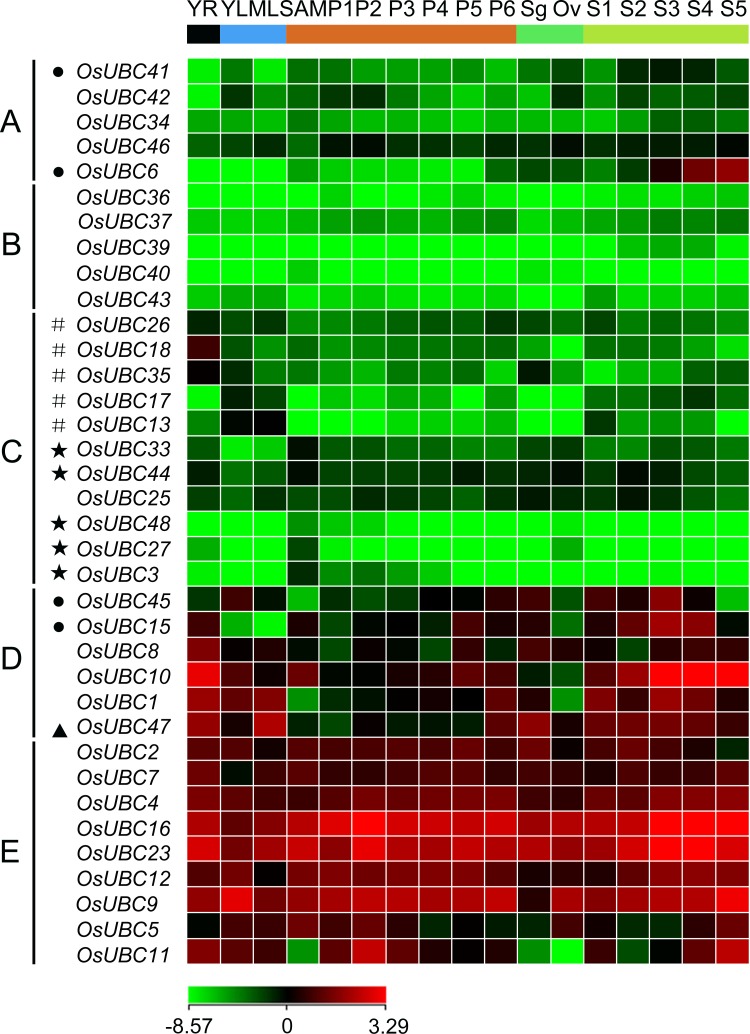
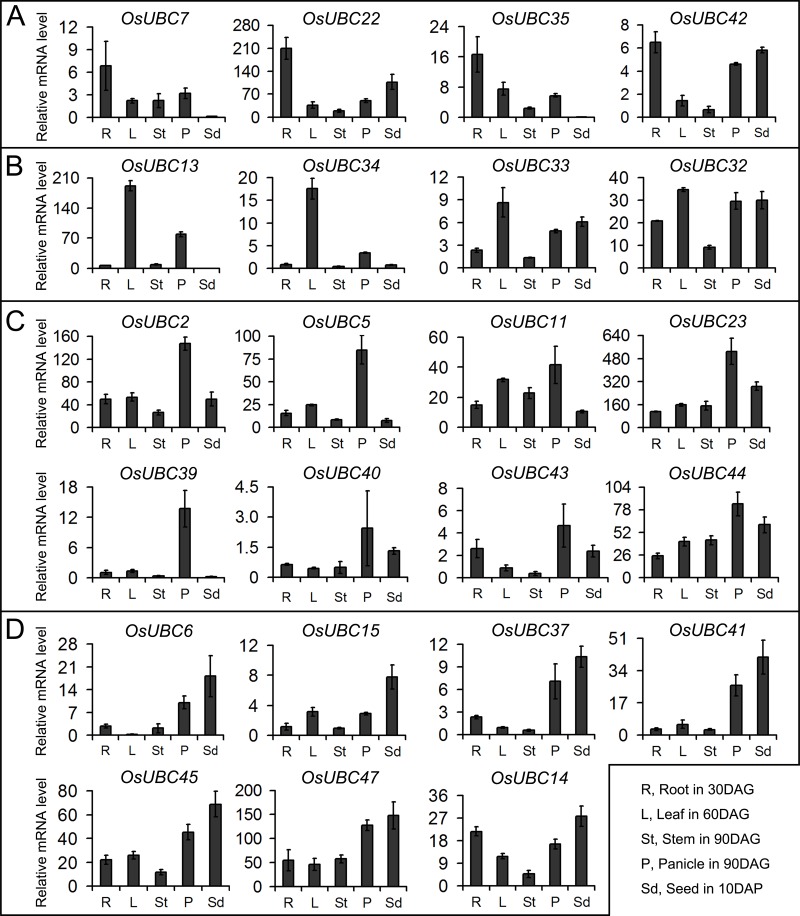
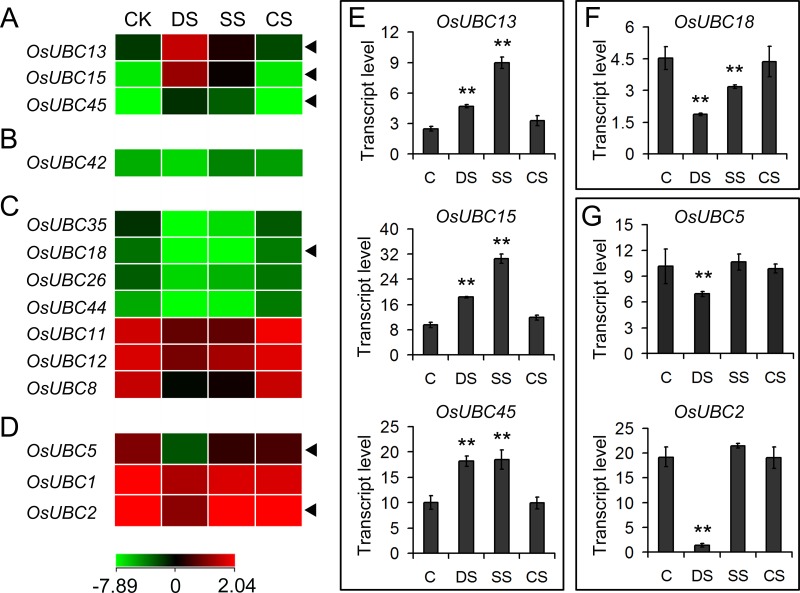
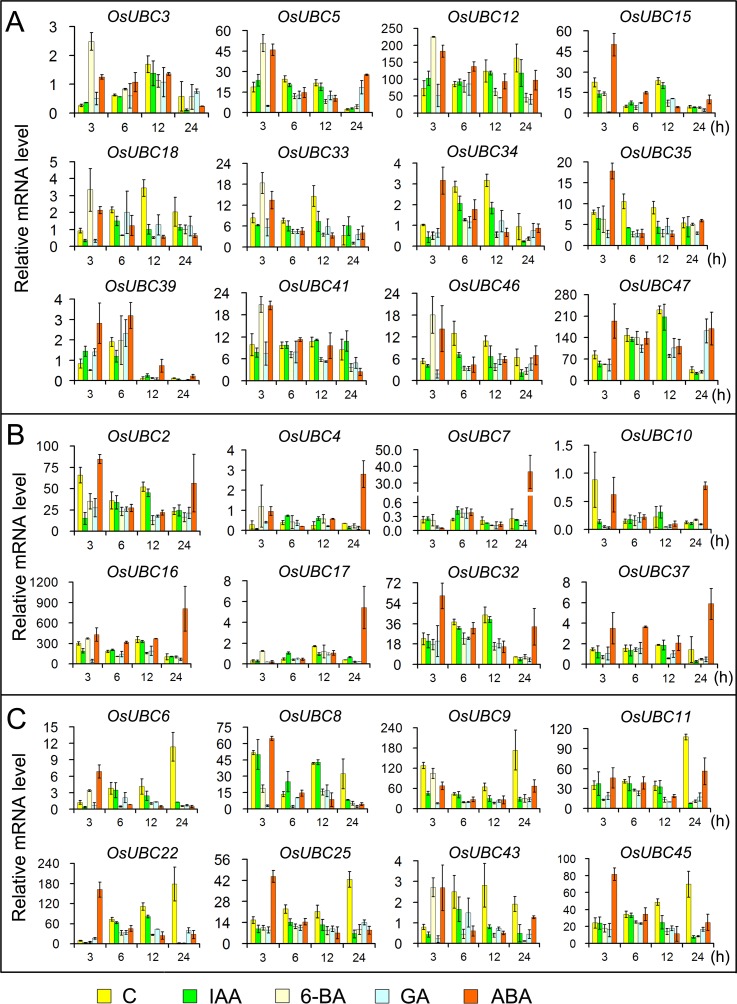
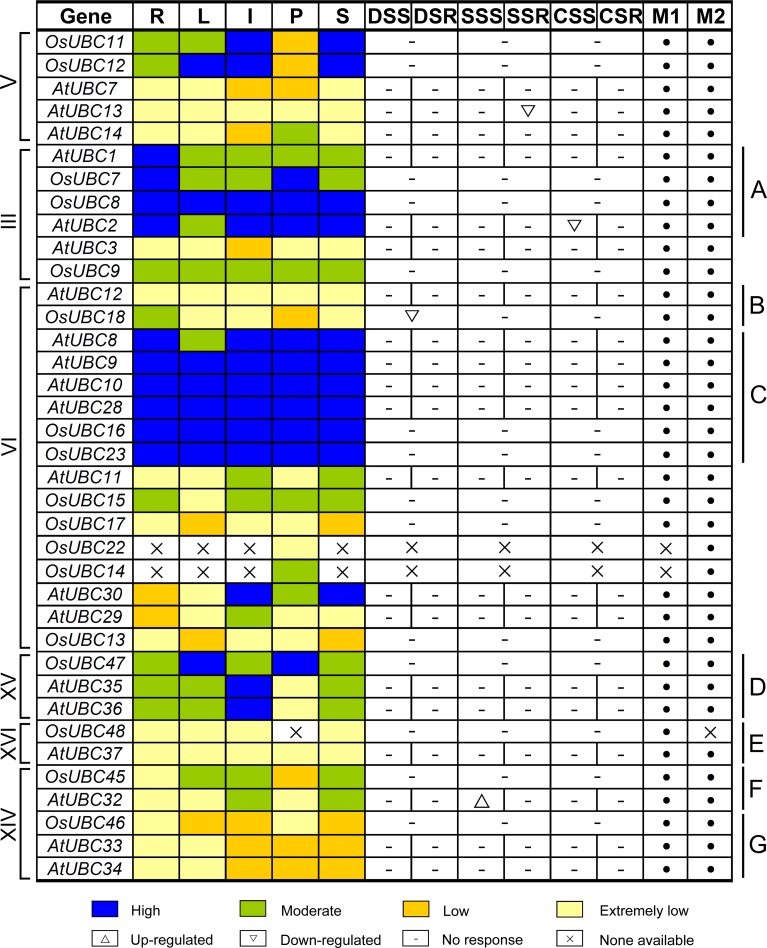
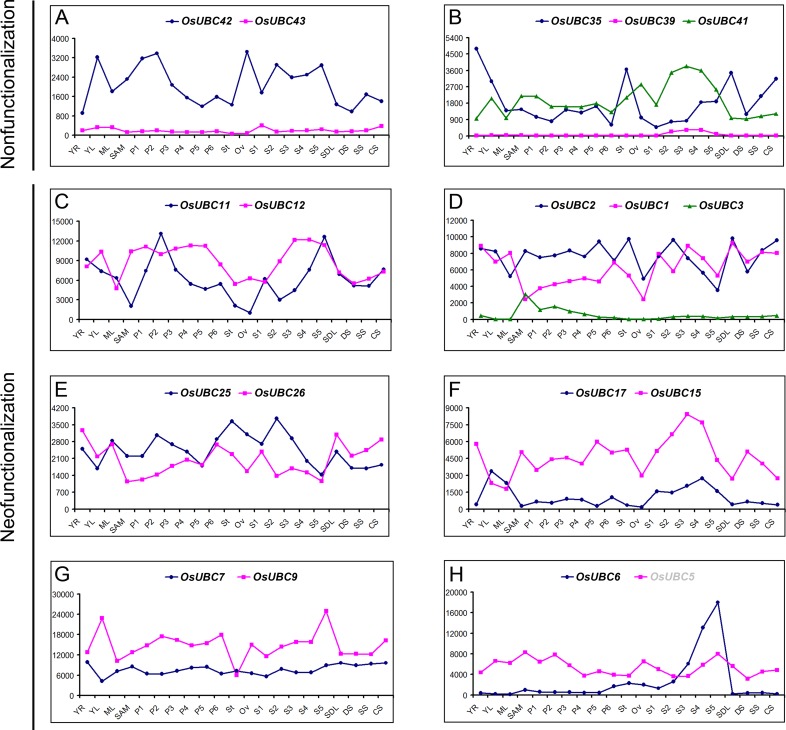
Ubiquitin-conjugating enzyme E2s (UBCs), which catalyze the transfer of ubiquitin to substrate or E3 ligases, are key enzymes in ubiquitination modifications of target proteins. However, little is known about the knowledge of UBC gene family in rice. In this study, a total of 39 UBC encoding genes, which all contained an UBC domain with a cysteine active site, were identified in the rice genome. These were classified into fifteen distinct subfamilies based upon their sequence similarity and phylogenetic relationships. A subset of 19 OsUBC genes exhibited chromosomal duplication; 4 and 15 OsUBC genes were tandemly and segmentally duplicated, respectively. Comprehensive analyses were performed to investigate the expression profiles of OsUBC genes in various stages of vegetative and reproductive development using data from EST, Microarrays, MPSS, and real-time PCR. Many OsUBC genes exhibited abundant and tissue-specific expression patterns. Moreover, 14 OsUBCs were found to be differentially expressed under treatments with drought, or salt stresses. The expression analysis after treatments with IAA, 6-BA, GA and ABA indicated that almost all OsUBC genes were responsive to at least two of the four hormones. Several genes were significantly down-regulated under all of the hormone treatments, and most of the genes reduced by 6-BA were also reduced by GA. This study will facilitate further studies of the OsUBC gene family and provide useful clues for functional validation of OsUBCs in rice.


Conflict of interest statement

Competing Interests: Co-author Heming Zhao is employed by Life Science and Technology Center, China National Seed Group Co., Ltd. There are no patents, products in development or marketed products to declare. This does not alter the authors' adherence to all the PLOS ONE policies on sharing data and materials.

Figures

Fig 1
Fig 1. Chromosomal localization and gene duplication events of OsUBC genes.
Respective chromosome numbers are indicated at the top of each bar. The scale on the left is in megabases (Mb). The white ellipses on the chromosomes (vertical bars) indicate the position of centromeres. The chromosome order is arranged to bring duplicated regions in the vicinity. The segmental duplication genes are connected by straight line in color. The tandemly duplicated genes are shaded with rectangles in light green. The arrows next to gene names show the direction of transcription.
Fig 2
Fig 2. Phylogenetic relationship and protein types of OsUBCs.
Phylogenetic relationship of OsUBCs. Scale bar represents 0.1 amino acid substitution per site. The proteins on the tree can be divided into fifteen distinct subfamilies. The branches of different subfamilies are marked by different colors. (B) Protein types of OsUBCs. The numbers mean proteins encoded by corresponding OsUBCs.
Fig 3
Fig 3. Multiple sequence alignment of UBC domain in OsUBCs.
Identical, conservative and block of similar amino acid residues are shaded in red, light blue and yellow, respectively. The asterisk symbol above the alignment indicates the conserved active-site cysteine of UBCs. The conserved motifs are bordered (black rectangles), including PxxPP motif and HPN tripeptide motif. Ubiquitin thioester intermediate interaction residues are marked by blue lines and shown as Ub1-5.
Fig 4
Fig 4. Expression profiles of OsUBC genes in various organs.
The microarray data sets (GSE6893 and 7951) of OsUBC genes expression in organs at various developmental stages were reanalyzed. A heat map representing hierarchical cluster in various organs was generated. Color key represents average log2 expression values of OsUBC genes. The colour scale (representing average log signal values) is shown at the bottom. Samples are mentioned at the top of each lane: YR, roots from 7-day-old seedlings; ML, mature leaf; YL, leaves from 7-day-old seedling; SAM, shoot apical meristem; different stages of panicle development: P1, 0–3 cm; P2, 3–5 cm; P3, 5–10 cm; P4, 10–15 cm; P5, 15–22 cm; P6, 22–30 cm; Sg, stigma; Ov, ovule; different stages of seed development: S1, 0–2 dap (day after pollination); S2, 3–4 dap; S3, 5–10 dap; S4, 11–20 dap; S5, 21–29 dap. Genes that share similar expression patterns are divided into five groups: (A) preferential expression during seed development; (B) low expression in all examined organs; (C) high expression in specific organs; (D) high expression levels in particular vegetative and reproductive organs; (E) high expression levels in all examined organs. Asterisks, hash symbols, triangles and rounds indicate the genes with preferential expression level in SAM, YR and/or ML/YL, P1–P6 and S1–S5, respectively.
Fig 5
Fig 5. Real-time PCR analysis of tissue-specific expression of the OsUBC genes.
Relative mRNA levels of individual genes normalized to UBQ5 are shown. The genes with preferential expression levels in roots (A), leaves (B), panicles (C) and seeds (D) were showed. Error bars indicate standard deviations of independent biological replicates (n = 2 or more).
Fig 6
Fig 6. Differential expression profiles of OsUBC genes under abiotic stresses.
The microarray data sets (GSE6901) of gene expression under various abiotic stresses were used for cluster display. The average log signal values of OsUBC genes under control and various stress conditions (indicated at the top of each lane) are presented by a heat map. Only those genes that exhibited >2-fold or more differential expression, under any of the given abiotic stress conditions, are shown. (A) Up-regulated by drought and salt stresses; (B) Up-regulated by salt stress; (C) Down-regulated by drought and salt stresses; (D) Down-regulated by drought stress. The color scale representing average log signal values is shown at the bottom. The representative OsUBC genes differentially expressed under different abiotic stresses for which real-time PCR analysis was performed are indicated by black triangle at the right. The results are shown for confirmation of the differential expression of OsUBC genes up-regulated by drought and salt stresses (E), down-regulated by drought and salt stresses (F), and down-regulated by drought stress (G). Error bars indicate standard deviations of independent biological replicates (n = 3 or more). Two asterisks (**, P <0.01) represent significant differences between the controls and treatments. C, control; DS, drought stress; SS, salt stress; CS, cold stress.
Fig 7
Fig 7. Expression analysis of OsUBC genes under different hormone treatments.
X-axis indicates time course/treatment and Y-axes are scales of relative expression level. (A) Showing the genes up-regulated by 6-BA or ABA at 3h; (B) Showing the genes up-regulated by ABA at 24h; (C) Showing the genes down-regulated by the four hormones at 12h and 24h; Error bars indicate standard deviations of independent biological replicates (n = 3 or more). C, control; IAA, indole-3-acetic acid; 6-BA, 6-Benzylaminopurine; GA, gibberellin acid; ABA, abscisic acid; h, hour.
Fig 8
Fig 8. Expression comparison between rice and Arabidopsis UBC genes in different organs and under abiotic stresses.
The OsUBC and AtUBC genes in subfamilies V, III, VI, XV, XVI and XIV are displayed according to the order in the corresponding phylogenetic tree (S2 Fig). The expression data of OsUBC genes in different organs are combined from microarray and MPSS tags represented by M1 and M2, respectively. The expression data in pollens of OsUBC genes were extracted from MPSS tags. The ratios of the absolute values divided by the average of all microarray values were used for analysis (S4 Table). Blue, green, yellow and light yellow boxes indicate high (more than 2 or more than 300 tpm), moderate (between 1 and 2 or between 50 and 300 tpm), low (between 0.5 and 1 or the signature numbers between 0 and 50 tpm), and extremely low (less than 0.5 or no signature is found) expression levels, respectively. R, root; L, leaf; I, inflorescence; P, pollen; S, silique or seed; DSS and DSR; drought stressed shoot and root; SSS and SSR, salt stressed shoot and root; CSS and CSR, cold stressed shoot and root.
Fig 9
Fig 9. Expression divergence of paralogous OsUBC genes involved in duplication.
The absolute values of duplicated genes obtained from microarray data were compared in various organs and under abiotic stresses. (A) and (B) Showing gene pairs described as non-functionalization; (C) to (H) Showing gene pairs described as neo-functionalization.

References

    1. Pickart CM (2001) Mechanisms underlying ubiquitination. Annual Review of Biochemistry 70: 503–533. - PubMed
    1. Smalle J, Vierstra RD (2004) The ubiquitin 26S proteasome proteolytic pathway. Annu. Rev. Plant Biol. 55: 555–590. - PubMed
    1. Vierstra RD (2009) The ubiquitin–26S proteasome system at the nexus of plant biology. Nature Reviews Molecular Cell Biology 10: 385–397. 10.1038/nrm2688 - DOI - PubMed
    1. Vierstra RD (1996) Proteolysis in plants: mechanisms and functions. Plant Mol Biol 32: 275–302. - PubMed
    1. Welchman R, Gordon C, Mayer J (2005) Ubiquitin and ubiquitin-like proteins as multifunctional signals. Nat Rev Mol Cell Biol 6:599–609. - PubMed

Publication types

Substances