. 2015 Apr 22:6:6963.
doi: 10.1038/ncomms7963.

Subdiffractional focusing and guiding of polaritonic rays in a natural hyperbolic material

Affiliations

Subdiffractional focusing and guiding of polaritonic rays in a natural hyperbolic material

S Dai et al. Nat Commun. .

Abstract

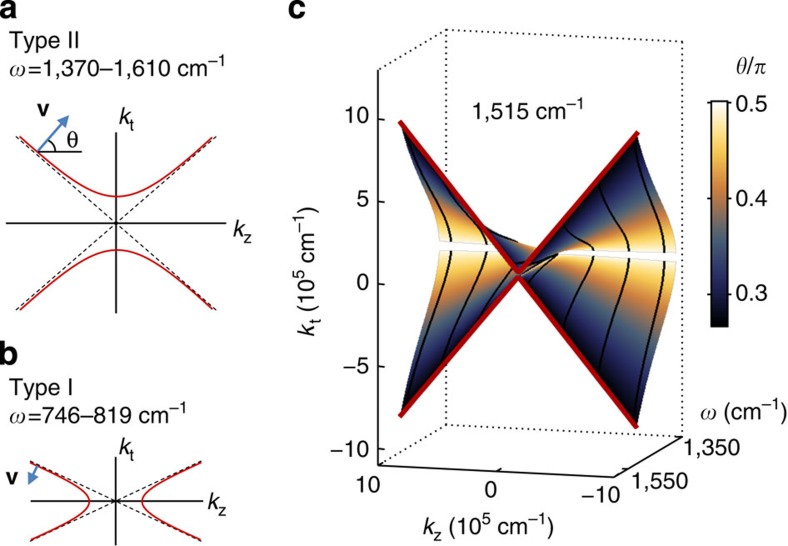
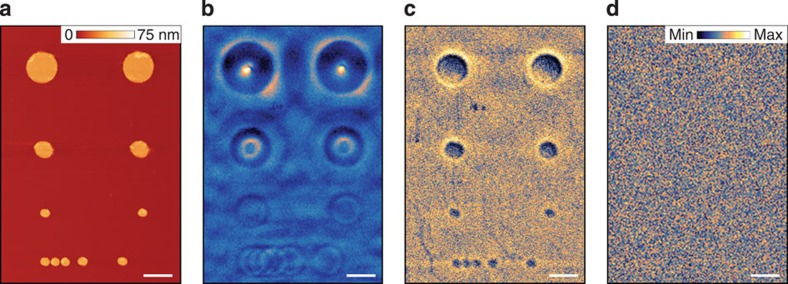
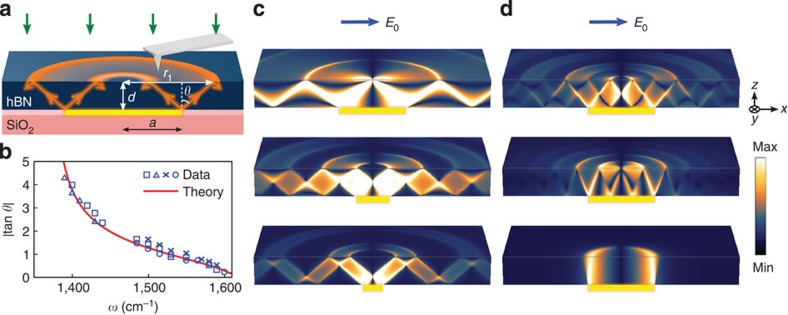
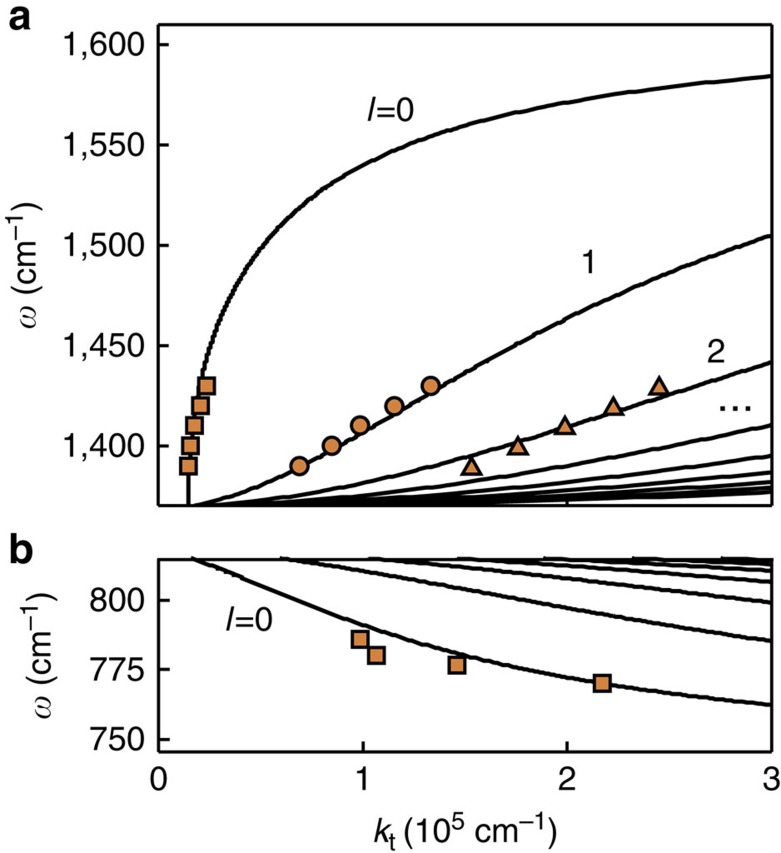
Uniaxial materials whose axial and tangential permittivities have opposite signs are referred to as indefinite or hyperbolic media. In such materials, light propagation is unusual leading to novel and often non-intuitive optical phenomena. Here we report infrared nano-imaging experiments demonstrating that crystals of hexagonal boron nitride, a natural mid-infrared hyperbolic material, can act as a 'hyper-focusing lens' and as a multi-mode waveguide. The lensing is manifested by subdiffractional focusing of phonon-polaritons launched by metallic disks underneath the hexagonal boron nitride crystal. The waveguiding is revealed through the modal analysis of the periodic patterns observed around such launchers and near the sample edges. Our work opens new opportunities for anisotropic layered insulators in infrared nanophotonics complementing and potentially surpassing concurrent artificial hyperbolic materials with lower losses and higher optical localization.


Conflict of interest statement

F.K. is one of the co-founders of Neaspec and Lasnix, producer of the s-SNOM and infrared source used in this work. The remaining authors declare no competing financial interests.

Figures

Figure 1
Figure 1. Hyperbolic dispersion of hBN.
(a) A sketch of the isofrequency curves for a type II HM, which is realized in the upper stop-band of hBN. The arrow indicates the polariton group velocity. (b) A similar sketch for the type I case, which is realized in the hBN lower stop-band. (c) The calculated dispersion surface of hBN polaritons. The axes are the tangential momentum (kt), the axial momentum (kz) and the frequency (ω, ranging from 1,370 to 1,515 cm−1). The colour represents the propagation angle θ. The constant-frequency cut ω=1,515 cm−1 is shown by the red line, to emphasize similarity with a. The dispersion of polaritons in a finite-thickness crystal (d=105 nm) is shown by the black lines to clarify their relation to Fig. 4a.
Figure 2
Figure 2. Sub-diffractional focusing and imaging through an hBN crystal.
(a) An AFM image of Au disks defined lithographically on SiO2/Si substrate before hBN transfer. (b) Near-field amplitude image of the top surface of a 395-nm-thick hBN at infrared laser frequency ω=1,515 cm−1 (λ=6.6 μm). The observed ‘hot rings' are concentric with the Au discs. (c) Near-field image of the same sample as in b at ω=1,610 cm−1 (λ=6.2 μm) where polaritons propagate almost vertically. (d) Near-field image of the same sample at ω=1,740 cm−1 (λ=5.7 μm) showing complete homogeneity and lack of any distinct features. The colour scales for bd are indicated in d. The scale bars in all panels are 1 μm long.
Figure 3
Figure 3. Image formation.
(a) Imaging schematics. Under infrared illumination (green arrow), the polaritons were launched by the Au disk edges and propagate towards the hBN top surface where the near-field images were recorded via the back-scattered infrared beam (green arrow). The propagation angle θ can be inferred from the hot ring radius r1, hBN thickness d and disk radius a. (b) The tangent of the propagation angle θ derived from imaging data for different hBN samples (symbols) and from Equation (2) (solid line). Squares, triangles, crosses and dots indicate data from hBN samples with thickness d=395, 984, 270 and 1,060 nm, respectively. (c) The distribution of the z-component of the electric field in the analytical model (see text). The hot rings on the surfaces appear as a result of multiple reflections of polaritons launched at the disk edges. The ratio a/|δ|=0.5, 0.25, 0.15 decreases from top to bottom. In the top picture, the smallest ring shrinks to a focal point. The blue arrow indicates the direction of electric field E0 in simulation. (d) Similar to b for a/d=1.12 and (top to bottom) |tan θ|=0.75, 0.375 and 0.01.
Figure 4
Figure 4. Polariton frequency (ω) – in-plane momentum (kt) dispersion relation for hBN.
(a) The dispersion curves from Fig. 1c replotted as frequency (ω) versus in-plane momenta (kt). The experimental data (squares) are obtained from the polariton reflection images near the sample edges (Fig. 5). (b) Same as a for the lower hBN stop-band (Supplementary Fig. 3). Thickness of hBN: 105 nm.
Figure 5
Figure 5. Imaging of polariton waveguide modes near the hBN edges.
(a) Experimental schematic is similar to Fig. 3a except that imaging here is performed near the edge of an unpatterned sample. (b) Near-field amplitude image measured at 1,420 cm−1. The olive square indicates the area whose expanded view is shown in ce). (ce) Near-field image of the area marked in b at several frequencies. hBN thickness in be: 31 nm. (f) Near-field image of 105-nm-thick hBN at 1,400 cm−1. The cyan dashed lines in bf indicate the hBN edges. Scale bar in bf, 300 nm. (g) Line traces perpendicular to the hBN edge. Trace α was extracted from the image in f. Traces β, γ and ζ were obtained from the Fourier analysis of the trace α as described in the text. (h) The Fourier transform of trace α in g.

References

    1. Pendry J. B. Negative refraction makes a perfect lens. Phys. Rev. Lett. 85, 3966–3969 (2000). - PubMed
    1. Fang N., Lee H., Sun C. & Zhang X. Sub-diffraction-limited optical imaging with a silver superlens. Science 308, 534–537 (2005). - PubMed
    1. Taubner T., Korobkin D., Urzhumov Y., Shvets G. & Hillenbrand R. Near-field microscopy through a SiC superlens. Science 313, 1595 (2006). - PubMed
    1. Zhang X. & Liu Z. Superlenses to overcome the diffraction limit. Nat. Mater. 7, 435–441 (2008). - PubMed
    1. Smolyaninov I. I., Hung Y. J. & Davis C. C. Magnifying superlens in the visible frequency range. Science 315, 1699–1701 (2007). - PubMed

Publication types