. 2015 Apr 21;108(8):1856-69.
doi: 10.1016/j.bpj.2015.03.009.

Myosin II Activity Softens Cells in Suspension

Affiliations

Myosin II Activity Softens Cells in Suspension

Chii J Chan et al. Biophys J. .

Abstract

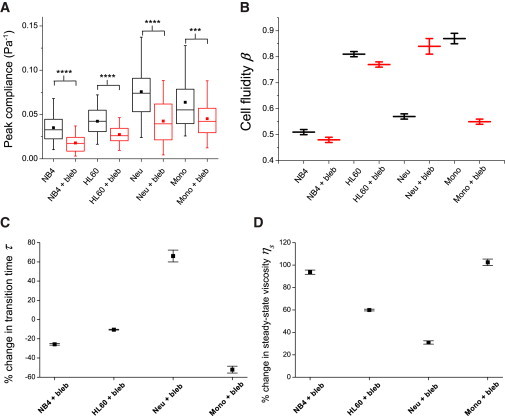
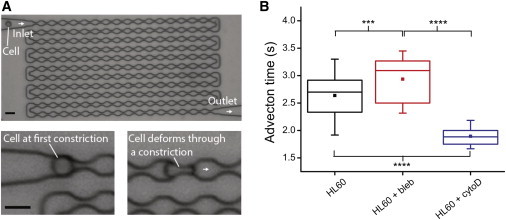
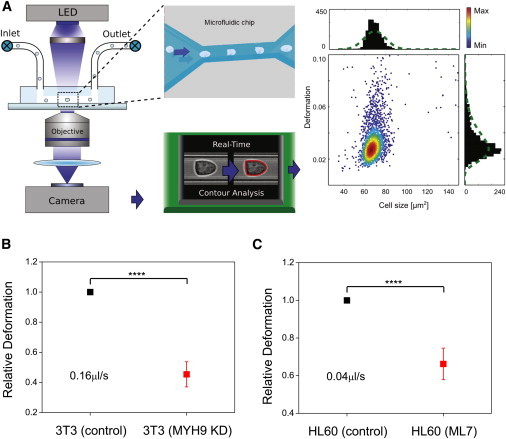
The cellular cytoskeleton is crucial for many cellular functions such as cell motility and wound healing, as well as other processes that require shape change or force generation. Actin is one cytoskeleton component that regulates cell mechanics. Important properties driving this regulation include the amount of actin, its level of cross-linking, and its coordination with the activity of specific molecular motors like myosin. While studies investigating the contribution of myosin activity to cell mechanics have been performed on cells attached to a substrate, we investigated mechanical properties of cells in suspension. To do this, we used multiple probes for cell mechanics including a microfluidic optical stretcher, a microfluidic microcirculation mimetic, and real-time deformability cytometry. We found that nonadherent blood cells, cells arrested in mitosis, and naturally adherent cells brought into suspension, stiffen and become more solidlike upon myosin inhibition across multiple timescales (milliseconds to minutes). Our results hold across several pharmacological and genetic perturbations targeting myosin. Our findings suggest that myosin II activity contributes to increased whole-cell compliance and fluidity. This finding is contrary to what has been reported for cells attached to a substrate, which stiffen via active myosin driven prestress. Our results establish the importance of myosin II as an active component in modulating suspended cell mechanics, with a functional role distinctly different from that for substrate-adhered cells.


Figures

Figure 1
Figure 1
Schematic of an optical stretcher experiment and data analysis. (A) Cells flowing through the microfluidic channel are serially trapped and stretched by two diverging, counterpropagating laser beams emanating from single-mode optical fibers. The momentum transfer of light to the surface of the cell results in (mainly axial) optically induced surface stresses, leading to cellular deformation along the optical axis. (B) Creep compliance curve for a representative HL60 cell stretched at 0.9 Pa. The creep compliance curve can be fitted to a power-law (P) model or a SLL mechanical model. In the power-law model, the creep response follows a power law, with β = 0 for purely elastic materials, unity for a purely viscous fluid, and 0 < β < 1 for viscoelastic materials, such as cells (see inset). The SLL model comprises the transient elastic (Et) and viscous components (ηt), and the steady-state viscous component (ηs). To see this figure in color, go online.
Figure 2
Figure 2
Influence of myosin inhibitors on the compliance of adherent cell lines brought into suspension. (A) Compliance of 3T3 fibroblasts when treated with blebbistatin (n = 89) or Y-27632 (n = 72), compared to controls (n = 65). (B and C) Compliance of blebbistatin-treated HeLa cells (n = 94) and TNGA mouse embryonic stem cells (n = 45) compared to their respective controls (n = 89, 30). (Brown and blue lines) Fits of the power-law model and SLL model to the compliance data, respectively. (D) Box plots of the peak compliance for various cell lines under blebbistatin or Y-27632 treatments. Statistical significance is indicated by asterisks: ∗∗∗∗p < 0.0001. (EG) Cell fluidity, % change in transition times, and % change in steady-state viscosity, respectively, for various cell lines treated with blebbistatin or Y-27632. Error bars are standard errors of the fit parameters. To see this figure in color, go online.
Figure 3
Figure 3
Role of actin cortex in compliance of 3T3 fibroblasts brought into suspension. (A) Compliance curves for 3T3 fibroblasts with RNAi against MYH9 (n = 114), compared to controls (n = 95). (B) Compliance curves for 3T3 fibroblasts after treatment with Jasplakinolide (n = 38), compared to controls (n = 78). (Insets in A and B) Box plots of peak compliance for control versus knockdown or drug treatments. (C) Compliance curves for 3T3 fibroblasts after treatment with cytochalasin D only (n = 45), cytochalasin D plus blebbistatin (n = 38), or with blebbistatin only (n = 80), compared to controls (n = 60). All experiments were performed on cells of the same passage on the same day. (D) Box plots of the peak compliance for cells under various treatments as in (C). ∗∗∗∗p < 0.0001, ∗∗p < 0.01 and p < 0.05. To see this figure in color, go online.
Figure 4
Figure 4
Influence of blebbistatin on the compliance of naturally suspended cells. Compliance of (A) NB4 cells (n = 44), (B) HL60 cells (n = 94), (C) HL60-derived neutrophils (n = 73), and (D) HL60-derived monocytes (n = 72), compared to their respective controls (n = 165, 89, 75, 85). (Brown and blue lines) Fits of the power-law model and SLL model to the compliance data, respectively. To see this figure in color, go online.
Figure 5
Figure 5
Changes in viscoelastic parameters of naturally suspended cells after myosin inhibition by blebbistatin. (A) Box plots of the peak compliance for various cell lines. For all cell lines tested, the peak compliance for blebbistatin-treated cases was significantly lower than for controls. ∗∗∗∗p < 0.0001 and ∗∗∗p < 0.001. (BD) Cell fluidity, % change in transition times, and % change in steady-state viscosity, respectively, for various cell lines treated with blebbistatin compared to their controls. Error bars are standard errors of the fit parameters. To see this figure in color, go online.
Figure 6
Figure 6
Stiffening of blebbistatin-treated HL60 cells in MMM. (A) Phase contrast image of an MMM consisting of a large number of microconstrictions. A constant pressure difference, maintained between the inlet and the outlet, is used to advect cells through the device. The minimum gaps at the constrictions (5 μm) are smaller than the diameter of cells, ensuring that each cell is sequentially deformed during the advection. The driving pressure used was 50 mbar. Scale bar is 15 μm. (B) Box plots of the advection time (from entry to exit) for HL60 cells treated with blebbistatin or cytochalasin D, as compared to controls. ∗∗∗∗p < 0.0001 and ∗∗∗p < 0.001. To see this figure in color, go online.
Figure 7
Figure 7
Hydrodynamic stretching technique measures cell stiffness on short timescales of milliseconds. (A) Schematic illustration of measurement principle. A cell suspension is pumped through a microfluidic chip with a narrow constriction (see inset for top-view) using a computer-controlled syringe pump. The cell deforms inside the channel and imaged, and the contour (red) is determined by image analysis algorithm in real-time. A scatter plot of cell size versus deformation is then obtained (each dot representing a single-cell event). (B and C) Comparisons of the relative deformation of control cells versus 3T3 cells with RNAi against MYH9, and ML7-treated HL60 cells, respectively. The flow rates are indicated in the plots. ∗∗∗∗p < 0.0001. To see this figure in color, go online.

References

    1. Alberts B., Johnson A., Walter P. 4th Ed. Garland Science; New York: 2002. Molecular Biology of the Cell.
    1. Théry M., Bornens M. Cell shape and cell division. Curr. Opin. Cell Biol. 2006;18:648–657. - PubMed
    1. Mogilner A., Keren K. The shape of motile cells. Curr. Biol. 2009;19:R762–R771. - PMC - PubMed
    1. Stewart M.P., Helenius J., Hyman A.A. Hydrostatic pressure and the actomyosin cortex drive mitotic cell rounding. Nature. 2011;469:226–230. - PubMed
    1. Gardel M.L., Shin J.H., Weitz D.A. Elastic behavior of cross-linked and bundled actin networks. Science. 2004;304:1301–1305. - PubMed

Publication types

LinkOut - more resources