. 2015 Apr 21;42(4):665-78.
doi: 10.1016/j.immuni.2015.03.011.

C-Myb(+) erythro-myeloid progenitor-derived fetal monocytes give rise to adult tissue-resident macrophages

Affiliations

C-Myb(+) erythro-myeloid progenitor-derived fetal monocytes give rise to adult tissue-resident macrophages

Guillaume Hoeffel et al. Immunity. .

Abstract

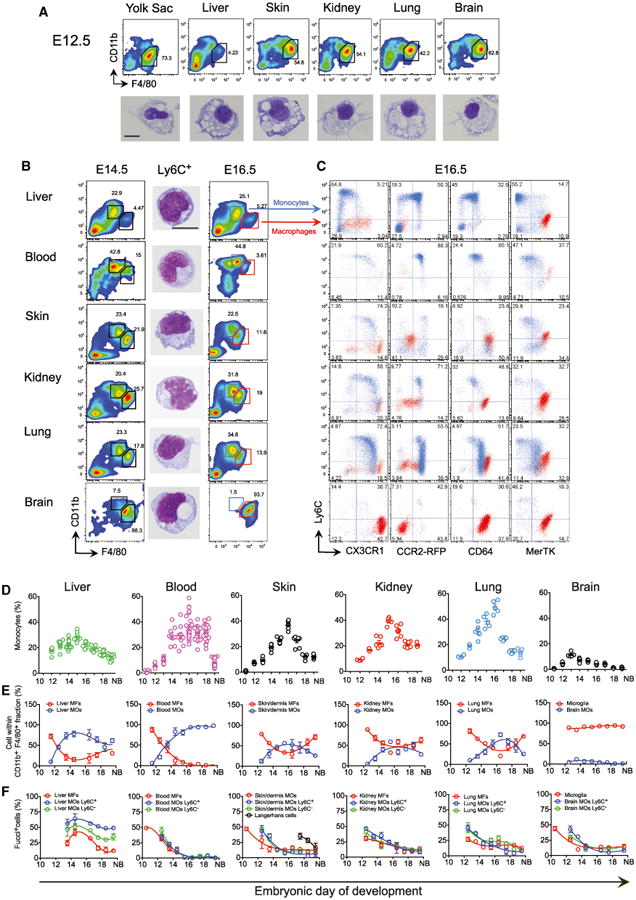
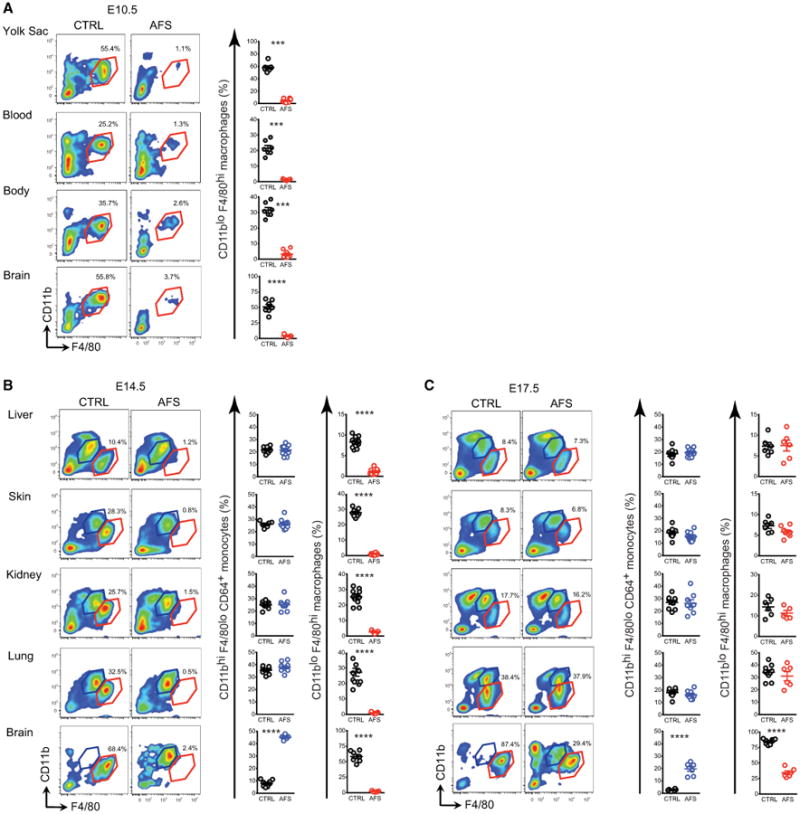
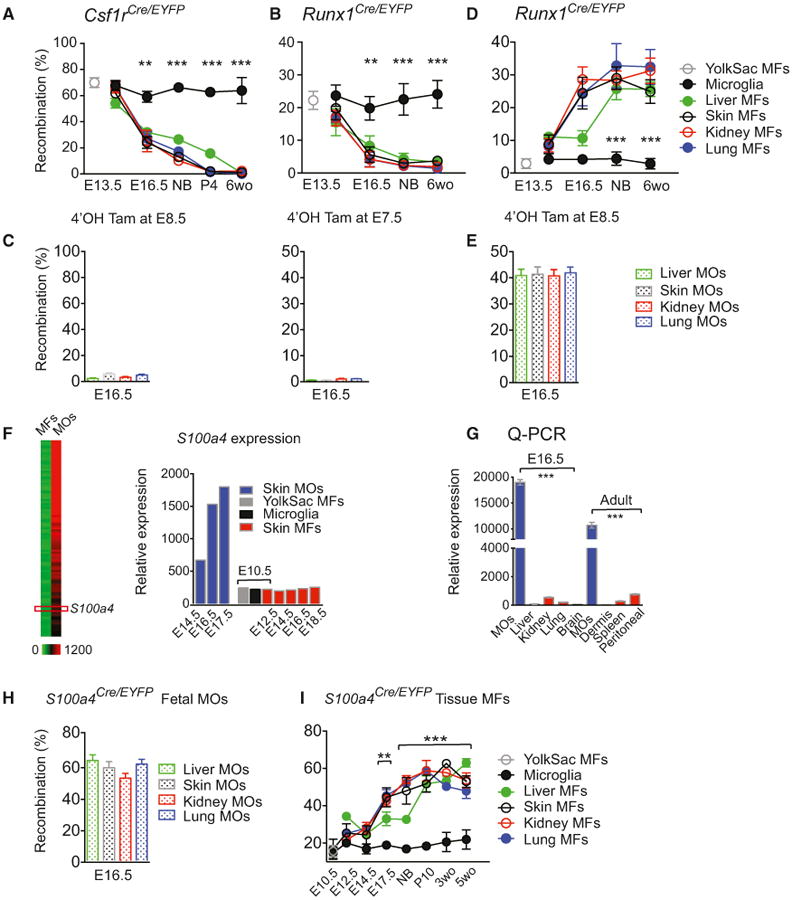
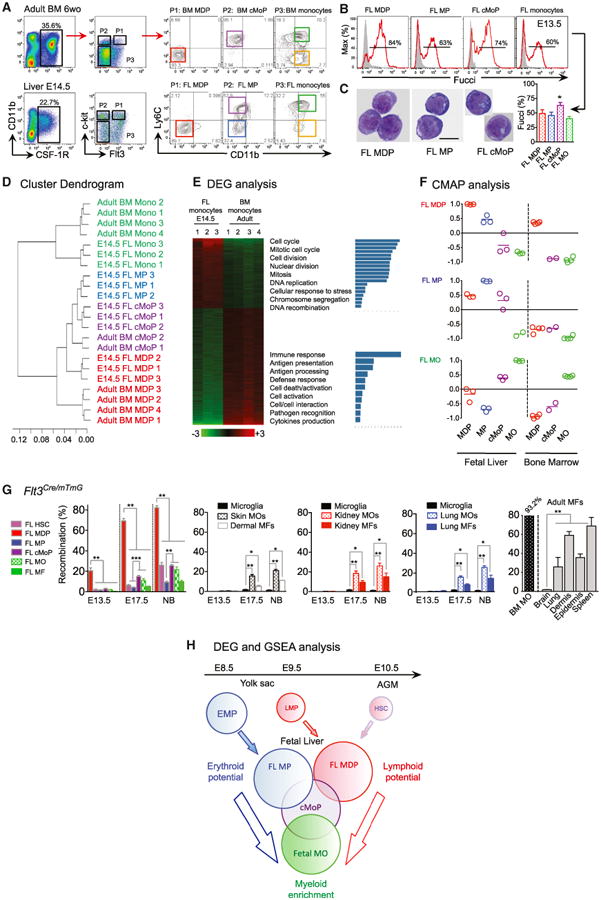
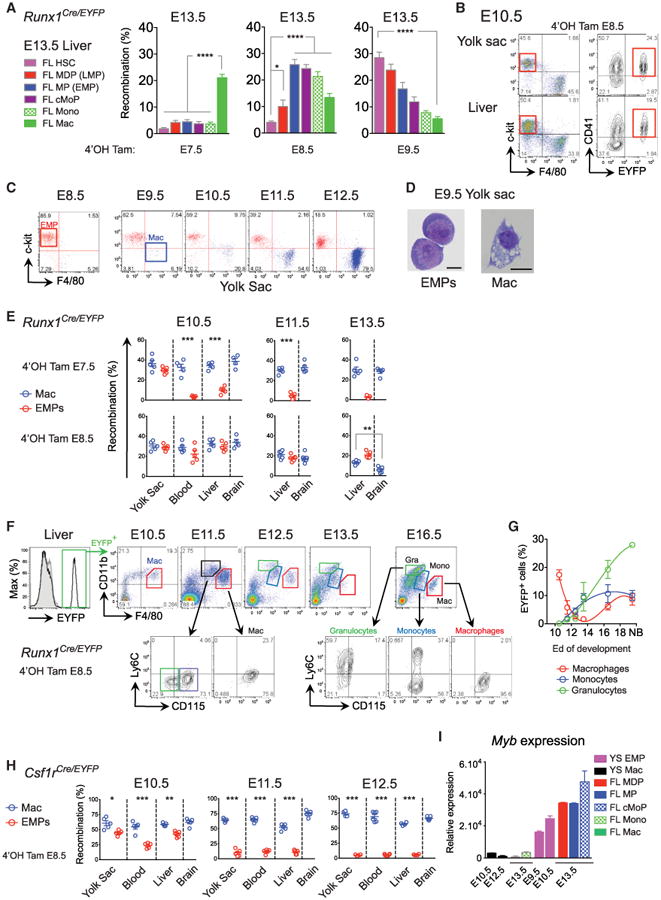
Although classified as hematopoietic cells, tissue-resident macrophages (MFs) arise from embryonic precursors that seed the tissues prior to birth to generate a self-renewing population, which is maintained independently of adult hematopoiesis. Here we reveal the identity of these embryonic precursors using an in utero MF-depletion strategy and fate-mapping of yolk sac (YS) and fetal liver (FL) hematopoiesis. We show that YS MFs are the main precursors of microglia, while most other MFs derive from fetal monocytes (MOs). Both YS MFs and fetal MOs arise from erythro-myeloid progenitors (EMPs) generated in the YS. In the YS, EMPs gave rise to MFs without monocytic intermediates, while EMP seeding the FL upon the establishment of blood circulation acquired c-Myb expression and gave rise to fetal MOs that then seeded embryonic tissues and differentiated into MFs. Thus, adult tissue-resident MFs established from hematopoietic stem cell-independent embryonic precursors arise from two distinct developmental programs.


Figures

Figure 1
Figure 1. Fetal Macrophages Arise Sequentially from YS Macrophages and Fetal Monocytes
(A) Flow cytometry analysis of cells from E12.5 embryonic tissues and GIEMSA staining of purified doubletDAPICD45+CD11bloF4/80hiCD64+Ly6CYS MFs from each tissue. (B) Flow cytometry analysis of cells from E14.5 and E16.5 embryos and GIEMSA staining of purified doubletDAPICD45+CD11bhiF4/80loCD64+Ly6C+ MOs from each E14.5 tissue. (A and B) Scale bar represents 5 μM. (C) Flow cytometry analysis of cells from E16.5 Cx3cr1+/gfp, Ccr2+/rfp, and WT embryos. Overlay of MFs (red population) and fetal MOs (blue population) is depicted (see also Figure S1A for FL analysis). Representative data from five embryos from two litters of each strain are shown. (D) Kinetics of fetal MO tissue infiltration. Percentage of fetal CD11bhiF4/80loCD64+Ly6C+/− MOs within doubletDAPICD45+ cells on alternate days of embryonic development (see also Figure S1B for CCR2−/− data). Each dot represents one embryo (n = 5–12). (E) MFs gated as in (A) and fetal MOs gated as in (B) within total CD11b+F4/80+ cells (n = 5–12). (F) Percentage of proliferative MFs gated as in (A), Ly6C+ and Ly6C MOs gated as in (B) determined in Fucci reporter mice (see Supplemental Information, n = 5–8) (see also Figure S2A for representative plots). Mean ± SEM from three independent litters is presented in (D)–(F).
Figure 2
Figure 2. YS Macrophages Are Not Essential for Fetal Macrophage Development
(A–C) Pregnant females were untreated or injected with AFS98 at E6.5 and cells from embryos were analyzed by flow cytometry at E10.5 (A), E14.5 (B), and E17.5 (C). Percentages of MFs (red) and fetal MOs (blue) gated as in Figure 1 are shown. Each dot represents one embryo. Bars represent mean ± SEM (*p < 0.05; **p < 0.01; ***p < 0.001; ****p < 0.0001). Analysis of n = 5–12 embryos per group from 2–3 independent litters (see also Figure S2B).
Figure 3
Figure 3. YS Macrophages in Embryonic Tissues Are Progressively Replaced by Fetal Monocyte-Derived Macrophages
(A–E) Fate-mapping of YS MFs and fetal MOs from early development into adulthood (6 weeks old). Percentage of recombination in MFs at various time points (A), (B), and (D) or MOs at E16.5 (C) and (E) after a single injection of 4′OHT at E8.5 in Csfr1Cre/WT pregnant mice (A, C, left) (two pooled experiments, n = 5–12 for each time point), or at E7.5 (B, C, right) (three pooled experiments, n = 8–16, for each time point), or E8.5 (D) and (E) (two pooled experiments, n = 5–16 for each time point) in Runx1Cre/WT pregnant mice. (F) Heatmap depicting differentially expressed genes (DEG) in fetal MOs (See Supplemental Information and Figure S3A) and representative histograms of relative S100a4 mRNA expression in MOs and MFs by gene array analysis. (G) S100a4 mRNA expression determined by Q-PCR in MFs and fetal MOs(n = 3, each sample derives from at least eight embryos or five adult mice respectively). (H and I) Percentage of recombination in MOs at E16.5 (two pooled experiments, n = 5–10) (H), and in MFs (two pooled experiments, n = 5–10 for each time point) (I) of S100a4Cre/eyfp embryos and adult mice (see Figures S3B and S3C for controls). Bars represent mean ± SEM (*p < 0.05; **p < 0.01; ***p < 0.001).
Figure 4
Figure 4. Fetal Monocytes Arise from HSC-Independent and -Dependent Pathways
(A) Gating strategy (from doubletDAPI cells) for myeloid progenitor identification in adult BM and E14.5 FL: MDP (Pt, then red gate), MP (P2, then blue gate), cMoP (P2, then purple gate), fetal Ly6C+ MOs (P3, then green gate) and Ly6C MOs (P3, then yellow gate) (see other time point and phenotype in Figures S4A and S4B). (B and C) Proliferative activity analyzed in Fucci-reporter mice (n = 3–6) (B) and morphology visualized by GIEMSA staining of corresponding sorted FL myeloid progenitors (scale bar represents 5 μM; two independent experiments). (D) Unsupervised clustering analysis of E14.5 FL and adult BM myeloid progenitors. (E) Heatmap of DEG between FL and BM MOs with specific gene functionalities annotated. (F) CMAP analysis identifies FL MDP and FL MP as early progenitors, and cMoP as an intermediate, in generating fetal MOs (See also Figures S4C–S4E, Supplemental Information and Table S1). (G) Percentage of recombination in Flt3Cre/mTmG embryos/mice for FL MDP, FL MP, FL cMoP, FL MOs, or FL MFs (left), in MOs and MFs in skin, kidney and lung compared to microglia (middle) and in adult MOs and adult tissue MFs (right). Throughout the figure, bars represent mean ± SEM (n = 3–6, two pooled experiments, *p < 0.05; **p < 0.01; ***p < 0.001). (H) Scheme representing fetal monopoiesis based on GSEA of each FL progenitor DEG combined with CMAP analysis (see also heatmap of FL myeloid progenitors DEG in Figure S4E, Tables S2 and S3 for GSEA details and Figure S4D for myeloid gene heatmap).
Figure 5
Figure 5. c-Myb+ EMPs Colonizes the Fetal Liver and Give Rise to Monocytes
Runx1Cre/eyfp embryos activated either at E7.5, E8.5 or E9.5. Percentage of recombination in FL HSC, MDP, MP, cMoP, MOs, and MFs (two pooled litters, n = 7–13) (A) and in YS CD41+ EMPs (B) (see also Figure S5 for gating strategy, pre-HSC, and EMP analysis). (C) The YS from E8.5 to E12.5 embryos were analyzed by flow cytometry for presence of c-Kit+ progenitors and F4/80+ MF. (D) E9.5 EMPs (doubletDAPICD11bF4/80c-Kit+CD41+) and YS MFs (doubletDAPICD11b+F4/80+) were sorted and visualized by GIEMSA staining. (E) Runx1Cre/eyfp embryos were activated at E7.5 (upper panels) or E8.5 (lower panels). Recombination profile in YS, blood and FL and brain MFs (blue) or EMPs (red) at E10.5, E11.5, and E13.5 are shown (n = 5–6 from two experiments). (F) EYFP+ EMPs from Runx1Cre/eyfp activated at E8.5 and EMP progeny were followed in the FL during development. Primitive MFs (red), fetal MOs (blue), and granulocyte (green) generation is depicted. (G) Quantification of MFs (red), fetal MOs (blue), and granulocytes (green) during development (n = 5–12 embryos from two independent experiments). (H) Csf1rCre/eyfp embryos were activated at E8.5. EYFP recombination at E10.5, E11.5, and E12.5 in YS, blood, FL and brain MFs (blue), or EMPs (red) are shown (n = 5–6 from two experiments). (I) YS EMP, YS MF, FL myeloid progenitors, MOs, and MFs were sorted and c-Myb mRNA expression was measured by Q-PCR. Data are represented as mean ± SEM from triplicate samples where each sample was comprised of at least eight embryos. Throughout the figure, each dot represents one embryo; bars represent mean ± SEM (*p < 0.05; **p < 0.01; ***p < 0.001).

Comment in

  • tEMPting Fate MaYBe the Solution.
    Schneider C, Kopf M. Schneider C, et al. Immunity. 2015 Apr 21;42(4):597-9. doi: 10.1016/j.immuni.2015.04.001. Immunity. 2015. PMID: 25902476

Similar articles

Cited by

References

    1. Bain CC, Bravo-Blas A, Scott CL, Gomez Perdiguero E, Geissmann F, Henri S, Malissen B, Osborne LC, Artis D, Mowat AM. Constant replenishment from circulating monocytes maintains the macrophage pool in the intestine of adult mice. Nat Immunol. 2014;15:929–937. - PMC - PubMed
    1. Bertrand JY, Jalil A, Klaine M, Jung S, Cumano A, Godin I. Three pathways to mature macrophages in the early mouse yolk sac. Blood. 2005;106:3004–3011. - PubMed
    1. Bhowmick NA, Chytil A, Plieth D, Gorska AE, Dumont N, Shappell S, Washington MK, Neilson EG, Moses HL. TGF-beta signaling in fibroblasts modulates the oncogenic potential of adjacent epithelia. Science. 2004;303:848–851. - PubMed
    1. Böiers C, Carrelha J, Lutteropp M, Luc S, Green JC, Azzoni E, Woll PS, Mead AJ, Hultquist A, Swiers G, et al. Lymphomyeloid contribution of an immune-restricted progenitor emerging prior to definitive hematopoietic stem cells. Cell Stem Cell. 2013;13:535–548. - PubMed
    1. Boyer SW, Schroeder AV, Smith-Berdan S, Forsberg EC. All hematopoietic cells develop from hematopoietic stem cells through Flk2/Flt3- positive progenitor cells. Cell Stem Cell. 2011;9:64–73. - PMC - PubMed

Publication types

MeSH terms

Associated data