. 2015 Apr 21;42(4):719-30.
doi: 10.1016/j.immuni.2015.03.015.

A dendritic-cell-stromal axis maintains immune responses in lymph nodes

Affiliations

A dendritic-cell-stromal axis maintains immune responses in lymph nodes

Varsha Kumar et al. Immunity. .

Abstract

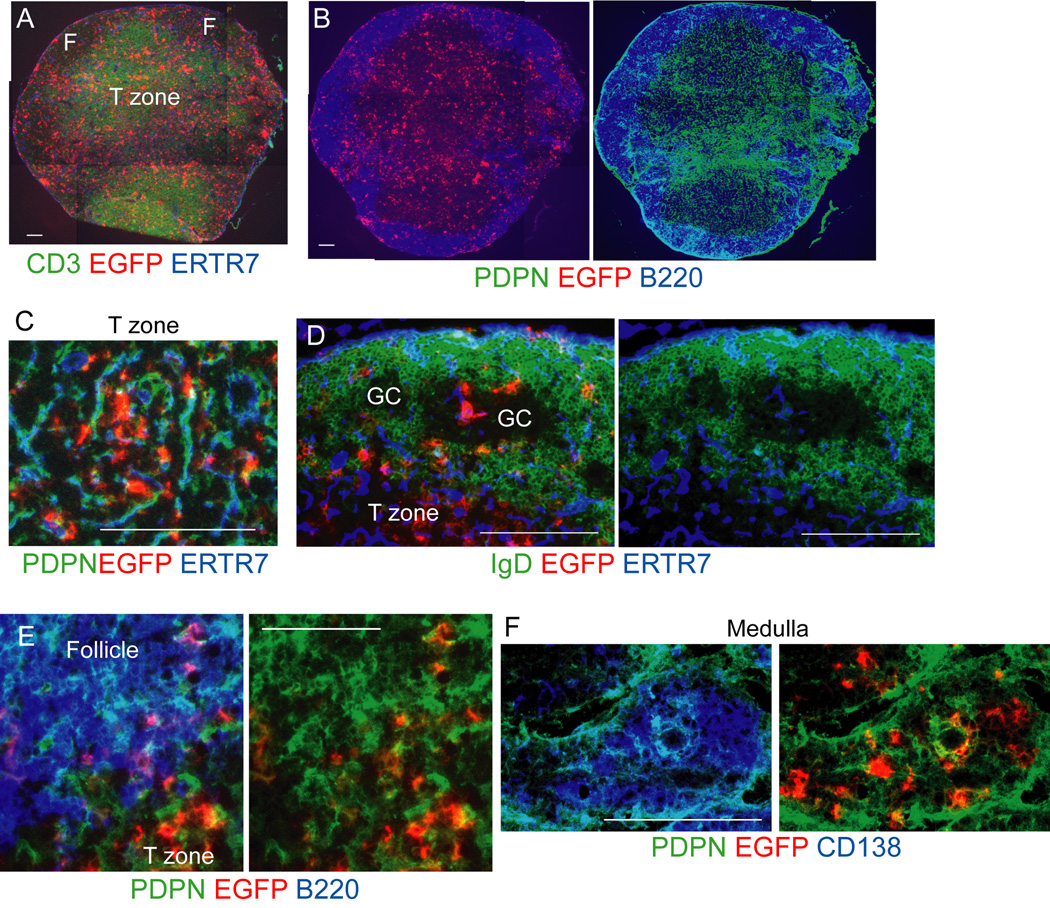
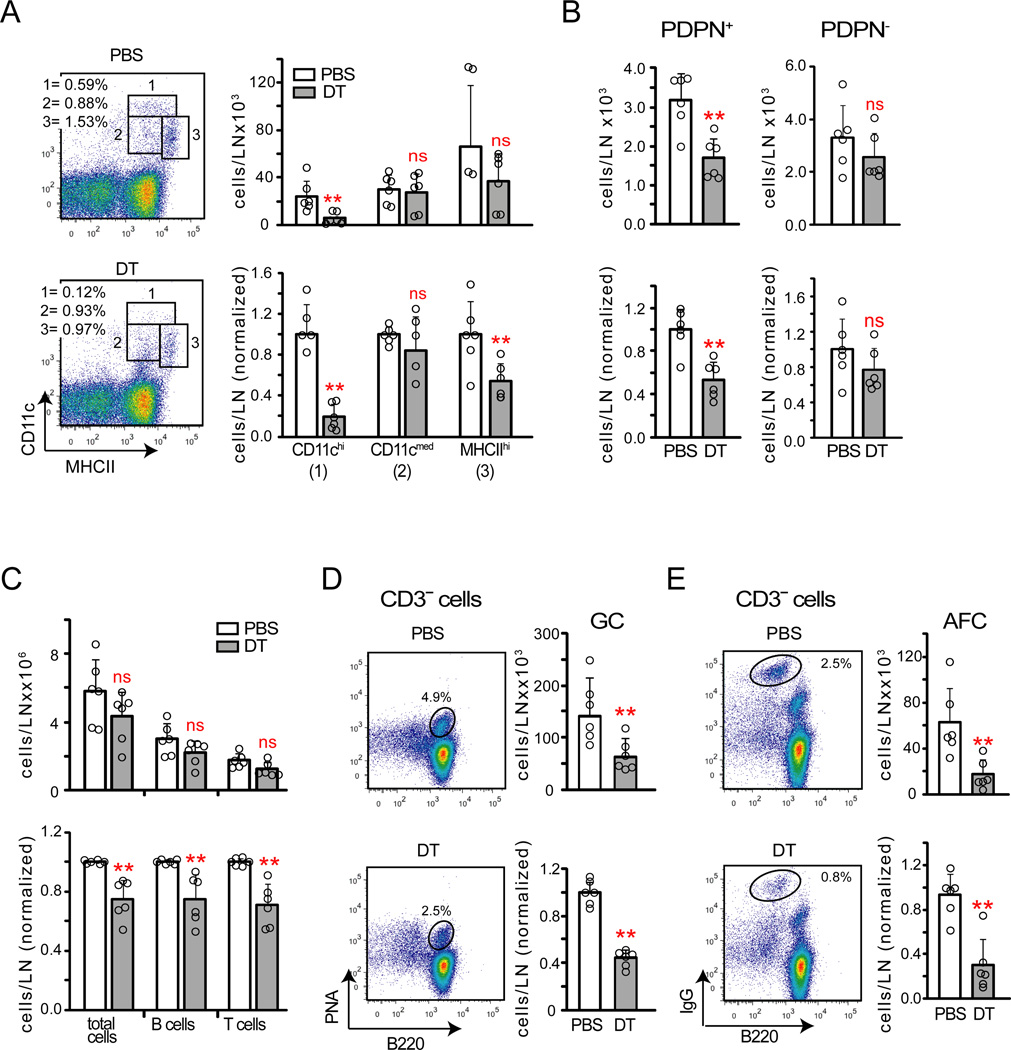
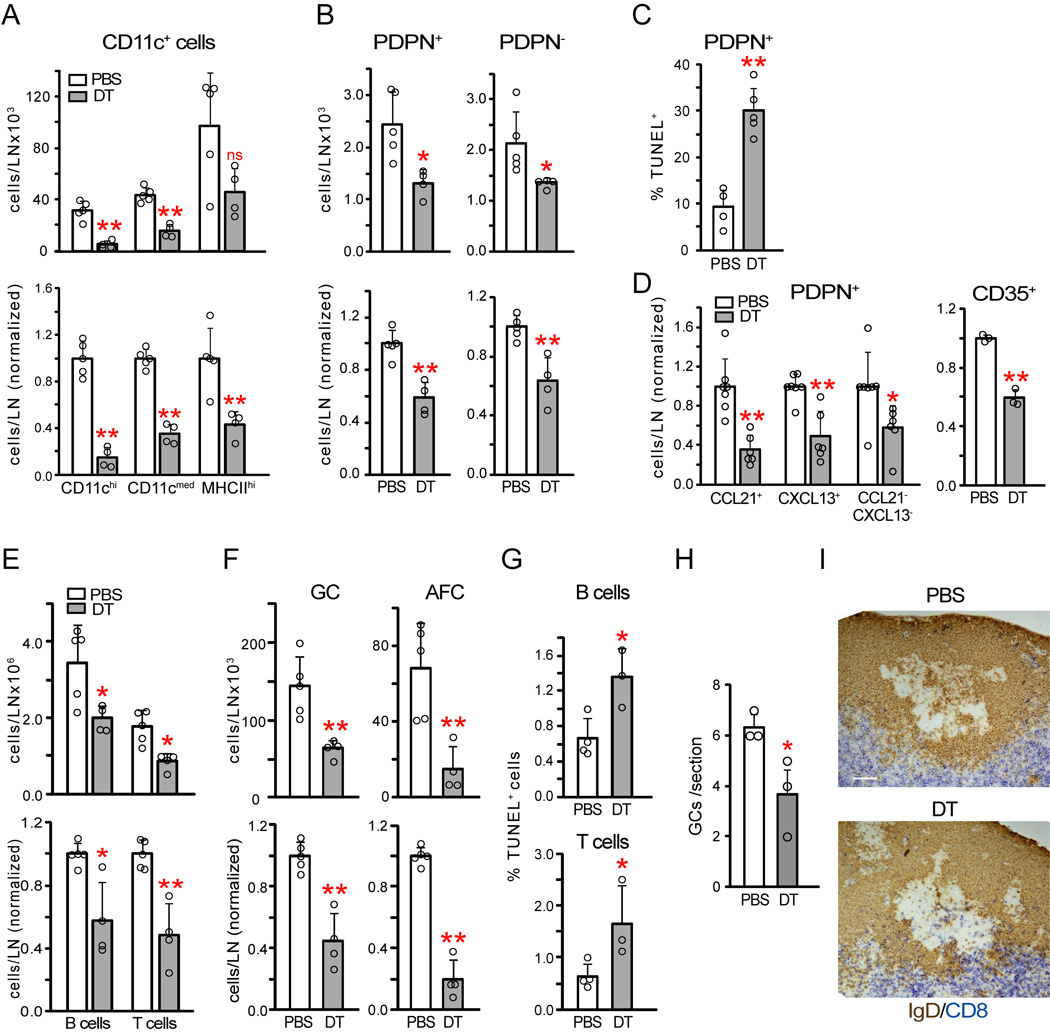
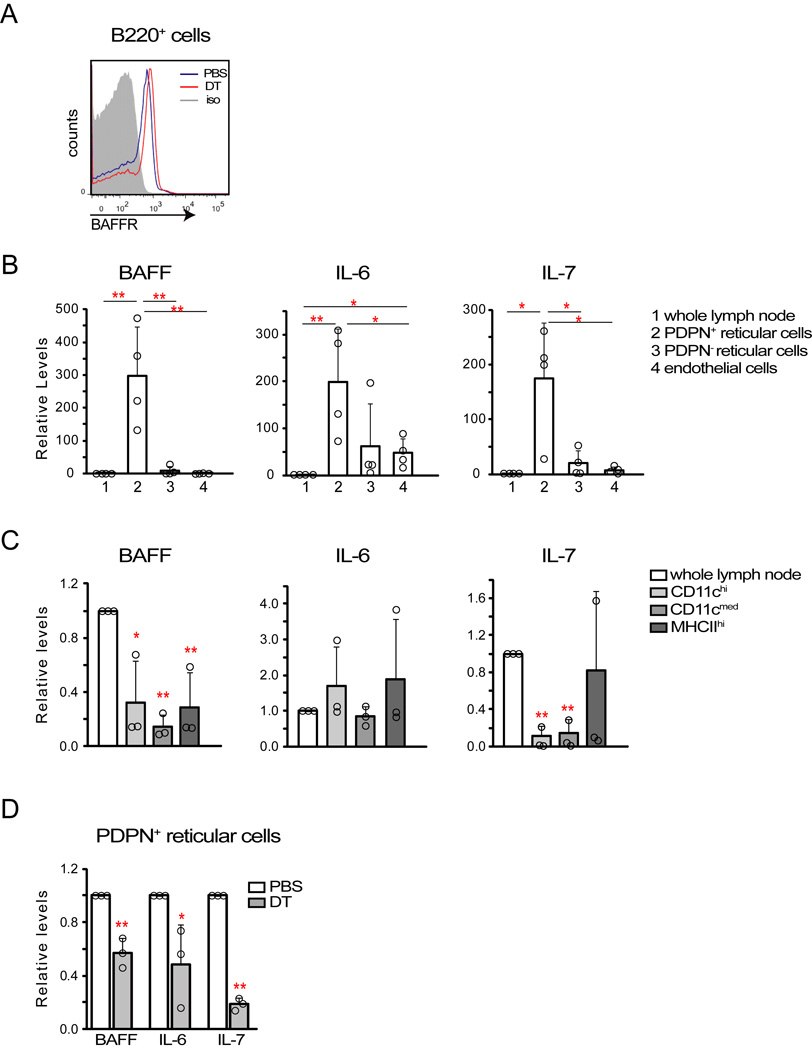
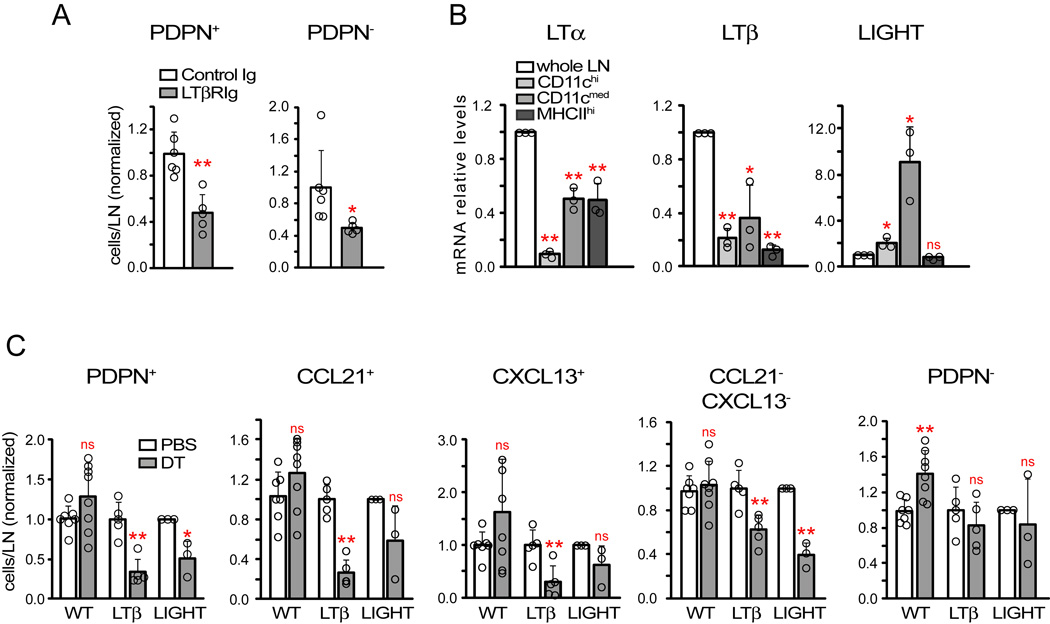
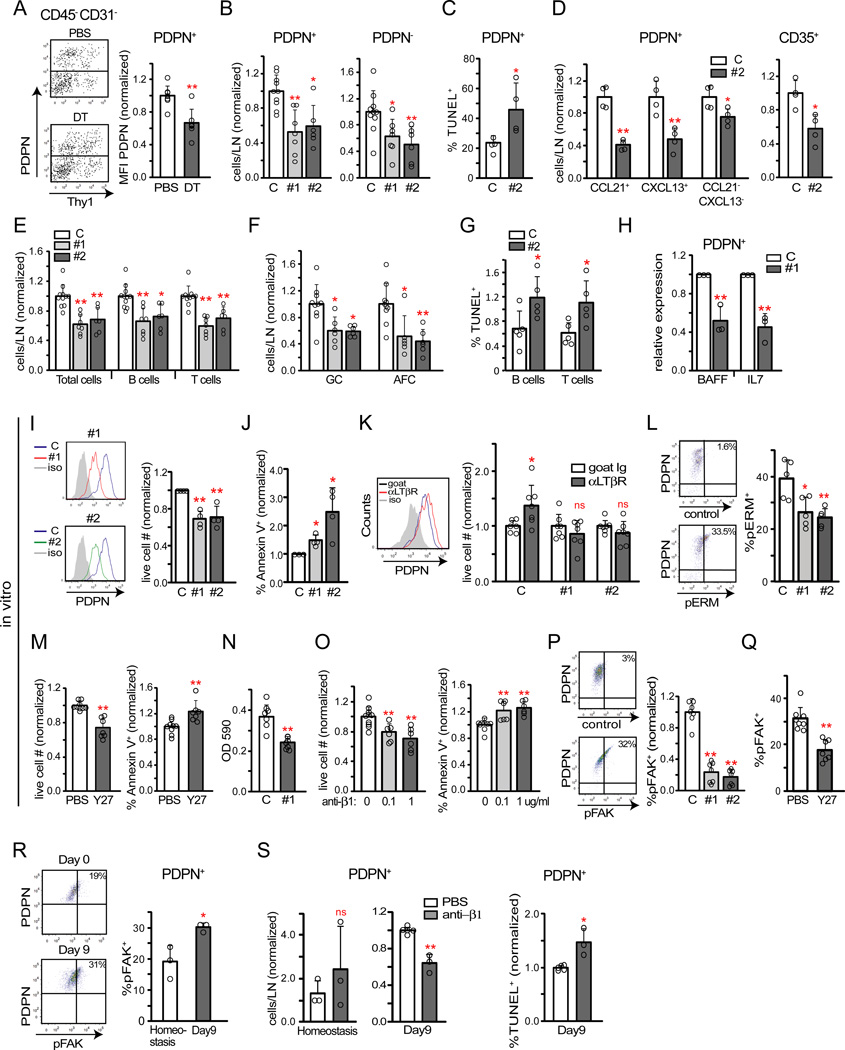
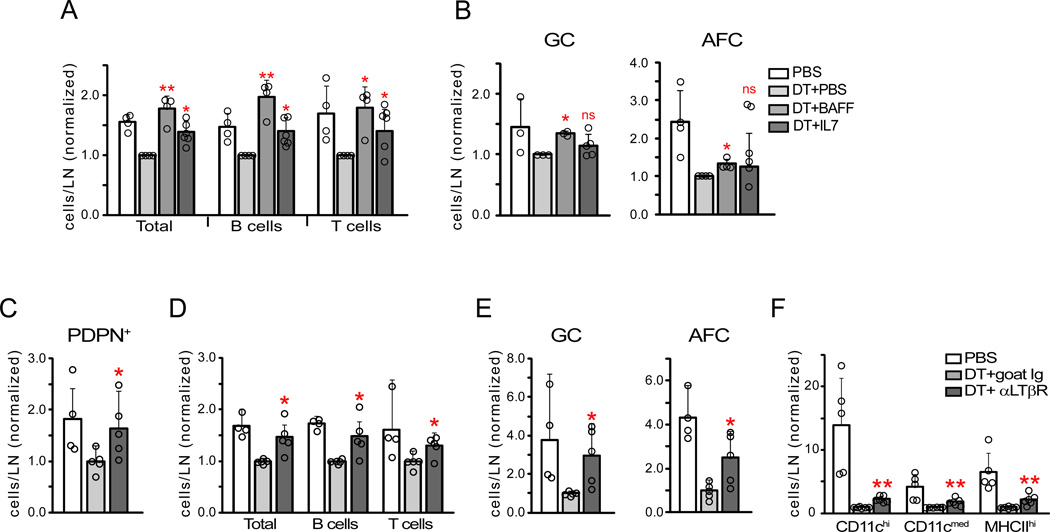
Within secondary lymphoid tissues, stromal reticular cells support lymphocyte function, and targeting reticular cells is a potential strategy for controlling pathogenic lymphocytes in disease. However, the mechanisms that regulate reticular cell function are not well understood. Here we found that during an immune response in lymph nodes, dendritic cells (DCs) maintain reticular cell survival in multiple compartments. DC-derived lymphotoxin beta receptor (LTβR) ligands were critical mediators, and LTβR signaling on reticular cells mediated cell survival by modulating podoplanin (PDPN). PDPN modulated integrin-mediated cell adhesion, which maintained cell survival. This DC-stromal axis maintained lymphocyte survival and the ongoing immune response. Our findings provide insight into the functions of DCs, LTβR, and PDPN and delineate a DC-stromal axis that can potentially be targeted in autoimmune or lymphoproliferative diseases.


Figures

Figure 1
Figure 1. Non-T non-B CD11c+ cells localize with PDPN+ cells in multiple compartments
Cd11c−DTRRag1−/− mixed chimeras were immunized in footpads with OVA-Alum at day 0 and draining popliteal nodes were taken at day 9. Sections were stained for the DTR-EGFP fusion protein and other indicated markers. (A–B) Nearby sections from the same lymph node showing EGFP+ cell localization relative to (A) T cells and (B) B cells and PDPN+ cells. F=follicle. (C–F) EGFP+ cell localization in the (C) T zone (D) follicles, (GC=germinal center), (E) follicular mantle zone, (F) medulla. Results representative of at least 3 lymph nodes. For (A-B, D, F), bar = 100um. For (C,E), bar=50um. See also Figures S1-S2.
Figure 2
Figure 2. Non-T non-B CD11c+ cells maintain PDPN+ reticular cells and the ongoing immune response
Cd11c−DTRRag1−/− mixed chimeras were immunized on day 0, treated with PBS or DT on day 8, and were examined on day 9. (A) CD11c+ cell numbers. Left: Representative flow cytometry plots. Right: Absolute and relative numbers. (B–C) Absolute and relative numbers of (B) PDPN+ and PDPN reticular cells and (C) total, B220+ B, and CD3+ T cells. (D–E) Left: Representative flow cytometry plots. Right: Absolute and relative numbers of (D) germinal center B cells and (E) AFCs. For (A–E), data pooled from 3–4 independent experiments. Each point represents one mouse; error bars represent SD. **=p<.01 in an unpaired t test comparing DT to PBS samples. See also Figure S3.
Figure 3
Figure 3. Classical DCs maintain reticular cell survival and the ongoing immune response
zDC-DTR chimeras were immunized on day 0, injected with PBS or DT on day 8, and examined on day 9. (A) CD11c+ cell numbers. Data pooled from 3 experiments. (B) PDPN+ and PDPN reticular cell numbers. Data pooled from 4 experiments. (C) PDPN+ reticular cell TUNEL staining, expressed as percentage of PDPN+ reticular cells that is TUNEL+. Data pooled from 2 experiments. (D) Reticular cell subpopulation numbers. Left: Normalized numbers of indicated PDPN+ reticular cell subsets. Data from 4 experiments. Right: normalized numbers of total (PDPN+ and PDPN) CD35+ cells. Data from 2 experiments. (E) B and T cell and (F) germinal center B cell and AFC numbers. Data from 3 experiments. (G) TUNEL staining in B220+ B cells and (CD45+) Thy1+ T cells. Data pooled from 2 experiments. (H) Number of germinal centers per tissue section. Data from 3 experiments. (I) Compartmental integrity. Representative of at least 3 pairs of mice. White bar=100um. For (A–H), each symbol represents 1 mouse; error bars represent SD. *=p<.05 and **=p<.01 when compared to PBS samples using unpaired t-test. See also Figure S4.
Figure 4
Figure 4. CD11c+ cell depletion reduces stromal expression of lymphocyte survival factors
Mice were immunized on day 0 and treated or examined at indicated time points after immunization. (A) B cell BAFF receptor expression in Cd11c−DTRRag1−/− chimeras given PBS or DT at day 8 and examined at day 9. Representative of 3 pairs of mice from 2 experiments. (B–C) Expression of BAFF, IL-6, and IL-7 by (B) vascular-stromal and (C) CD11c+ cell subsets. Indicated populations were sorted from (B) day 9 or (C) day 8 draining nodes and cytokine expression evaluated by qPCR. “Whole lymph node” indicates collagenase-digested lymph node cells prior to cell separation. Note differences in scale in (B) and (C). Data pooled from (B) 4 and (C) 3 independent experiments. (D) Cytokine expression by PDPN+ reticular cells at day 9 after CD11c+ cell depletion at day 8 in CD11c-DTR mice. Data pooled from 3 independent experiments. For (B–D), each symbol represents 1 sample sorted from (B, D) 6–8 mice or (C) 4–5 mice. *=p<.05 and **-p<.01 using unpaired t-test compared to controls or as indicated; error bars are SD.
Figure 5
Figure 5. DC-derived LTβR ligands maintain reticular cells
Mice were immunized on day 0 and treated or examined at indicated time points after immunization. (A) PDPN+ and PDPN reticular cell numbers in mice treated with LTβR-Ig at day 8 and examined at day 9. Data pooled from 2 experiments. (B) LTβR ligand mRNA expression by “whole” unsorted lymph node cells and indicated CD11c+ cell subsets at day 8. Data from 3 experiments. (C) Role of DC-derived LTβR ligands. zDC-DTR: WT, LTβ-, or LIGHT-deficient mixed chimeras were immunized at day 0, given PBS or DT at day 8, and reticular cell subset numbers were analyzed at day 9. Data from 3 separate experiments for both LTβ- and LIGHT-deficient chimeras. For (A, C), each symbol represents 1 mouse. For (B), each symbol represents 1 sample sorted from 4–5 pooled mice. *=p<.05 and **=p<.01 using unpaired t-test compared to indicated samples; error bars are SD. See also Figure S5.
Figure 6
Figure 6. PDPN on reticular cells is regulated by DCs and maintains cell survival
(A) PDPN expression on PDPN+ reticular cells in zDC-DTR chimeras at 24 hours after DC depletion. Left: representative flow cytometry plots. Right: Pooled analysis of PDPN geometric mean fluorescence intensity from 5 experiments. (B–H) Mice were immunized at day 0, injected with control or indicated PDPN-targeted siRNAs (PDPN #1 or PDPN #2) on days 6 and 7, and draining popliteal nodes examined at day 9. (B) PDPN+ and PDPN reticular cell numbers. Data pooled from at least 3 experiments. (C) PDPN+ reticular cell TUNEL expression. Data pooled from 2 experiments. (D) Relative numbers of indicated PDPN+ reticular cells subsets and of total (PDPN+ and PDPN) CD35+ cells. Data pooled from 2 experiments. (E–F) Relative numbers of (E) total, B, and T cells and (F) germinal center B cells and AFCs. Data from at least 3 experiments. (G) B and T cell TUNEL staining. Data from 2 experiments. (H) mRNA expression of indicated cytokines by sorted PDPN+ reticular cells. Each symbol represents 1 sample sorted from 8 mice, at 1 sample per condition per experiment. (I–L) Cultured PDPN+ reticular cells were transfected with control, PDPN#1, or PDPN#2 siRNA. (I) Left: Histograms showing extent of PDPN knockdown. Right: Relative cell counts of live gated cells at 48–72 hours after transfection. Data pooled from 4 experiments, at 1 well per condition per experiment. (J) Annexin V binding. Percent of DAPI or 7AAD cells that are Annexin V+ was normalized to control siRNA samples. Each symbol represents one well; data pooled from 3 experiments, at 1–2 wells per condition per experiment. (K) Effects of LTβR stimulation. At 48 hours after transfection, media was changed to serum-free media with goat IgG or anti-LTβR. Live-gated cells were analyzed 24 hours later. Left: PDPN expression in control siRNA samples. Right: Cell numbers, normalized to the goat IgG sample. Each symbol represents one well; data pooled from 4 experiments, at 1–3 wells per condition per experiment. (L) pERM expression. Cells were examined 48 hours after transfection. Left: Representative flow cytometry plots of control siRNA cells. Right: pERM levels expressed as a percentage of cells that are pERM+. Each symbol represents one well; data pooled from 2 experiments, at 2–3 samples per condition per experiment. (M) Effects of Y27632 treatment on cell survival. Left: Numbers of DAPI cells. Right: Annexin V binding on DAPI cells. Each symbol represents one well; data pooled from 2 of 4 similar experiments, at 3–5 wells per condition per experiment. (N) Cell adhesion upon PDPN knockdown, shown as OD at 590nm. Each symbol represents 1 well; data pooled from 3 experiments, at 2–3 wells per condition per experiment. (O) Effect of β 1 integrin blockade on cell survival. Left: Numbers of DAPI cells. Right: Annexin V binding on DAPI cells. Each symbol represents one well; data pooled from 2 experiments, at 3–5 wells per condition per experiment. (P) pFAK (at Y397) expression with PDPN knockdown. Cells were examined at 48 hours after transfection. Left: Representative flow cytometry plot of control siRNA cells. Right: pFAK expression. Percent of cells that are pFAK+ was normalized to control siRNA samples. Each symbol represents 1 well; data pooled from 3 experiments at 2–3 wells per condition per experiment. (Q) Reticular cell pFAK expression with Y27632 treatment. Each symbol represents 1 well; data pooled from 2 experiments, at 2–3 wells per condition per experiment. (R) PDPN+ reticular cell pFAK expression at homeostasis and at day 9 after immunization. Left: Representative flow cytometry plots. Right: pFAK expression. Each symbol represents one mouse; data pooled from 2 experiments. (S) Effect of β1 integrin blockade for 24 hours in vivo. Left: PDPN+ reticular cell numbers at homeostasis and at day 9 after immunization. Right: TUNEL staining in day 9 mice. Each symbol represents one mouse; data shown is from 2 (homeostasis) to 3 (day 9) experiments. For (A–S), *=p<.05 and **=p<.01 when compared to indicated controls using unpaired t-test; error bars are SD. See also Figure S6.
Figure 7
Figure 7. Disrupted immune responses with DC depletion can be rescued by survival factor administration or LTβR stimulation
(A–B) BAFF and IL-7 administration. zDC-DTR chimeras were given PBS or DT at day 8 after immunization and indicated cytokine at 5–8 hours after PBS or DT. Mice were examined 20–24 hours after cytokine injection. The numbers of cells in indicated populations were normalized and compared to “DT+PBS” numbers. (A) Total, B, and T cell numbers. (B) Germinal center B cell and AFC numbers. Data from 4 experiments. (C–F) LTβR stimulation. Same experimental setup as in (A–B), except that zDC-DTR chimeras received control goat Ig or agonist anti-LTβR after DT. The numbers of indicated populations were normalized and compared to “DT+goat Ig” numbers. (C) PDPN+ reticular cells. (D) Total, B, and T cells. (E) Germinal center B cells and AFCs. (F) CD11c+ cell subsets. Data from 4 experiments. For (A–F), each symbol represents 1 mouse. *=p<.05 and **=p<.01 when compared to indicated controls using unpaired t-test; error bars are SD. See also Figure S7.

References

    1. Acton SE, Farrugia AJ, Astarita JL, Mourao-Sa D, Jenkins RP, Nye E, Hooper S, van Blijswijk J, Rogers NC, Snelgrove KJ, et al. Dendritic cells control fibroblastic reticular network tension and lymph node expansion. Nature. 2014;514:498–502. - PMC - PubMed
    1. Astarita JL, Acton SE, Turley SJ. Podoplanin: emerging functions in development, the immune system, and cancer. Front Immunol. 2012;3:283. - PMC - PubMed
    1. Astarita JL, Cremasco V, Fu J, Darnell MC, Peck JR, Nieves-Bonilla JM, Song K, Kondo Y, Woodruff MC, Gogineni A, et al. The CLEC-2-podoplanin axis controls the contractility of fibroblastic reticular cells and lymph node microarchitecture. Nat Immunol. 2015;16:75–84. - PMC - PubMed
    1. Bajenoff M, Egen JG, Koo LY, Laugier JP, Brau F, Glaichenhaus N, Germain RN. Stromal cell networks regulate lymphocyte entry, migration, and territoriality in lymph nodes. Immunity. 2006;25:989–1001. - PMC - PubMed
    1. Bannard O, Horton RM, Allen CD, An J, Nagasawa T, Cyster JG. Germinal center centroblasts transition to a centrocyte phenotype according to a timed program and depend on the dark zone for effective selection. Immunity. 2013;39:912–924. - PMC - PubMed

Publication types

MeSH terms