

Odorant receptors regulate the final glomerular coalescence of olfactory sensory neuron axons
- PMID: 25902488
- PMCID: PMC4426395
- DOI: 10.1073/pnas.1417955112
Odorant receptors regulate the final glomerular coalescence of olfactory sensory neuron axons
Abstract
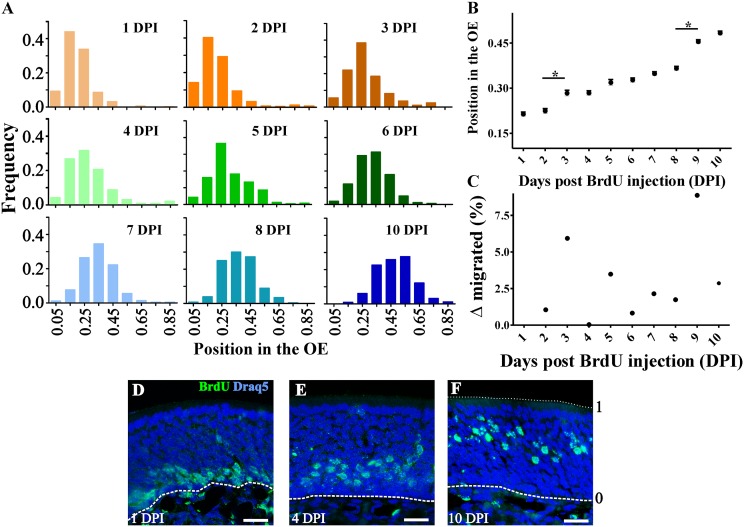
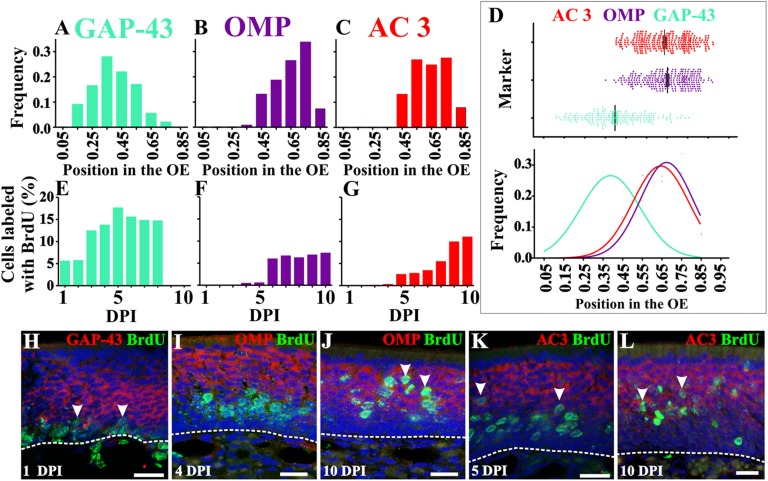
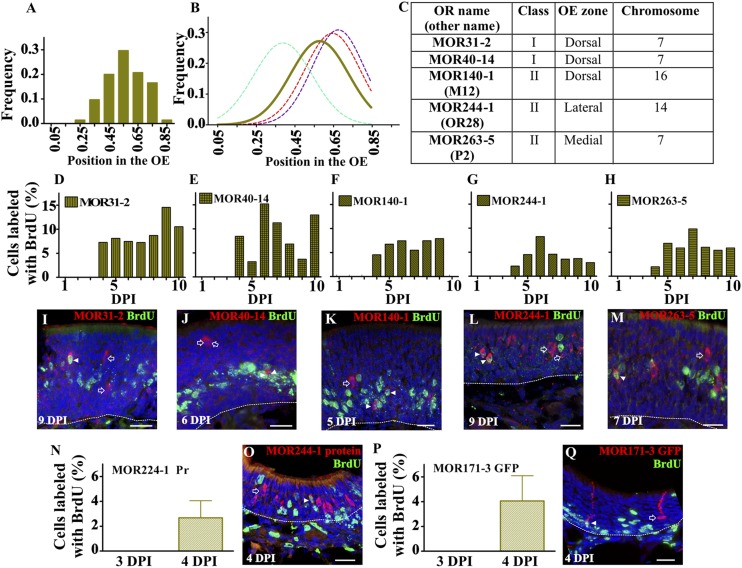
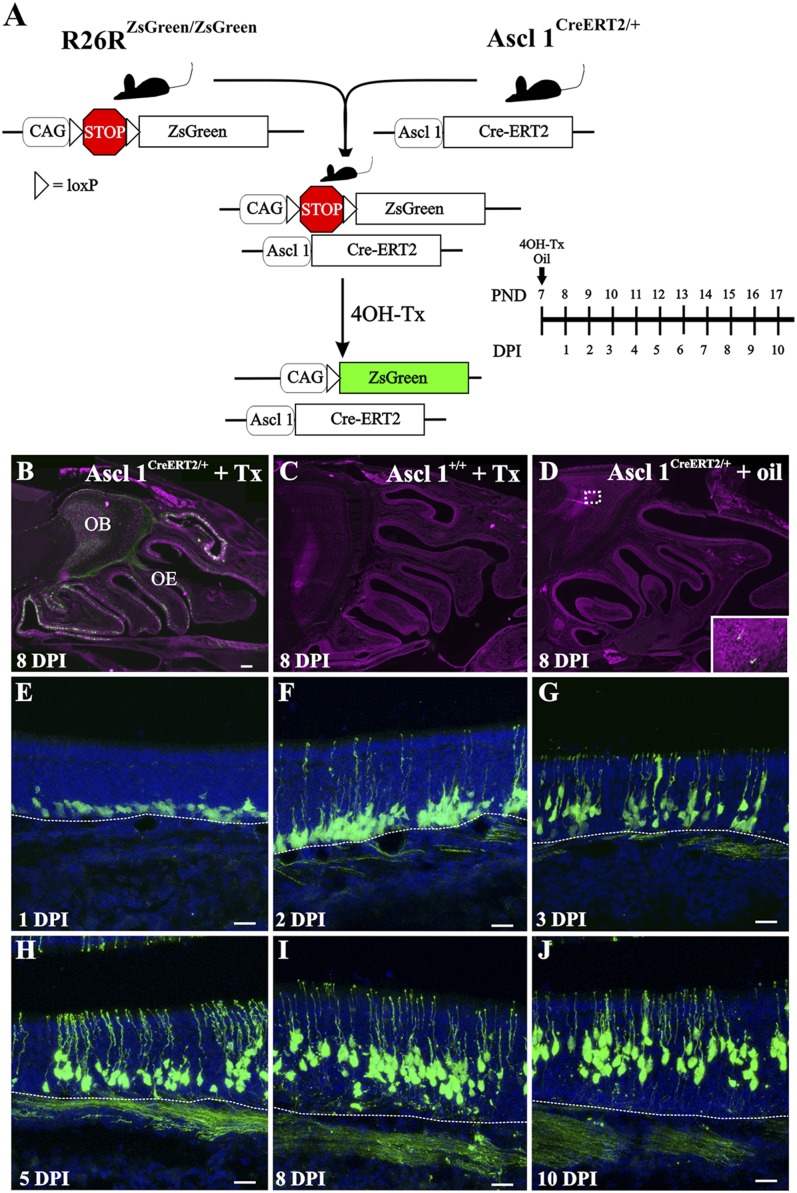
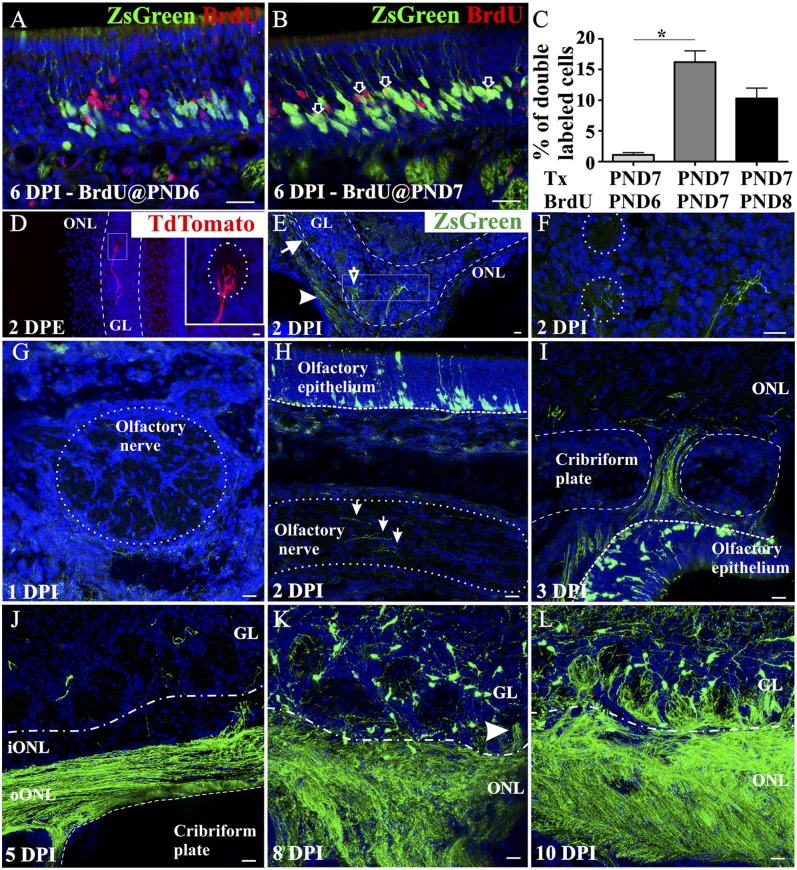
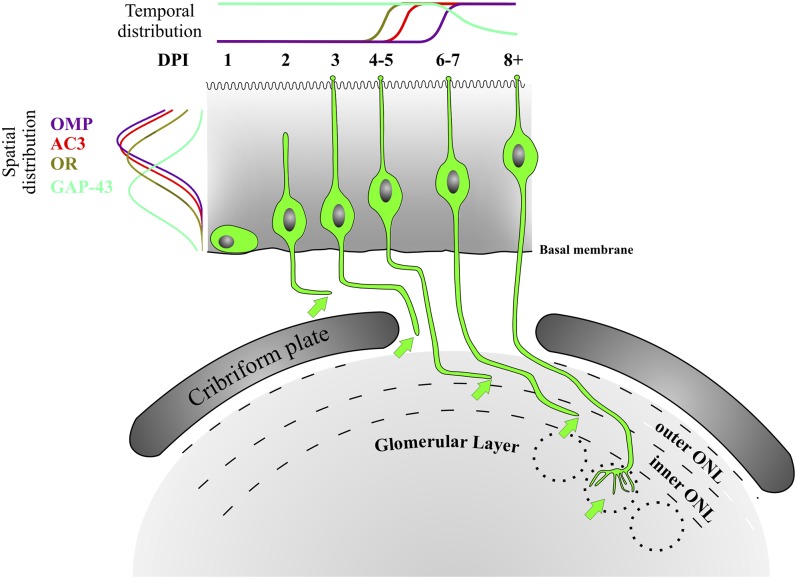
Odorant receptors (OR) are strongly implicated in coalescence of olfactory sensory neuron (OSN) axons and the formation of olfactory bulb (OB) glomeruli. However, when ORs are first expressed relative to basal cell division and OSN axon extension is unknown. We developed an in vivo fate-mapping strategy that enabled us to follow OSN maturation and axon extension beginning at basal cell division. In parallel, we mapped the molecular development of OSNs beginning at basal cell division, including the onset of OR expression. Our data show that ORs are first expressed around 4 d following basal cell division, 24 h after OSN axons have reached the OB. Over the next 6+ days the OSN axons navigate the OB nerve layer and ultimately coalesce in glomeruli. These data provide a previously unidentified perspective on the role of ORs in homophilic OSN axon adhesion and lead us to propose a new model dividing axon extension into two phases. Phase I is OR-independent and accounts for up to 50% of the time during which axons approach the OB and begin navigating the olfactory nerve layer. Phase II is OR-dependent and concludes as OSN axons coalesce in glomeruli.
Keywords: Ascl1; axon guidance; olfactory epithelium; olfactory marker protein; tamoxifen.
Conflict of interest statement
The authors declare no conflict of interest.
Figures
Similar articles
-
Slits and Robo-2 regulate the coalescence of subsets of olfactory sensory neuron axons within the ventral region of the olfactory bulb.Dev Biol. 2012 Nov 15;371(2):269-79. doi: 10.1016/j.ydbio.2012.08.028. Epub 2012 Sep 7. Dev Biol. 2012. PMID: 22981605
-
Hyperpolarization-activated cyclic nucleotide-gated channels in olfactory sensory neurons regulate axon extension and glomerular formation.J Neurosci. 2010 Dec 8;30(49):16498-508. doi: 10.1523/JNEUROSCI.4225-10.2010. J Neurosci. 2010. PMID: 21147989 Free PMC article.
-
Axon fasciculation in the developing olfactory nerve.Neural Dev. 2010 Aug 19;5:20. doi: 10.1186/1749-8104-5-20. Neural Dev. 2010. PMID: 20723208 Free PMC article.
-
Odorant receptor gene choice and axonal projection in the mouse olfactory system.Results Probl Cell Differ. 2009;47:57-75. doi: 10.1007/400_2008_3. Results Probl Cell Differ. 2009. PMID: 19083127 Review.
-
Developing and maintaining a nose-to-brain map of odorant identity.Open Biol. 2022 Jun;12(6):220053. doi: 10.1098/rsob.220053. Epub 2022 Jun 29. Open Biol. 2022. PMID: 35765817 Free PMC article. Review.
Cited by
-
Low survival rate of young adult-born olfactory sensory neurons in the undamaged mouse olfactory epithelium.J Bioenerg Biomembr. 2019 Feb;51(1):41-51. doi: 10.1007/s10863-018-9774-8. Epub 2018 Oct 9. J Bioenerg Biomembr. 2019. PMID: 30302619 Free PMC article.
-
In mice, discrete odors can selectively promote the neurogenesis of sensory neuron subtypes that they stimulate.Elife. 2025 Jun 18;13:RP96152. doi: 10.7554/eLife.96152. Elife. 2025. PMID: 40531183 Free PMC article.
-
Stem and progenitor cells of the mammalian olfactory epithelium: Taking poietic license.J Comp Neurol. 2017 Mar 1;525(4):1034-1054. doi: 10.1002/cne.24105. Epub 2016 Sep 27. J Comp Neurol. 2017. PMID: 27560601 Free PMC article. Review.
-
Hierarchical deconstruction of mouse olfactory sensory neurons: from whole mucosa to single-cell RNA-seq.Sci Rep. 2015 Dec 16;5:18178. doi: 10.1038/srep18178. Sci Rep. 2015. PMID: 26670777 Free PMC article.
-
5HTR3A-driven GFP labels immature olfactory sensory neurons.J Comp Neurol. 2017 May 1;525(7):1743-1755. doi: 10.1002/cne.24180. Epub 2017 Feb 27. J Comp Neurol. 2017. PMID: 28152579 Free PMC article.
References
-
- Mombaerts P, et al. Visualizing an olfactory sensory map. Cell. 1996;87(4):675–686. - PubMed
-
- Feinstein P, Bozza T, Rodriguez I, Vassalli A, Mombaerts P. Axon guidance of mouse olfactory sensory neurons by odorant receptors and the beta2 adrenergic receptor. Cell. 2004;117(6):833–846. - PubMed
-
- Feinstein P, Mombaerts P. A contextual model for axonal sorting into glomeruli in the mouse olfactory system. Cell. 2004;117(6):817–831. - PubMed
Publication types
MeSH terms
Substances
Grants and funding
LinkOut - more resources
Full Text Sources
Other Literature Sources
Molecular Biology Databases
Miscellaneous
