

X-ray phase-contrast tomography with a compact laser-driven synchrotron source
- PMID: 25902493
- PMCID: PMC4426454
- DOI: 10.1073/pnas.1500938112
X-ray phase-contrast tomography with a compact laser-driven synchrotron source
Abstract
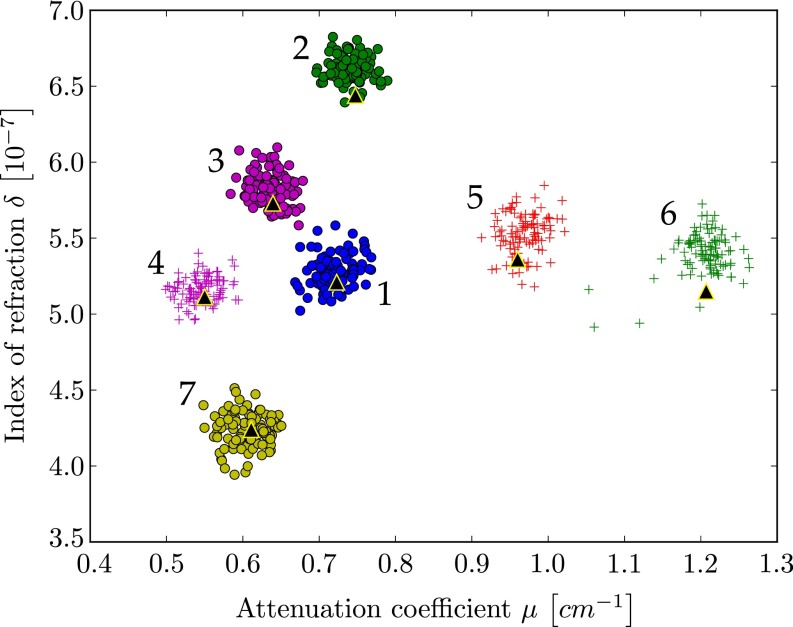
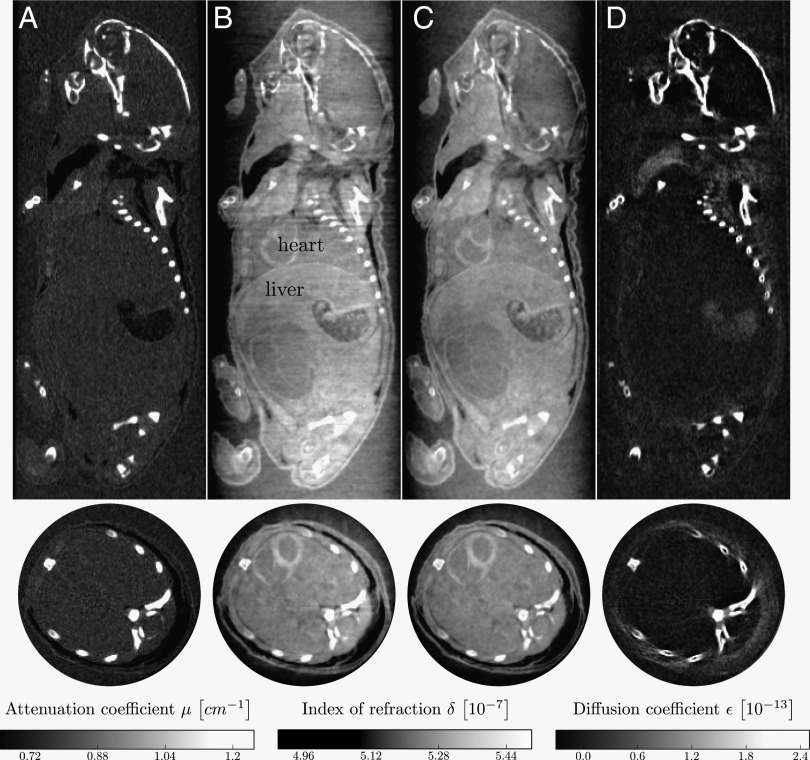
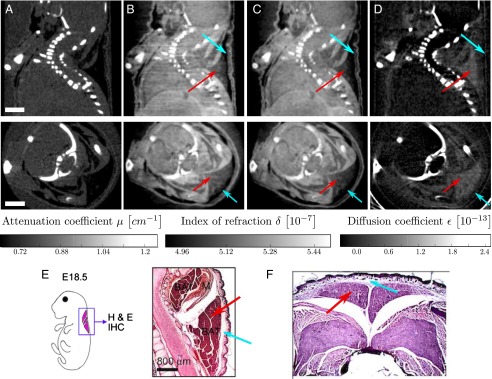
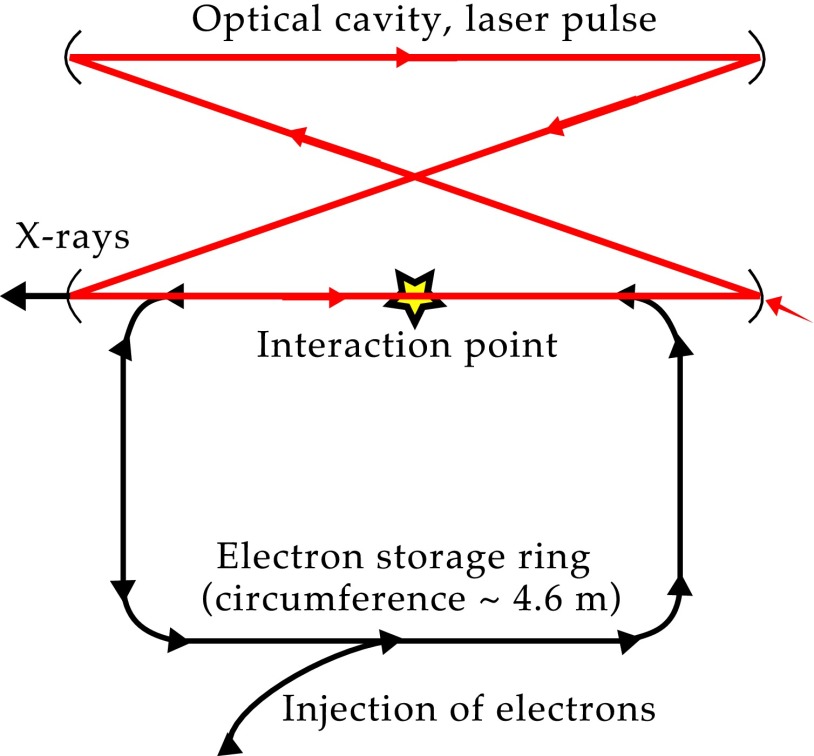
Between X-ray tubes and large-scale synchrotron sources, a large gap in performance exists with respect to the monochromaticity and brilliance of the X-ray beam. However, due to their size and cost, large-scale synchrotrons are not available for more routine applications in small and medium-sized academic or industrial laboratories. This gap could be closed by laser-driven compact synchrotron light sources (CLS), which use an infrared (IR) laser cavity in combination with a small electron storage ring. Hard X-rays are produced through the process of inverse Compton scattering upon the intersection of the electron bunch with the focused laser beam. The produced X-ray beam is intrinsically monochromatic and highly collimated. This makes a CLS well-suited for applications of more advanced--and more challenging--X-ray imaging approaches, such as X-ray multimodal tomography. Here we present, to our knowledge, the first results of a first successful demonstration experiment in which a monochromatic X-ray beam from a CLS was used for multimodal, i.e., phase-, dark-field, and attenuation-contrast, X-ray tomography. We show results from a fluid phantom with different liquids and a biomedical application example in the form of a multimodal CT scan of a small animal (mouse, ex vivo). The results highlight particularly that quantitative multimodal CT has become feasible with laser-driven CLS, and that the results outperform more conventional approaches.
Keywords: X-ray imaging; dark-field tomography; grating interferometer; inverse Compton X-rays; phase-contrast tomography.
Conflict of interest statement
Conflict of interest statement: The contributions of R.D.R. to this publication were as a paid consultant of Lyncean Technologies, Inc., and were not part of his Stanford University duties or responsibilities.
Figures
References
-
- Momose A, et al. 2003. Demonstration of X-ray Talbot interferometry. Jpn J Appl Phys 42(7B):L866–L868.
-
- Weitkamp T, et al. X-ray phase imaging with a grating interferometer. Opt Express. 2005;13(16):6296–6304. - PubMed
-
- Pfeiffer F, Weitkamp T, Bunk O, David C. Phase retrieval and differential phase-contrast imaging with low-brilliance X-ray sources. Nat Phys. 2006;2(4):258–261.
-
- Pfeiffer F, et al. High-resolution brain tumor visualization using three-dimensional x-ray phase contrast tomography. Phys Med Biol. 2007;52(23):6923–6930. - PubMed
-
- Pfeiffer F, et al. Hard-X-ray dark-field imaging using a grating interferometer. Nat Mater. 2008;7(2):134–137. - PubMed
Publication types
MeSH terms
Substances
Grants and funding
LinkOut - more resources
Full Text Sources
Other Literature Sources
Miscellaneous
