

Phytoplankton adapt to changing ocean environments
- PMID: 25902497
- PMCID: PMC4426419
- DOI: 10.1073/pnas.1414752112
Phytoplankton adapt to changing ocean environments
Abstract
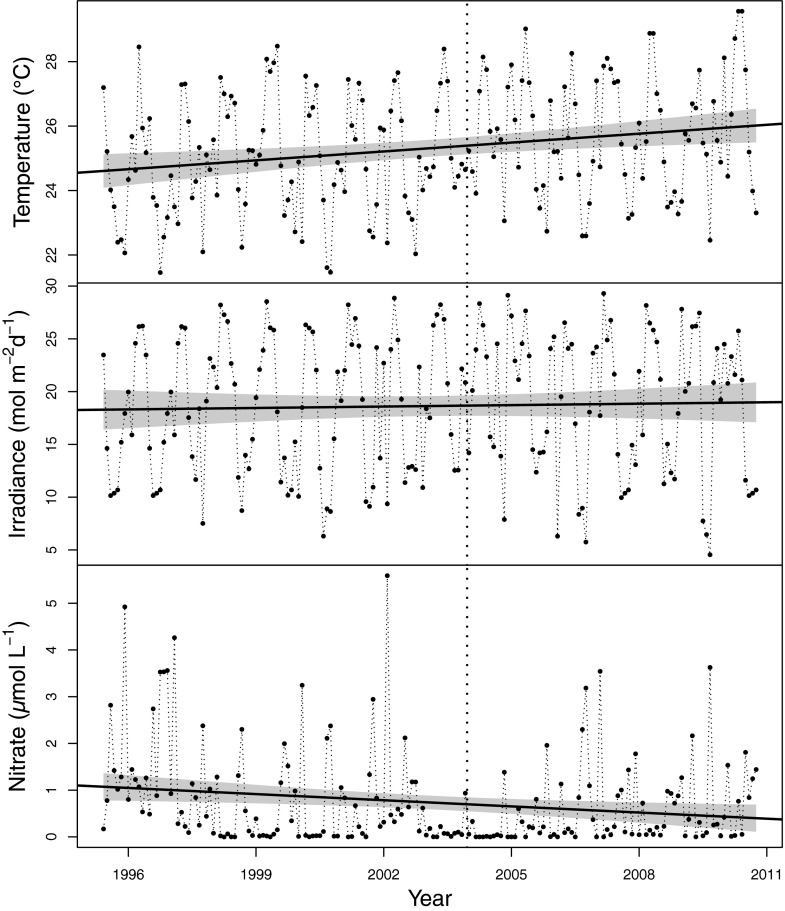
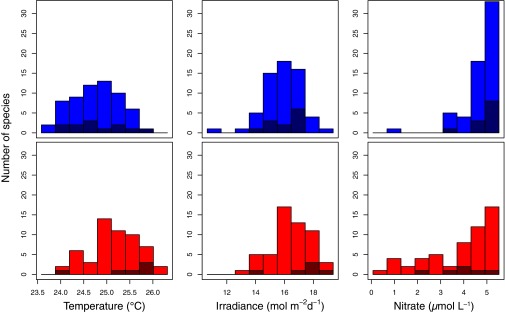
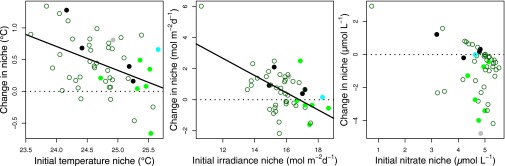
Model projections indicate that climate change may dramatically restructure phytoplankton communities, with cascading consequences for marine food webs. It is currently not known whether evolutionary change is likely to be able to keep pace with the rate of climate change. For simplicity, and in the absence of evidence to the contrary, most model projections assume species have fixed environmental preferences and will not adapt to changing environmental conditions on the century scale. Using 15 y of observations from Station CARIACO (Carbon Retention in a Colored Ocean), we show that most of the dominant species from a marine phytoplankton community were able to adapt their realized niches to track average increases in water temperature and irradiance, but the majority of species exhibited a fixed niche for nitrate. We do not know the extent of this adaptive capacity, so we cannot conclude that phytoplankton will be able to adapt to the changes anticipated over the next century, but community ecosystem models can no longer assume that phytoplankton cannot adapt.
Keywords: climate change; evolution; phytoplankton; realized niches.
Conflict of interest statement
The authors declare no conflict of interest.
Figures
Comment in
-
Reply to Brun et al.: Fingerprint of evolution revealed by shifts in realized phytoplankton niches in natural populations.Proc Natl Acad Sci U S A. 2015 Sep 22;112(38):E5225. doi: 10.1073/pnas.1514396112. Epub 2015 Sep 4. Proc Natl Acad Sci U S A. 2015. PMID: 26340992 Free PMC article. No abstract available.
-
Measuring evolutionary adaptation of phytoplankton with local field observations.Proc Natl Acad Sci U S A. 2015 Sep 22;112(38):E5223-4. doi: 10.1073/pnas.1513353112. Epub 2015 Sep 4. Proc Natl Acad Sci U S A. 2015. PMID: 26340993 Free PMC article. No abstract available.
References
-
- Houghton JT, Jenkins GJ, Ephraums JJ. Climate Change: The IPCC Scientific Assessment. Cambridge Univ Press; Cambridge: 1996.
-
- Meehl GA, et al. Global climate projections. Climate Change 2007: The Physical Science Basis. Contribution of Working Group I to the Fourth Assessment Report of the Intergovernmental Panel on Climate Change. Cambridge Univ Press; Cambridge, UK: 2007.
-
- Levitus S, Antonov J, Boyer T. 2005. Warming of the world ocean, 1955–2003. Geophys Res Lett 32(2):L12602. - PubMed
-
- Latif M, et al. Reconstructing, monitoring, and predicting multidecadal-scale changes in the North Atlantic thermohaline circulation with sea surface temperature. J Clim. 2004;17(7):1605–1614.
-
- Church MJ, Lomas MW, Muller-Karger F. 2013. Sea change: Charting the course for biogeochemical ocean time-series research in a new millennium. Deep Sea Res Part II Top Stud Oceanogr 93:2–15.
Publication types
MeSH terms
LinkOut - more resources
Full Text Sources
Other Literature Sources
