. 2015 May 12;112(19):5991-6.
doi: 10.1073/pnas.1424106112. Epub 2015 Apr 22.

Injury alters intrinsic functional connectivity within the primate spinal cord

Affiliations

Injury alters intrinsic functional connectivity within the primate spinal cord

Li Min Chen et al. Proc Natl Acad Sci U S A. .

Abstract

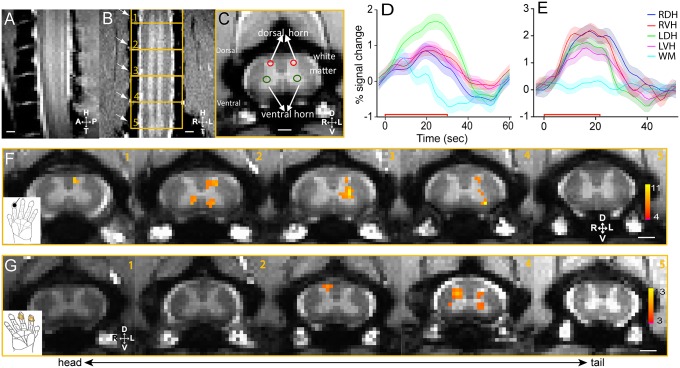
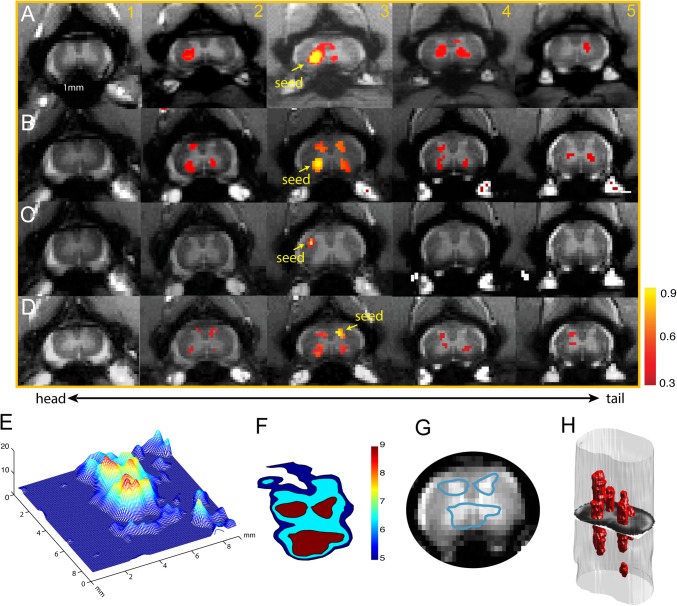
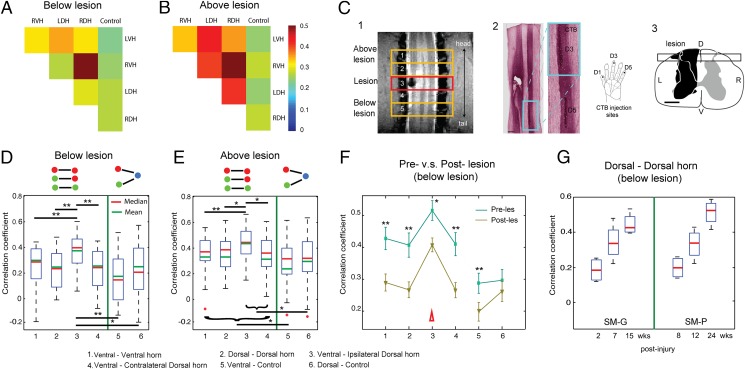
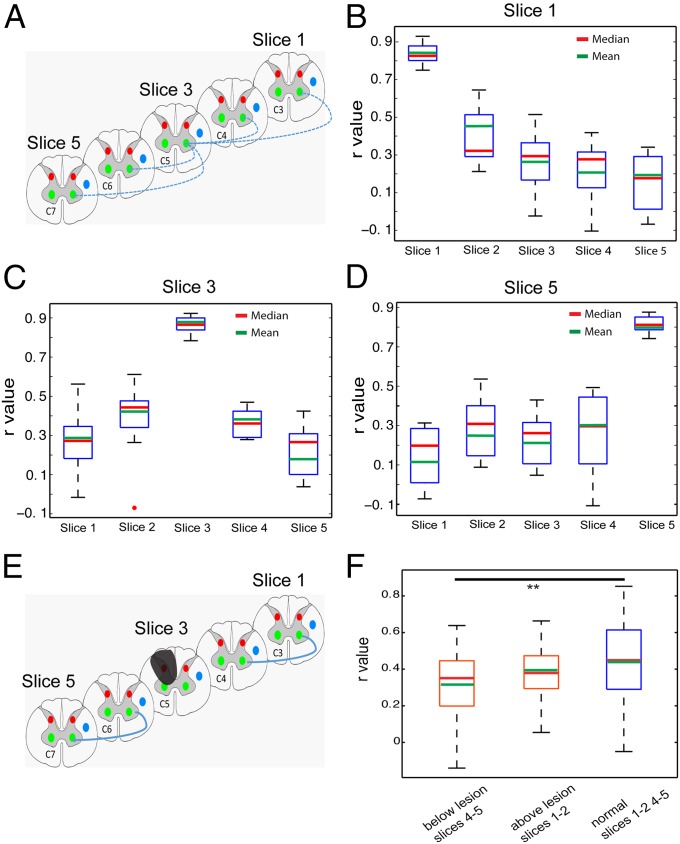
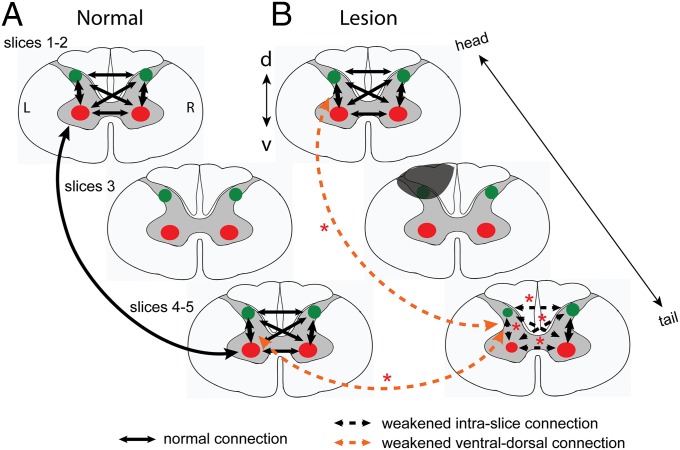
Recent demonstrations of correlated low-frequency MRI signal variations between subregions of the spinal cord at rest in humans, similar to those found in the brain, suggest that such resting-state functional connectivity constitutes a common feature of the intrinsic organization of the entire central nervous system. We report our detection of functional connectivity within the spinal cords of anesthetized squirrel monkeys at rest and show that the strength of connectivity within these networks is altered by the effects of injuries. By quantifying the low-frequency MRI signal correlations between different horns within spinal cord gray matter, we found distinct functional connectivity relationships between the different sensory and motor horns, a pattern that was similar to activation patterns evoked by nociceptive heat or tactile stimulation of digits. All horns within a single spinal segment were functionally connected, with the strongest connectivity occurring between ipsilateral dorsal and ventral horns. Each horn was strongly connected to the same horn on neighboring segments, but this connectivity reduced drastically along the spinal cord. Unilateral injury to the spinal cord significantly weakened the strength of the intrasegment horn-to-horn connectivity only on the injury side and in slices below the lesion. These findings suggest resting-state functional connectivity may be a useful biomarker of functional integrity in injured and recovering spinal cords.

Keywords: cervical spinal cord; hand; monkey; resting state fMRI; spinal cord injury.


Conflict of interest statement

The authors declare no conflict of interest.

Figures

Fig. 1.
Fig. 1.
Innocuous tactile and noxious heat stimuli evoked fMRI activations in the gray matter of cervical spinal cord. (A) Middle sagittal MTC image (0.75 mm thickness) of cervical spine showed the entering roots of C4–C7 afferents (white fiber bundles). (B) Coronal MTC image (0.5 mm thickness) shows the placement of five axial imaging slices, with the center slice at the C5/C6 level. Alternating white and gray (bright) matter strips of the spinal cord were apparent. Surrounding cerebrospinal fluid was present as two white strips on both the left and right sides of the spinal cord. Nerve afferents entering roots (indicated by white arrows) were also visible and allowed identification of each segment of the cervical spinal cord. (C) MTC axial image (3 mm thickness) revealed clearly the butterfly-shaped spinal gray matter. Red circles indicate the dorsal sensory horns, and green circles show the ventral horns. Surrounding back region comprises bone structures. (D) Event-averaged time courses of fMRI signal (%) to innocuous tactile (8 Hz vibration) stimulation at four horns (LDH, left dorsal horn; LVH, left ventral horn; RDH, right dorsal horn; RVH, right ventral horn) and one white matter (WM) control. The color shadow around each color line indicated the ±SE of fMRI signal change. The red line along the x axis showed the 30-s stimulus duration. (E) Event-averaged time courses of fMRI signal (%) to noxious heat (47.5 °C) stimulation at four horns and one white matter control region. Stimulus duration is 21 s. (F) fMRI activation map to tactile stimulation of distal finger pad of D2 on left hand (thresholded at t = 4; see color scale bar in 5) on five consecutive axial MTC structural images (1–5, from tail to head). (Black scale bar in 5, 1 mm.) (G) fMRI activation map to noxious heat (47.5 °C) stimulation of distal finger pads of D2 and D3 on the right hand (thresholded at t = 3; see color scale bar in 5). D, dorsal; L, left; R, right; V, ventral.
Fig. 2.
Fig. 2.
Reproducible functional connectivity pattern of the spinal cord horns. (A and B) Intra- (within) and inter- (across) slice correlation patterns of the seeds (indicated by yellow arrows) placed at the ventral horns on slice 3 in two representative normal animals (A, SM-H; B, SM-R). Correlation maps were thresholded at r > 0.30 (see color scale bar next to image 5). (C) Intra- and interslice correlation pattern of one control seed at the white matter of slice 3 in SM-H. (D) Intra- and interslice correlation patterns of the seed (indicated by yellow arrows) placed at the LDH on slice 3. Correlation maps were thresholded at r > 0.30 (see color scale bar next to image 5). (E) A 3D illustration of the t statistic of the correlation map of the RVH at the group level (15 runs from 5 animals). (F) Corresponding contour map of the group correlation pattern at three different t statistics (blue, t = 5; light blue, t = 6.5; red, t = 9). The LVH in slice 3 in one subject was used as the point of interest for manual coregistration in the group analysis. (G) Overlay of the thresholded (red patch) correlation map of LVH seed on the mean intensity map of the spinal cord MTC images. (H) A 3D reconstruction of the correlation map from the sample case shown in A.
Fig. 3.
Fig. 3.
Effects of a unilateral spinal cord lesion on the functional connectivity of intraslice ROIs. (A and B) The 2D matrix plots of the mean correlation coefficients (r values) among all five intraslice ROI pairs in below (A) and above (B) lesion slices in one representative animal (SM-P). The color bar indicates the range of r values. (C, 1) Coronal MTC image shows the actual lesion (black hole) detected at the 2-week postlesion time point. Red rectangle outline shows the placement of the third axial image slice, which is centered at the lesion level. (C, 2) CTB stain of the corresponding postmortem spinal cord obtained at 10 weeks after the lesion. Zoomed-in image (left) shows the CTB terminals of the afferent entering zone for D5 and D3. (C, 3) The reconstructed lesion on the axial plane of the spinal cord in monkey SM-P. Black rectangle outline shows the location of the coronal MRI image shown in 2. (D and E) Whisker box plots of the correlation coefficients between horn–horn ROI (columns 1–4) and horn–control (white matter) ROI pairs (columns 5–6) at the below lesion (slices 5 and 6) and above lesion (slices 1 and 2) imaging slices, respectively. Green lines separate the horn–horn and horn–control ROI pair groups. (F) Direct comparison of the mean correlation coefficients of the same set of ROI pairs obtained before (prelesion, green line) and after (postlesion, yellow line) the lesions. Error bars indicated the SD of the measurements. Datasets of 10 runs from two monkeys with spinal cord lesion acquired within 2–24 weeks postlesion were included in this analysis. (G) Whisker box plot of the correlation coefficients between dorsal–dorsal horns in below lesion slices as a function of postlesion time point (in weeks) in two injury monkeys (SM-G and SM-P).
Fig. 4.
Fig. 4.
Functional connectivity pattern of interslice ROIs in normal and lesion conditions. (A) Schematic diagram shows the pair-wise correlation analysis (indicated by blue lines) with respect to one particular seed ROI of the LVH of slice 3 (∼ at C5 level). Correlation coefficients (r values) were calculated between the LVH on slice 3 (seed) with respect to the corresponding LVH on slices 1, 2, 4, and 5. (B) Whisker box plots of the correlation coefficient of the LVH ROI (on image slice 1) with other ventral horn seeds on slices 1–5 in the group analysis. (C and D) Whisker box plots of the correlation coefficients of the LVH seeds on the third (C) and fifth (D) slices with other ventral horn seeds. The upper and lower bounds of the box indicate the upper and lower quartile of the group data (15 datasets from 5 animals). The red and green lines indicate the mean and median values, respectively. (E) Schematic diagram shows the calculation scheme for comparing correlation values between interslice ROIs in lesion condition. Only correlations between corresponding horns (left ventral to left ventral) are included in the quantification. (F) Whisker box plots of r values in three different ROI pair groups: below lesion slices (between slices 4 and5), above lesion slices (between slices 1 and 2), and normal condition (between slices 1 and 2 and 4 and 5). **P < 0.0001 in Mann–Whitney Wilcoxon test.
Fig. 5.
Fig. 5.
Schematic illustration of the changes of functional connectivity between intra- and interslice ROIs after unilateral dorsal column lesion. (A) Functional connectivity patterns among horns within (intraslice) and across (interslice) imaging slices. The thickness (3 mm) of each slice approximately equals to the thickness of the single spinal cord segment. Green dots, dorsal horns; red dots, ventral horns. Black arrows indicate the functional connections, with thicker lines (ventral to dorsal) showing stronger connectivity. L, left side (lesion side); R, right side. (B) Altered functional connection patterns after unilateral lesion of the spinal cord gray and white matters. Gray shadow indicates the lesion. Dotted arrow lines indicate the weakened functional connectivity between different pairs of ROIs. Red asterisks represent the statistical significance level of the changes. Experimental results supporting the weakened ventral–dorsal horn connections (orange dotted lines) are presented in Fig. S2. *P < 0.01. d, dorsal; v, ventral. L, left; R, right.

Similar articles

Cited by

References

    1. Biswal B, Yetkin FZ, Haughton VM, Hyde JS. Functional connectivity in the motor cortex of resting human brain using echo-planar MRI. Magn Reson Med. 1995;34(4):537–541. - PubMed
    1. Fox MD, Corbetta M, Snyder AZ, Vincent JL, Raichle ME. Spontaneous neuronal activity distinguishes human dorsal and ventral attention systems. Proc Natl Acad Sci USA. 2006;103(26):10046–10051. - PMC - PubMed
    1. Fox MD, Greicius M. Clinical applications of resting state functional connectivity. Front Syst Neurosci. 2010;4:19. - PMC - PubMed
    1. Vincent JL, et al. Intrinsic functional architecture in the anaesthetized monkey brain. Nature. 2007;447(7140):83–86. - PubMed
    1. Wang Z, et al. The relationship of anatomical and functional connectivity to resting-state connectivity in primate somatosensory cortex. Neuron. 2013;78(6):1116–1126. - PMC - PubMed

Publication types

LinkOut - more resources