. 2015 May 5;112(18):5785-90.
doi: 10.1073/pnas.1421197112. Epub 2015 Apr 22.

Head-to-head antisense transcription and R-loop formation promotes transcriptional activation

Affiliations

Head-to-head antisense transcription and R-loop formation promotes transcriptional activation

Raquel Boque-Sastre et al. Proc Natl Acad Sci U S A. .

Abstract

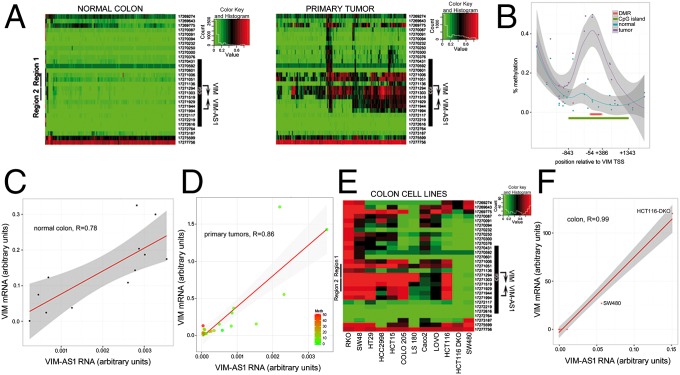
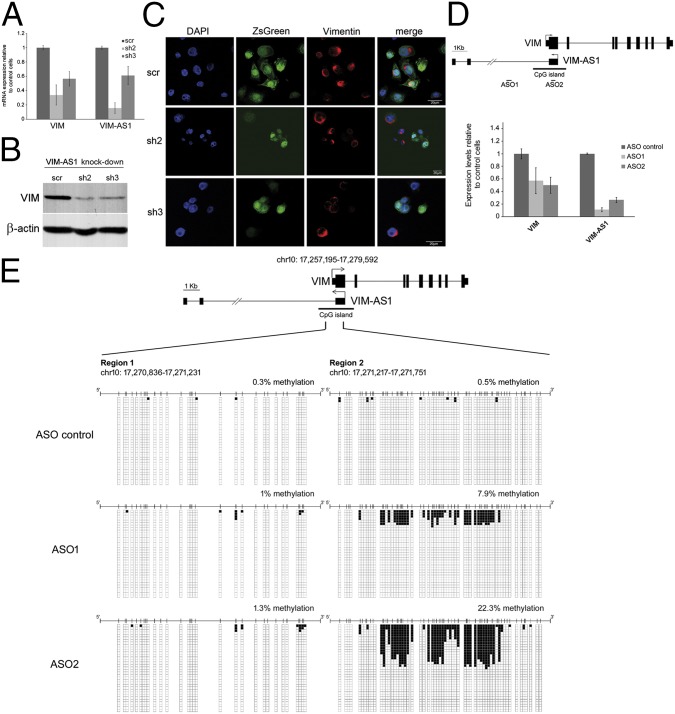
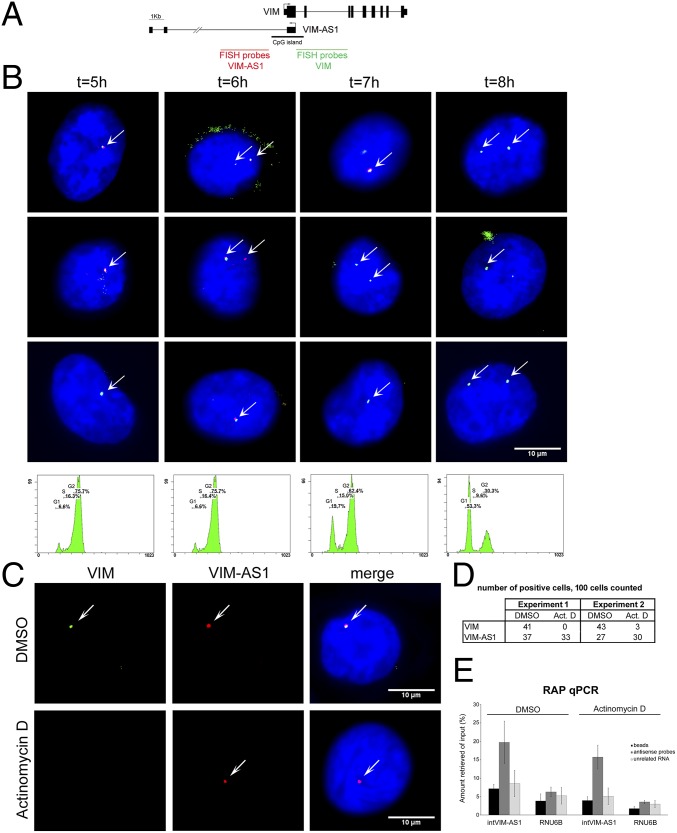
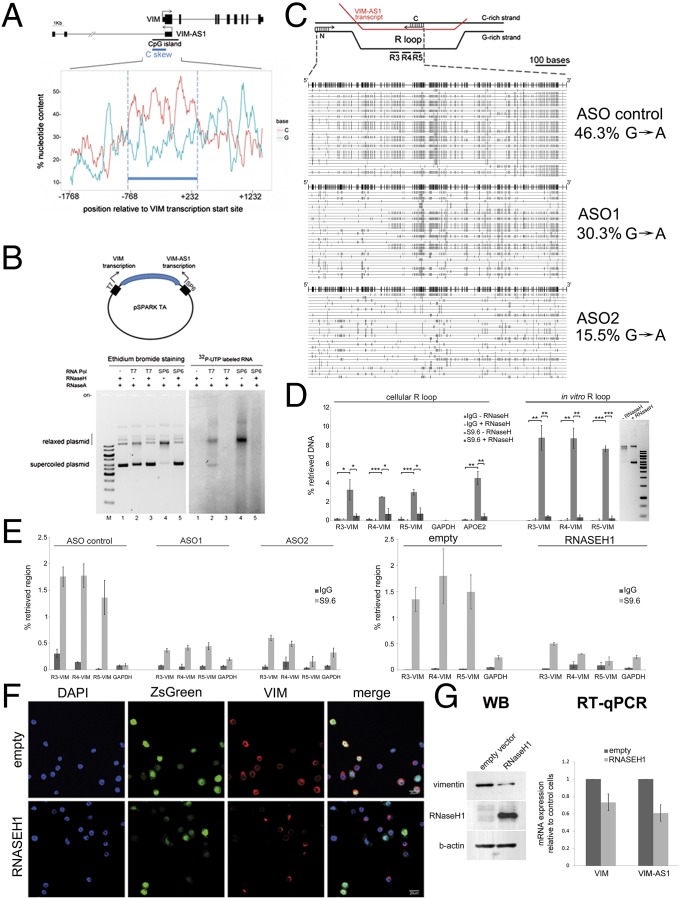
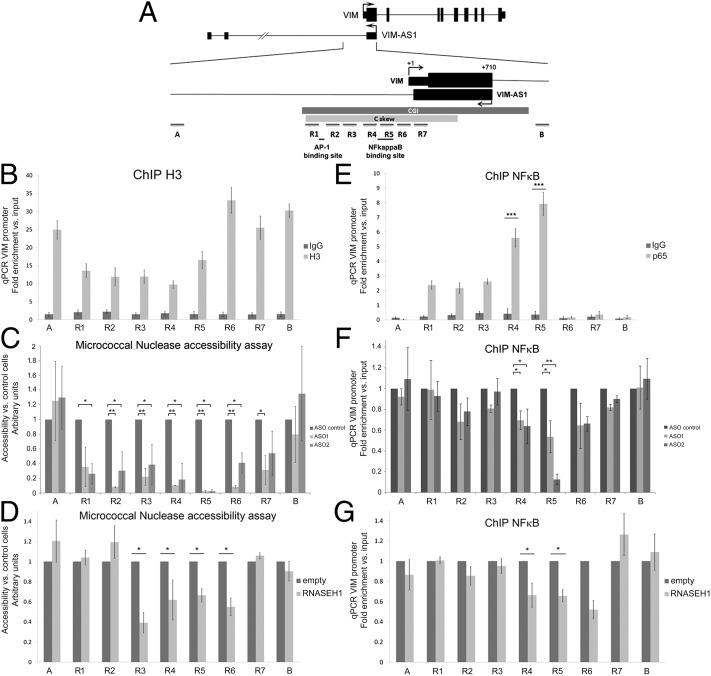
The mechanisms used by antisense transcripts to regulate their corresponding sense mRNAs are not fully understood. Herein, we have addressed this issue for the vimentin (VIM) gene, a member of the intermediate filament family involved in cell and tissue integrity that is deregulated in different types of cancer. VIM mRNA levels are positively correlated with the expression of a previously uncharacterized head-to-head antisense transcript, both transcripts being silenced in colon primary tumors concomitant with promoter hypermethylation. Furthermore, antisense transcription promotes formation of an R-loop structure that can be disfavored in vitro and in vivo by ribonuclease H1 overexpression, resulting in VIM down-regulation. Antisense knockdown and R-loop destabilization both result in chromatin compaction around the VIM promoter and a reduction in the binding of transcriptional activators of the NF-κB pathway. These results are the first examples to our knowledge of R-loop-mediated enhancement of gene expression involving head-to-head antisense transcription at a cancer-related locus.

Keywords: DNA methylation; R loop; antisense transcription; nucleosome occupancy; vimentin.


Conflict of interest statement

The authors declare no conflict of interest.

Figures

Fig. 1.
Fig. 1.
VIM-AS1 is a nuclear, polyadenylated transcript running head-to-head with VIM transcript. (A, Upper) Intronic/exonic organization of vimentin (VIM) and its antisense VIM-AS1 transcripts. Coordinates are given relative to the canonical VIM TSS and the UCSC Gene data bank (uc001iot.2) for VIM-AS1 (release hg19). (A, Lower) End-point RT-PCR from normal colon mucosa total RNA with strand-specific primers. Reverse transcription was carried out either with specific reverse primers (“R,” lanes 1–3) or with forward primers (“F,” lanes 4–6). (B, Upper) VIM-AS1 RNA transcript is polyadenylated. (B, Lower) polyA+/polyA- partition of total RNA from SW480 cells analyzed by RT-qPCR. (C) Nuclear/cytoplasmic fractionation of SW480 cells, analyzed by RT-qPCR and Western blot to assess fraction purity.
Fig. 2.
Fig. 2.
Sense/antisense transcripts are coordinately expressed in normal and tumor colon samples and inversely correlated with DNA methylation. (A) Heatmap representation of a DNA methylation microarray analysis of 120 human normal colon mucosae and 120 tumor samples. (B) Percentage methylation levels of individual CpG sites contained in the 450k array, averaged by class (normal/tumor). The position of the CGI is indicated (green line), and the differentially methylated region defined in C. (C and D) Positive Pearson's correlation coefficients between VIM (y axis) and VIM-AS1 (x axis) expression for normal and tumor colon samples. For primary tumors, the color code indicates methylation levels assessed by bisulfite sequencing. (E) Heatmap representation of a DNA methylation microarray analysis of 12 human colorectal adenocarcinoma cell lines. (F) Pearson's correlation coefficients between VIM and VIM-AS1 expression for all colon cell lines shown in E.
Fig. 3.
Fig. 3.
VIM-AS1 transcript knockdown results in VIM silencing with an effect on promoter CGI methylation. SW480 cells were transduced with lentiviral plasmids overexpressing control shRNA (scr) or shRNAs against VIM-AS1 RNA (sh2, sh3). (A) RT-qPCR analysis of VIM and VIM-AS1 RNAs. (B) Western blot to measure vimentin protein levels in the same transduced cells. (C) Immunofluorescence detection of endogenous vimentin. (D) LNA-based antisense oligonucleotides gapmers (ASOs) targeting intron 1 (ASO1) or exon 1 (ASO2) of VIM-AS1 transcript were transfected into SW480 cells and expression levels measured by RT-qPCR. (E) Bisulfite sequencing of regions 1 and 2 within VIM promoter CGI.
Fig. 4.
Fig. 4.
RNA FISH detection shows enrichment of antisense transcription during G2 phase and intronic stability following actinomycin D treatment. (A) RNA FISH probe design. (B) MCF10A cells were synchronized and released, fixed at the indicated times and stained for RNA FISH (VIM intron 1 is in green and VIM-AS1 intron 1 is in red) or analyzed for DNA content by fluorescence-activated cell sorting (FACS) (Upper and Lower). (C) RNA FISH in control (DMSO-treated) or actinomycin D-treated MCF10A cells. (D) RNA FISH signal was counted in 100 randomly selected cells. (E) Quantitative PCR (qPCR) of the DNA captured in crosslinked MCF10A cells treated as in C, using streptavidin beads alone (beads), with antisense probes to VIM-AS1 intron 1 (antisense probes) or against the LINC00085 RNA (unrelated RNA). Enrichments represent means from two replicate experiments and are relative to the input amount used per pulldown. RNU6B is used as negative control to assess binding specificity.
Fig. 5.
Fig. 5.
VIM-AS1 RNA forms an R-loop structure whose disruption represses VIM transcription in SW480 cells. (A) Percentage of C and G nucleotides in the VIM promoter reveals the presence of a C skew region (thick blue line). For each position on the DNA plus strand, the percentage abundance of each nucleotide within the surrounding 100 nt is counted, with a sliding window of 1 nt. (B) In vitro R loop formation assay indicates participation of the VIM-AS1 transcript. (C) In vivo detection of R loop formation within the C skew region. (Upper) The diagram depicts the RNA:DNA hybrid and the displaced, single-stranded, minus DNA strand. (Lower) PCR amplification and sequencing of 30 clones corresponding to the first half of the C skew-containing region under different ASO treatment. The upper reference line depicts every G position (vertical lines), and every G-to-A change on the plus strand of the sequenced clones is indicated in light gray by a vertical line. Of the 30 clones represented, 23, 29, and 26 (for ASO control, ASO1 and ASO2, respectively) correspond to unique patterns. (D) DRIP with the S9.6 antibody. Signal intensity is presented relative to the input DNA. Three different amplicons (R3, R4, R5, shown in C) were measured. GAPDH and APOE promoters were analyzed as negative and positive controls, respectively. *P < 0.05; **P < 0.01; ***P < 0.001. (E) DRIP experiments under ASO treatment (Left), or overexpression of RNASEH1 (Right). The same genomic regions as in D were analyzed. (F) Immunofluorescence detection of endogenous vimentin (red) in cells overexpressing RNASEH1 (green). (G, Left) Western blot of total protein extracts from RNASEH1-positive cells (enriched by FACS). (Right) RT-qPCR of total RNA extracted from the pool of transfected cells.
Fig. 6.
Fig. 6.
Disruption of antisense transcription and R-loop formation results in chromatin compaction and loss of NF-κB binding in the VIM gene promoter. (A) Fragments analyzed by qPCR in the VIM promoter. (B) Chromatin immunoprecipitation experiments with histone H3 antibody (H3) and control antibody (IgG) in SW480 cells. (C) Micrococcal nuclease accessibility assay on nuclei isolated from ASO-treated SW480 cells. (D) As in C, but comparing overexpression of RNASEH1 with empty vector. (E) Chromatin immunoprecipitation experiments with p65/RelA antibody or control (IgG) antibody in SW480 cells. (F) As in E, in ASO-treated cells. Levels were calculated relative to control samples. (G) As in F, but comparing overexpression of RNASEH1 with control-transfected cells. Throughout the figure, *P < 0.05; **P < 0.01; ***P < 0.005 from Student's t test.

References

    1. Lee JT. Epigenetic regulation by long noncoding RNAs. Science. 2012;338(6113):1435–1439. - PubMed
    1. Morris KV, Mattick JS. The rise of regulatory RNA. Nat Rev Genet. 2014;15(6):423–437. - PMC - PubMed
    1. Magistri M, Faghihi MA, St Laurent G, 3rd, Wahlestedt C. Regulation of chromatin structure by long noncoding RNAs: Focus on natural antisense transcripts. Trends Genet. 2012;28(8):389–396. - PMC - PubMed
    1. Lai F, et al. Activating RNAs associate with Mediator to enhance chromatin architecture and transcription. Nature. 2013;494(7438):497–501. - PMC - PubMed
    1. Kang Y, Massagué J. Epithelial-mesenchymal transitions: Twist in development and metastasis. Cell. 2004;118(3):277–279. - PubMed

Publication types

MeSH terms