

The amplification of risk in experimental diffusion chains
- PMID: 25902519
- PMCID: PMC4426405
- DOI: 10.1073/pnas.1421883112
The amplification of risk in experimental diffusion chains
Abstract
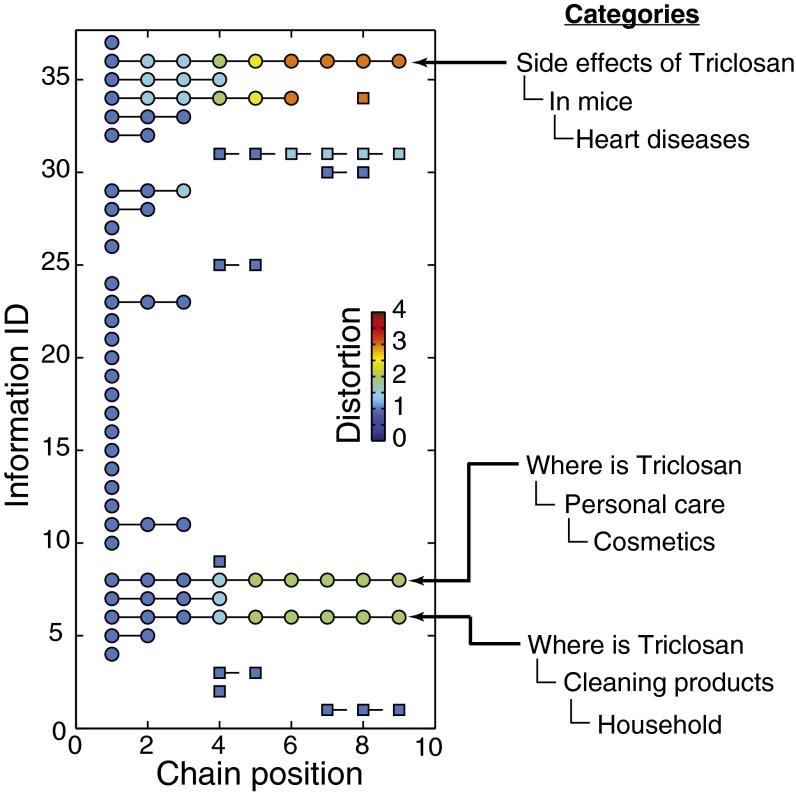
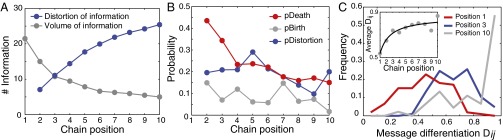
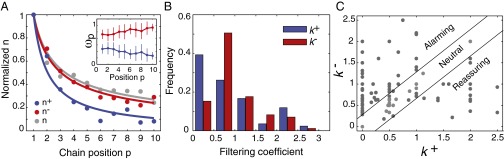
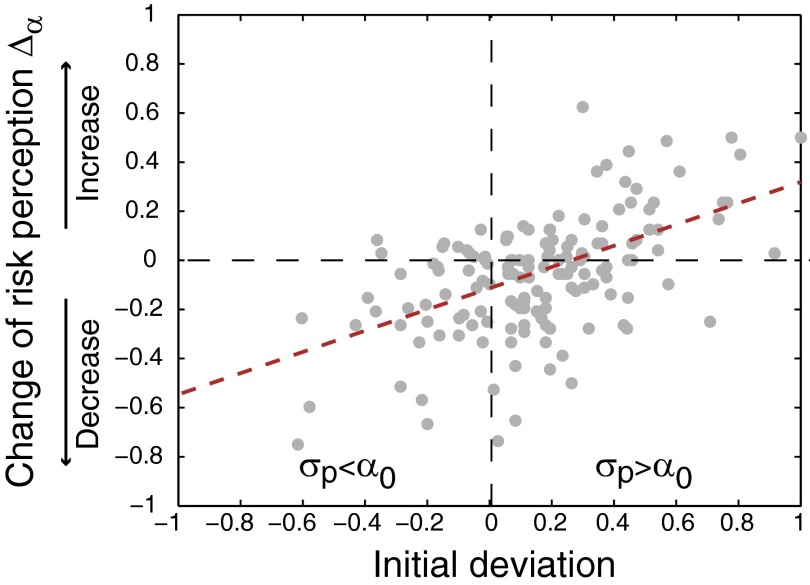
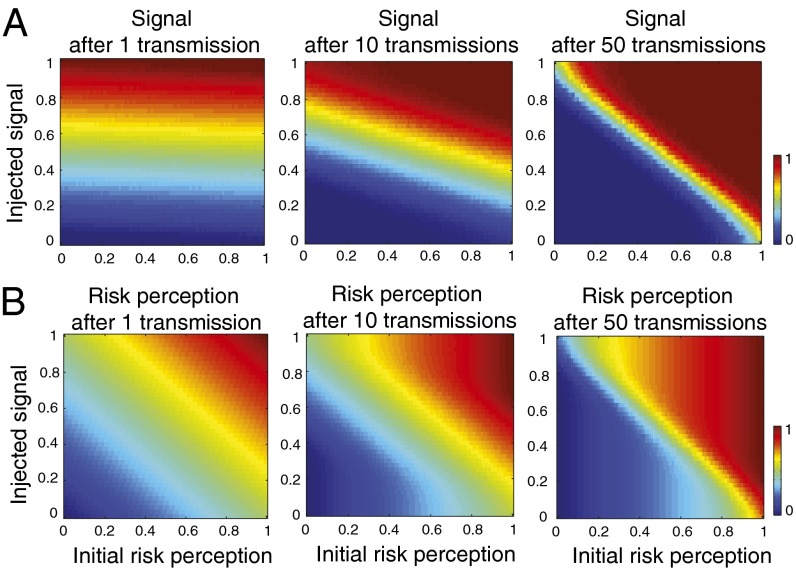
Understanding how people form and revise their perception of risk is central to designing efficient risk communication methods, eliciting risk awareness, and avoiding unnecessary anxiety among the public. However, public responses to hazardous events such as climate change, contagious outbreaks, and terrorist threats are complex and difficult-to-anticipate phenomena. Although many psychological factors influencing risk perception have been identified in the past, it remains unclear how perceptions of risk change when propagated from one person to another and what impact the repeated social transmission of perceived risk has at the population scale. Here, we study the social dynamics of risk perception by analyzing how messages detailing the benefits and harms of a controversial antibacterial agent undergo change when passed from one person to the next in 10-subject experimental diffusion chains. Our analyses show that when messages are propagated through the diffusion chains, they tend to become shorter, gradually inaccurate, and increasingly dissimilar between chains. In contrast, the perception of risk is propagated with higher fidelity due to participants manipulating messages to fit their preconceptions, thereby influencing the judgments of subsequent participants. Computer simulations implementing this simple influence mechanism show that small judgment biases tend to become more extreme, even when the injected message contradicts preconceived risk judgments. Our results provide quantitative insights into the social amplification of risk perception, and can help policy makers better anticipate and manage the public response to emerging threats.
Keywords: collective behavior; diffusion chains; opinion dynamics; risk perception; social transmission.
Conflict of interest statement
The authors declare no conflict of interest.
Figures
Similar articles
-
Reach and speed of judgment propagation in the laboratory.Proc Natl Acad Sci U S A. 2017 Apr 18;114(16):4117-4122. doi: 10.1073/pnas.1611998114. Epub 2017 Apr 3. Proc Natl Acad Sci U S A. 2017. PMID: 28373540 Free PMC article.
-
Opinion formation and the collective dynamics of risk perception.PLoS One. 2013 Dec 30;8(12):e84592. doi: 10.1371/journal.pone.0084592. eCollection 2013. PLoS One. 2013. PMID: 24386398 Free PMC article.
-
Bad News Has Wings: Dread Risk Mediates Social Amplification in Risk Communication.Risk Anal. 2018 Oct;38(10):2193-2207. doi: 10.1111/risa.13117. Epub 2018 May 29. Risk Anal. 2018. PMID: 29813185
-
Triclosan.Dermatitis. 2006 Dec;17(4):204-7. Dermatitis. 2006. PMID: 17150172 Review.
-
Evolution of diffusion and dissemination theory.J Public Health Manag Pract. 2008 Mar-Apr;14(2):99-108. doi: 10.1097/01.PHH.0000311886.98627.b7. J Public Health Manag Pract. 2008. PMID: 18287914 Review.
Cited by
-
Social Media Overload and Anxiety Among University Students During the COVID-19 Omicron Wave Lockdown: A Cross-Sectional Study in Shanghai, China, 2022.Int J Public Health. 2023 Jan 10;67:1605363. doi: 10.3389/ijph.2022.1605363. eCollection 2022. Int J Public Health. 2023. PMID: 36703861 Free PMC article.
-
Climate risk expressions of public views and government responses in China.Sci Data. 2025 May 27;12(1):877. doi: 10.1038/s41597-025-05207-1. Sci Data. 2025. PMID: 40425602 Free PMC article.
-
Humans create more novelty than ChatGPT when asked to retell a story.Sci Rep. 2024 Jan 9;14(1):875. doi: 10.1038/s41598-023-50229-7. Sci Rep. 2024. PMID: 38195660 Free PMC article.
-
Reach and speed of judgment propagation in the laboratory.Proc Natl Acad Sci U S A. 2017 Apr 18;114(16):4117-4122. doi: 10.1073/pnas.1611998114. Epub 2017 Apr 3. Proc Natl Acad Sci U S A. 2017. PMID: 28373540 Free PMC article.
-
Virtual Sensing and Virtual Reality: How New Technologies Can Boost Research on Crowd Dynamics.Front Robot AI. 2018 Jul 13;5:82. doi: 10.3389/frobt.2018.00082. eCollection 2018. Front Robot AI. 2018. PMID: 33500961 Free PMC article. Review.
References
MeSH terms
Substances
LinkOut - more resources
Full Text Sources
Other Literature Sources
Molecular Biology Databases
Miscellaneous
