

Species fluctuations sustained by a cyclic succession at the edge of chaos
- PMID: 25902520
- PMCID: PMC4443354
- DOI: 10.1073/pnas.1421968112
Species fluctuations sustained by a cyclic succession at the edge of chaos
Abstract
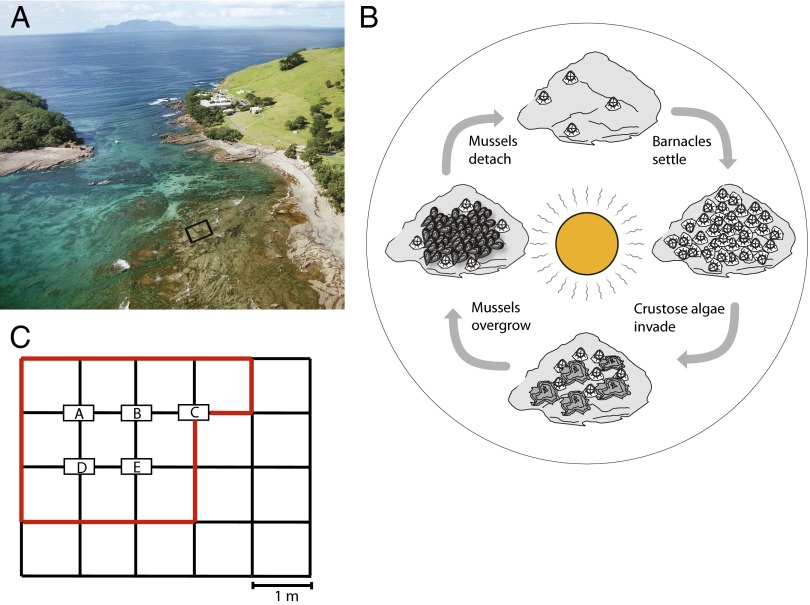
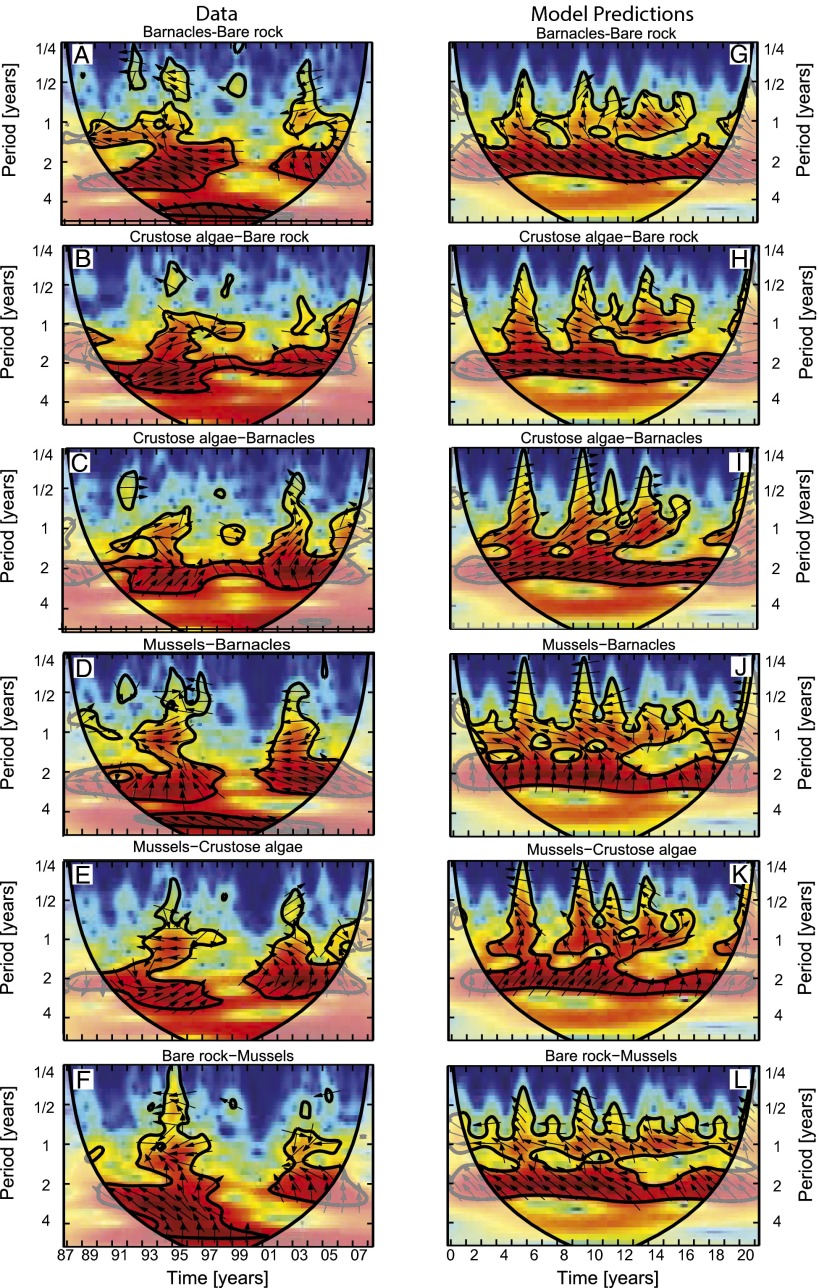
Although mathematical models and laboratory experiments have shown that species interactions can generate chaos, field evidence of chaos in natural ecosystems is rare. We report on a pristine rocky intertidal community located in one of the world's oldest marine reserves that has displayed a complex cyclic succession for more than 20 y. Bare rock was colonized by barnacles and crustose algae, they were overgrown by mussels, and the subsequent detachment of the mussels returned bare rock again. These processes generated irregular species fluctuations, such that the species coexisted over many generations without ever approaching a stable equilibrium state. Analysis of the species fluctuations revealed a dominant periodicity of about 2 y, a global Lyapunov exponent statistically indistinguishable from zero, and local Lyapunov exponents that alternated systematically between negative and positive values. This pattern indicates that the community moved back and forth between stabilizing and chaotic dynamics during the cyclic succession. The results are supported by a patch-occupancy model predicting similar patterns when the species interactions were exposed to seasonal variation. Our findings show that natural ecosystems can sustain continued changes in species abundances and that seasonal forcing may push these nonequilibrium dynamics to the edge of chaos.
Keywords: chaos; coexistence; cyclic succession; rocky intertidal community; rock–paper–scissors dynamics.
Conflict of interest statement
The authors declare no conflict of interest.
Figures


Comment in
-
Nonlinearity and chaos in ecological dynamics revisited.Proc Natl Acad Sci U S A. 2015 May 19;112(20):6252-3. doi: 10.1073/pnas.1507708112. Epub 2015 May 11. Proc Natl Acad Sci U S A. 2015. PMID: 25964347 Free PMC article. No abstract available.
References
-
- Egerton FN. Changing concepts of the balance of nature. Q Rev Biol. 1973;48(2):322–350.
-
- Zimmerman C, Cuddington K. Ambiguous, circular and polysemous: Students’ definitions of the “balance of nature” metaphor. Public Underst Sci. 2007;16(4):393–406.
-
- Elton CS. Animal Ecology and Evolution. Clarendon; Oxford: 1930.
-
- Pimm SL. The Balance of Nature? Ecological Issues in the Conservation of Species and Communities. Univ of Chicago Press; Chicago: 1991.
-
- Benincà E, et al. Chaos in a long-term experiment with a plankton community. Nature. 2008;451(7180):822–825. - PubMed
Publication types
MeSH terms
LinkOut - more resources
Full Text Sources
Other Literature Sources
