

Low TGFβ1 expression prevents and high expression exacerbates diabetic nephropathy in mice
- PMID: 25902541
- PMCID: PMC4426439
- DOI: 10.1073/pnas.1504777112
Low TGFβ1 expression prevents and high expression exacerbates diabetic nephropathy in mice
Abstract
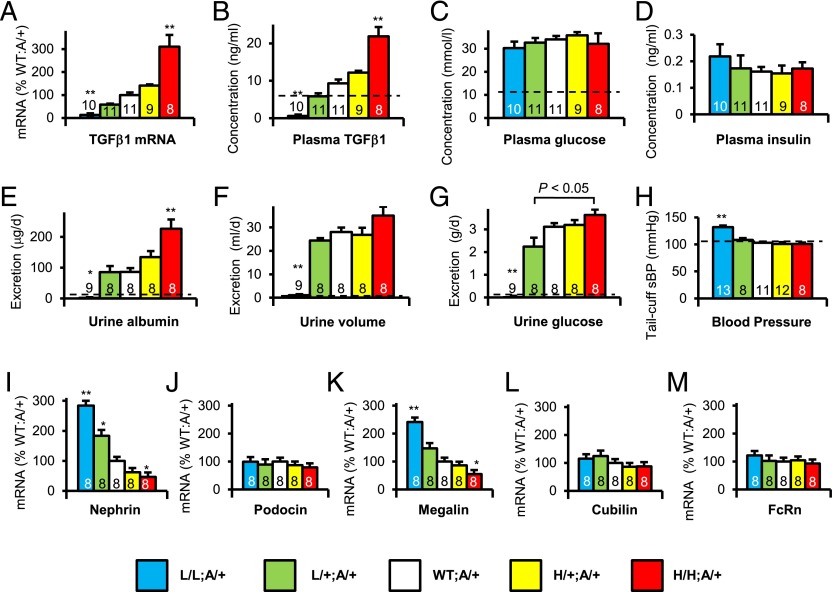
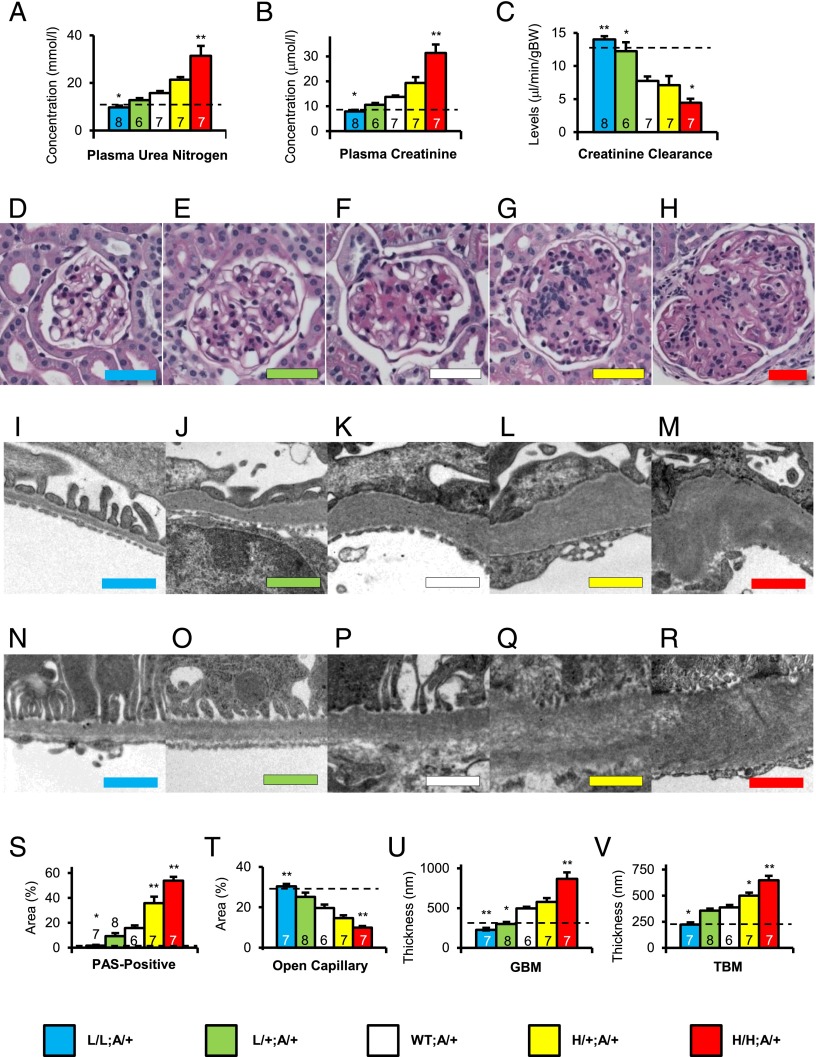
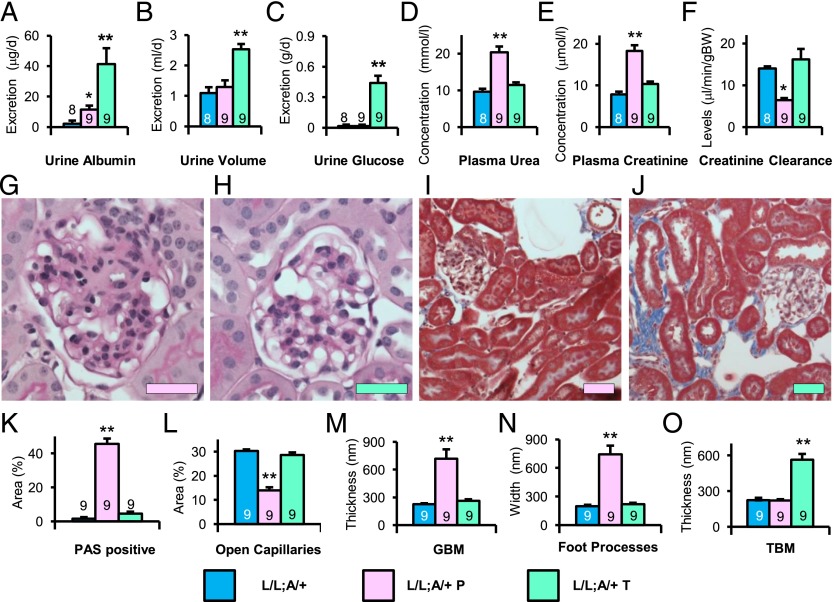
Nephropathy develops in many but not all patients with long-standing type 1 diabetes. Substantial efforts to identify genotypic differences explaining this differential susceptibility have been made, with limited success. Here, we show that the expression of the transforming growth factor β1 gene (Tgfb1) affects the development of diabetic nephropathy in mice. To do this we genetically varied Tgfb1 expression in five steps, 10%, 60%, 100%, 150%, and 300% of normal, in mice with type 1 diabetes caused by the Akita mutation in the insulin gene (Ins2(Akita)). Although plasma glucose levels were not affected by Tgfb1 genotype, many features of diabetic nephropathy (mesangial expansion, elevated plasma creatinine and urea, decreased creatinine clearance and albuminuria) were progressively ameliorated as Tgfb1 expression decreased and were progressively exacerbated when expression was increased. The diabetic 10% hypomorphs had comparable creatinine clearance and albumin excretion to wild-type mice and no harmful changes in renal morphology. The diabetic 300% hypermorphs had ∼1/3 the creatinine clearance of wild-type mice, >20× their albumin excretion, ∼3× thicker glomerular basement membranes and severe podocyte effacement, matching human diabetic nephropathy. Switching Tgfb1 expression from low to high in the tubules of the hypomorphs increased their albumin excretion more than 10-fold but creatinine clearance remained high. Switching Tgfb1 expression from low to high in the podocytes markedly decreased creatinine clearance, but minimally increased albumin excretion. Decreasing expression of Tgfb1 could be a promising option for preventing loss of renal function in diabetes.
Keywords: aldosterone; glomerular filtration rate; glomerulosclerosis; megalin; nephrin.
Conflict of interest statement
The authors declare no conflict of interest.
Figures
Similar articles
-
Hedgehog Interacting Protein Promotes Fibrosis and Apoptosis in Glomerular Endothelial Cells in Murine Diabetes.Sci Rep. 2018 Apr 13;8(1):5958. doi: 10.1038/s41598-018-24220-6. Sci Rep. 2018. PMID: 29654303 Free PMC article.
-
Schisandra chinensis fruit extract attenuates albuminuria and protects podocyte integrity in a mouse model of streptozotocin-induced diabetic nephropathy.J Ethnopharmacol. 2012 May 7;141(1):111-8. doi: 10.1016/j.jep.2012.02.007. Epub 2012 Feb 14. J Ethnopharmacol. 2012. PMID: 22353431
-
High Elmo1 expression aggravates and low Elmo1 expression prevents diabetic nephropathy.Proc Natl Acad Sci U S A. 2016 Feb 23;113(8):2218-22. doi: 10.1073/pnas.1600511113. Epub 2016 Feb 8. Proc Natl Acad Sci U S A. 2016. PMID: 26858454 Free PMC article.
-
Transforming growth factor-β1 and diabetic nephropathy.Am J Physiol Renal Physiol. 2016 Apr 15;310(8):F689-F696. doi: 10.1152/ajprenal.00502.2015. Epub 2015 Dec 30. Am J Physiol Renal Physiol. 2016. PMID: 26719364 Free PMC article. Review.
-
Angiopoietins and diabetic nephropathy.Diabetologia. 2016 Aug;59(8):1616-20. doi: 10.1007/s00125-016-3995-3. Epub 2016 May 20. Diabetologia. 2016. PMID: 27207083 Free PMC article. Review.
Cited by
-
Podocytes: the Weakest Link in Diabetic Kidney Disease?Curr Diab Rep. 2016 May;16(5):45. doi: 10.1007/s11892-016-0735-5. Curr Diab Rep. 2016. PMID: 27053072 Free PMC article. Review.
-
High glucose/lysophosphatidylcholine levels stimulate extracellular matrix deposition in diabetic nephropathy via platelet‑activating factor receptor.Mol Med Rep. 2018 Feb;17(2):2366-2372. doi: 10.3892/mmr.2017.8102. Epub 2017 Nov 20. Mol Med Rep. 2018. PMID: 29207067 Free PMC article.
-
LRG1 loss effectively restrains glomerular TGF-β signaling to attenuate diabetic kidney disease.Mol Ther. 2024 Sep 4;32(9):3177-3193. doi: 10.1016/j.ymthe.2024.06.027. Epub 2024 Jun 22. Mol Ther. 2024. PMID: 38910328
-
TGF-Beta as a Master Regulator of Diabetic Nephropathy.Int J Mol Sci. 2021 Jul 23;22(15):7881. doi: 10.3390/ijms22157881. Int J Mol Sci. 2021. PMID: 34360646 Free PMC article. Review.
-
Restoration of Megalin-Mediated Clearance of Alveolar Protein as a Novel Therapeutic Approach for Acute Lung Injury.Am J Respir Cell Mol Biol. 2017 Nov;57(5):589-602. doi: 10.1165/rcmb.2016-0358OC. Am J Respir Cell Mol Biol. 2017. PMID: 28678521 Free PMC article.
References
-
- Susztak K, Raff AC, Schiffer M, Böttinger EP. Glucose-induced reactive oxygen species cause apoptosis of podocytes and podocyte depletion at the onset of diabetic nephropathy. Diabetes. 2006;55(1):225–233. - PubMed
-
- Zeisberg M, et al. BMP-7 counteracts TGF-beta1-induced epithelial-to-mesenchymal transition and reverses chronic renal injury. Nat Med. 2003;9(7):964–968. - PubMed
Publication types
MeSH terms
Substances
Grants and funding
LinkOut - more resources
Full Text Sources
Other Literature Sources
Medical
Molecular Biology Databases
Miscellaneous
