. 2015 Jul 10;290(28):17056-72.
doi: 10.1074/jbc.M115.645739. Epub 2015 Apr 22.

Rac-mediated Stimulation of Phospholipase Cγ2 Amplifies B Cell Receptor-induced Calcium Signaling

Affiliations

Rac-mediated Stimulation of Phospholipase Cγ2 Amplifies B Cell Receptor-induced Calcium Signaling

Claudia Walliser et al. J Biol Chem. .

Abstract

The Rho GTPase Rac is crucially involved in controlling multiple B cell functions, including those regulated by the B cell receptor (BCR) through increased cytosolic Ca(2+). The underlying molecular mechanisms and their relevance to the functions of intact B cells have thus far remained unknown. We have previously shown that the activity of phospholipase Cγ2 (PLCγ2), a key constituent of the BCR signalosome, is stimulated by activated Rac through direct protein-protein interaction. Here, we use a Rac-resistant mutant of PLCγ2 to functionally reconstitute cultured PLCγ2-deficient DT40 B cells and to examine the effects of the Rac-PLCγ2 interaction on BCR-mediated changes of intracellular Ca(2+) and regulation of Ca(2+)-regulated and nuclear-factor-of-activated-T-cell-regulated gene transcription at the level of single, intact B cells. The results show that the functional Rac-PLCγ2 interaction causes marked increases in the following: (i) sensitivity of B cells to BCR ligation; (ii) BCR-mediated Ca(2+) release from intracellular stores; (iii) Ca(2+) entry from the extracellular compartment; and (iv) nuclear translocation of the Ca(2+)-regulated nuclear factor of activated T cells. Hence, Rac-mediated stimulation of PLCγ2 activity serves to amplify B cell receptor-induced Ca(2+) signaling.

Keywords: B cell; Rac (Rac GTPase); calcium; lymphocyte; phospholipase C; signal amplification; signal transduction.


Figures

FIGURE 1.
FIGURE 1.
PLCγ2 mutant F897Q is resistant to stimulation by activated Rac2 in intact cells and in a cell-free system. A, changes in the conformations of the PLCγ2-interacting surface of Rac2 upon activation of Rac2 with GTPγS (gray) and of the PLCγ2 spPH residue Phe-897 upon interaction with activated Rac2. The hydrophobic Rac2 residues that change their positions upon Rac2 activation and interact with PLCγ2 spPH are shown in white (GDP-liganded Rac2) versus red (GTPγS-liganded Rac2). Phe-897 displays flexibility in the known structures of the free spPH domain and adopts two conformations (I and II, pale yellow) (25). This flexibility is stabilized in the complex with activated Rac2 (wheat). The side chain of the polar residue Gln in the F897Q mutant (light blue) is likely to collide with the hydrophobic side chain of Rac2 Leu-67. The structures correspond to database entries 2W2T, 2W2V, 2W2W, and 2W2X (25). The position of Gln-897 was predicted in Swiss-Model. B, COS-7 cells were cotransfected with 1 μg/well of vector encoding either WT PLCγ2 (WT) or its F897Q mutant (F897Q) together with either empty vector (Mock) or with 10 ng/well of vector encoding Rac2 (Rac2) or its constitutively active mutant Rac2G12V (Rac2G12V). Inositol phosphate formation was measured as described under “Experimental Procedures” (upper panel). Cells from one well each were analyzed by SDS-PAGE and immunoblotting (lower panel). C, left panel, soluble fractions of Sf9 cells infected with baculoviruses encoding β-galactosidase (Control), WT PLCγ2 (WT), or its Phe-897 mutant (F897Q) were incubated with phospholipid vesicles containing [3H]PtdInsP2. Right panel, soluble fractions of baculovirus-infected Sf9 cells were adjusted to contain similar basal PLC activity according to the left panel. Aliquots (10 μl) of these samples were reconstituted with aliquots of detergent extracts prepared from membranes of Sf9 cells infected with baculoviruses encoding either β-galactosidase or Rac2 and incubated in the presence of 100 μm GDP or GTPγS with phospholipid vesicles containing [3H]PtdInsP2. Inset, aliquots (10 μl) of the samples were subjected to SDS-PAGE and immunoblotting. Lane 1, control; lane 2, WT, lane 3, F897Q. D, wild-type and F897Q mutant PLCγ2 are similarly sensitive to activation by Ca2+. Aliquots of the soluble fractions of baculovirus-infected Sf9 cells were incubated at increasing concentrations of free Ca2+ with phospholipid vesicles containing [3H]PtdInsP2. For both wild-type and F897Q mutant PLCγ2, half-maximal and maximal stimulatory effects were observed at ∼140 nm and 10 μm free Ca2+. E, PLCγ2 variants ΔPCIWT and ΔPCIF897Q lacking the PCI peptide have similar constitutive activities but show a striking difference in their sensitivity to Rac2. Tyrosine phosphorylation-induced activation of PLCγ is mediated by removal of intramolecular autoinhibition caused by an octapeptide (726YRKMRLRY in human PLCγ2; PCI) within the C-terminal Src homology domain contained in the Src homology domain tandem between the two catalytic subdomains X and Y. Deletion of the PCI peptide causes activation of PLCγ2 (88). Upper left panel, COS-7 cells were transfected with increasing amounts of vector encoding ΔPCIWT or ΔPCIF897Q or with a single amount (1000 ng) of vector encoding either wild-type PLCγ2 or its F897Q mutant. Upper right panel, COS-7 cells were cotransfected with vectors encoding either of the ΔPCI variants together with empty vector (Mock) or with 50 ng/well of vector encoding Rac2 or Rac2G12V. Lower panel, expression of wild-type and mutant PLCγ2 isozymes in upper left panel. Cells from one well each were analyzed by SDS-PAGE and immunoblotting. F, wild-type and the F897Q mutant PLCγ2 do not differ in their ability to be tyrosine-phosphorylated by treatment of DT40 cells with H2O2. PLCγ2 phosphorylation in PLCγ2−/− DT40 cells stably transfected with wild-type or the F897Q mutant PLCγ2 was analyzed in the absence (−) or presence (+) of H2O2. PLCγ2 was immunoprecipitated from cell extracts using anti-c-Myc antibody, and Western blotting was performed with either anti-phosphotyrosine (pY) antibody (top panel) or anti-c-Myc antibody (bottom panel).
FIGURE 2.
FIGURE 2.
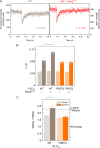
FRAP beam size analysis demonstrates that wild-type and F897Q mutant PLCγ2 display similar membrane interactions, but only that of wild-type PLCγ2 is augmented by Rac2G12V. A, COS-7 cells were cotransfected with a vector encoding GFP-tagged wild-type PLCγ2 (WT) together with either empty vector (left panel) or vector encoding Rac2G12V (WT + Rac2G12V; right panel). The typical FRAP curves shown were obtained using a ×63 objective. The solid lines represent the best fit obtained by nonlinear regression analysis. The best fit τ values are depicted in each panel. The mobile fractions (Rf) were above 0.93 in all cases and therefore are not shown. B and C, FRAP beam size analysis. Transfection was as in A, except that in some studies the GFP-tagged mutant (F897Q) replaced its wild-type counterpart (WT). Bars represent the means ± S.E. of 30–60 measurements. The studies employed ×40 and ×63 objectives, yielding a beam size ratio of 2.28 ± 0.17 (n = 59). Thus, this τ(×40)/τ(×63) ratio is expected for FRAP by lateral diffusion (C, upper dashed line). A τ ratio of 1 (C, lower dotted line) indicates recovery by exchange (35). In the absence of Rac2G12V, both the τ values (comparing values measured with the same beam size (B) and the τ(×40)/τ(×63) ratios (C) of WT and F897Q mutant PLCγ2 were similar (p > 0.4 in all cases; Student's t test), suggesting similar lateral diffusion in and exchange rate from the plasma membrane. Although coexpression of Rac2G12V had no significant effect on either the τ values or τ ratio of the F897Q mutant (p > 0.4), it significantly enhanced the membrane association of wild-type PLCγ2, reflected in a slower τ(×40) (**, p < 0.002) and in a significant increase of its τ ratio (*, p < 0.02; bootstrap analysis) from an intermediate value (characterizing recovery by a mixture of lateral diffusion and exchange) to 2.3, similar to the value expected for pure lateral diffusion.
FIGURE 3.
FIGURE 3.
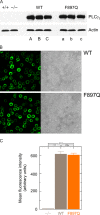
Stable reconstitution of PLCγ2−/− DT40 B cells with wild-type versus F897Q mutant PLCγ2. PLCγ2-deficient DT40 cells (89) were stably reconstituted with either isogenic wild-type or F897Q mutant PLCγ2. A, aliquots of the lysates (50 μg of protein) of native DT40 cells (PLCγ2+/+), PLCγ2-deficient DT40 cells (PLCγ2−/−), and from three independent clones PLCγ2−/− DT40 cells stably expressing similar quantities of either wild-type (A–C) or F897Q mutant PLCγ2 (a–c) were subjected to SDS-PAGE and immunoblotting (upper panel). The same membrane was subsequently probed with an anti-β-actin antibody to control for equal loading of samples (lower panels). All six clones were used for experimentation in this study, with no differences detected between clones A–C and a–c, respectively. B, cells from the clones A and c were analyzed by indirect fluorescence staining (left panels). Right panels, corresponding phase contrast images. C, mean fluorescence intensities of the three images each, as shown in B, were corrected for background staining. Similar results were obtained for other pairs of clones.
FIGURE 4.
FIGURE 4.
Functional reconstitution of B cell receptor-mediated intracellular Ca2+ release and extracellular Ca2+ entry into PLCγ2−/− DT40 B cells. A, normalization of BCR-mediated oscillatory changes in cytosolic Ca2+ in PLCγ2−/− DT40 cells stably expressing wild-type PLCγ2. Left panel, the mean fluorescence intensities monitored inside the three cells selected in supplemental Video S1 and marked in cyan, magenta, and blue were measured on a single-cell level using spinning disc confocal fluorescence microscopy. The right panel shows the same data after correction for basal fluorescence intensity and normalization according to the maximal intensity in the presence of ionomycin. This treatment corrects variations in fluorescent dye loading between cells. The arrowheads indicate the addition of the various extracellular reagents. B, qualitative analysis. Unmodified DT40 cells (panel a; PLCγ2+/+), PLCγ2−/− cells (panel b), PLCγ2−/− cells stably expressing wild-type (panel c), or F897Q mutant PLCγ2 (panel d) (60 cells each) were treated as indicated by arrowheads in the following sequences: 40 ng/ml anti-IgM; no Ca2+ → 40 ng/ml anti-IgM; 1 mm Ca2+ → 4 μm ionomycin; 1 mm Ca2+ in panels a, c, and d, and 400 ng/ml anti-IgM; no Ca2+ → 400 ng/ml anti-IgM; 1 mm Ca2+ → 4 ng/ml trypsin; 1 mm Ca2+ → 4 μm ionomycin; 1 mm Ca2+ in panel b. Insets, snapshots from the corresponding time-lapse image series. C, expression of wild-type PLCγ2 in PLCγ2−/− DT40 cells restores the quantitative features of B cell-receptor-mediated increases in cytosolic Ca2+ to the phenotype observed in wild-type DT40 cells. Top panels, unmodified DT40 cells (PLCγ2+/+) or PLCγ2−/− DT40 cells stably expressing wild-type PLCγ2 (PLCγ2−/− + WT) were sequentially treated as in Fig. 4B, panel a, except that anti-IgM was used at 400 ng/ml. Bottom panels, the intensity traces obtained for both groups of cells were quantitatively analyzed as indicated for the percentage of responding cells, integrated peak intensity, peak frequency, and peak amplitude. A total number of 213 and 196 cells, respectively, was analyzed in three independent experiments (n = 3). D, PLCγ2−/− DT40 cells stably expressing wild-type or F897Q mutant PLCγ2 show similar Ca2+ responses to thapsigargin. PLCγ2−/− cells stably expressing wild-type (left panel) or F897Q mutant PLCγ2 (right panel) (78 cells each) were treated at the times indicated by the arrowheads in the following sequence: 100 nm thapsigargin; no Ca2+ → 100 nm thapsigargin; 1 mm Ca2+ → 4 μm ionomycin; 1 mm Ca2+.
FIGURE 5.
FIGURE 5.
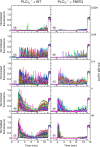
Rac-insensitive mutant PLCγ2F897Q is quantitatively impaired in its ability to restore B cell receptor-mediated Ca2+ flux in PLCγ2−/− DT40 cells. PLCγ2−/− cells stably expressing wild-type (left column) or F897Q mutant PLCγ2 protein (right column) were treated with increasing concentrations of anti-IgM. The treatment was performed as indicated by the arrowheads in the following sequence: anti-IgM; no Ca2+ → anti-IgM; 1 mm Ca2+ → 4 μm ionomycin; 1 mm Ca2+. Forty nine to 60 cells were analyzed in each single experiment.
FIGURE 6.
FIGURE 6.
A, functional interaction of PLCγ2 with activated Rac enhances the proportion of cells responding to BCR ligation with an increase in [Ca2+]i. PLCγ2−/− stably expressing either wild-type or F897Q mutant PLCγ2 were treated in the absence (left panel) or presence (right panel) of 1 mm extracellular Ca2+ with medium supplemented with increasing concentrations of anti-IgM. The data correspond to the means ± S.E. of three independent measurements for each ligand concentration, each performed on 60–80 cells. The best fit values obtained for the EC50 values in A and the corresponding half-maximal proportional Ca2+ responses as well as the EC50 value estimated in the right panel are marked by dashed lines. B and C, functional interaction of PLCγ2 with activated Rac enhances the BCR-mediated increase in integrated Ca2+ fluorescence activity in the absence and in the presence of extracellular Ca2+. PLCγ2−/− stably reconstituted with either WT (left panels) or F897Q mutant of PLCγ2 (right panels) were treated in the absence (B) or presence (C) of 1 mm extracellular Ca2+ with increasing concentrations of anti-IgM. Data obtained for single cells are shown. Nonresponding cells are shown individually below the abscissae. The mean values were fit by nonlinear least squares curve fitting. The standard errors of the best fit values of the maximal intensities are indicated by shading. B, 202, 173, 195, 174, and 185 (WT) and 121, 186, 201, 192, and 196 (F897Q) single cells were analyzed with increasing concentrations of anti-IgM. C, these cell numbers were 201, 174, 195, 173, and 185 (WT) and 121, 187, 200, 191, and 196 (F897Q). D, latency (time between anti-IgM addition and first Ca2+ peak) was plotted as a function of ligand concentration in the absence of extracellular Ca2+. Cells that showed no Ca2+ response during the observation time of 365.1 s were considered to have maximal latency equal to the time of observation. Data are shown as mean ± S.E. of 121–202 values obtained by analysis of all individual traces (corresponding to single cells) from three independent experiments in each group for each ligand concentration. E, peak frequency (left panel) and peak amplitude (right panel) calculated for the cells treated with anti-IgM in concentrations of 4, 40, and 400 ng/ml in the absence of extracellular Ca2+.
FIGURE 7.
FIGURE 7.
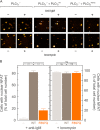
BCR-induced translocation of the transcription factor NFAT1c into the nucleus is dependent on a functional interaction between PLCγ2 and Rac. A, PLCγ2−/− cells or PLCγ2−/− cells stably expressing either wild-type or F897Q mutant PLCγ2 were transiently transfected with a vector encoding NFAT1c-td-RFP611. Adherent cells were treated with either anti-IgM (upper panels) or ionomycin (lower panels). Snapshots were taken of the same visual fields at the beginning of the experiment in the absence of ligand (−) and at the end of each experiment in the presence of the stimulus (+).Examples of visible NFAT1c translocation events are marked by arrowheads. B, quantitative analysis of the data shown. ns, not significant.

References

    1. Kadamur G., Ross E. M. (2013) Mammalian phospholipase C. Annu. Rev. Physiol. 75, 127–154 - PubMed
    1. Sun Y., Thapa N., Hedman A. C., Anderson R. A. (2013) Phosphatidylinositol 4,5-bisphosphate: targeted production and signaling. BioEssays 35, 513–522 - PMC - PubMed
    1. Tedder T. F. (2010) Innate and adaptive receptors interact to balance humoral immunity. J. Immunol. 184, 2231–2232 - PubMed
    1. Rawlings D. J., Schwartz M. A., Jackson S. W., Meyer-Bahlburg A. (2012) Integration of B cell responses through Toll-like receptors and antigen receptors. Nat. Rev. Immunol. 12, 282–294 - PMC - PubMed
    1. de Gorter D. J., Beuling E. A., Kersseboom R., Middendorp S., van Gils J. M., Hendriks R. W., Pals S. T., Spaargaren M. (2007) Bruton's tyrosine kinase and phospholipase Cγ2 mediate chemokine-controlled B cell migration and homing. Immunity 26, 93–104 - PubMed

Publication types

MeSH terms