. 2015 Jul;23(7):1234-1247.
doi: 10.1038/mt.2015.72. Epub 2015 Apr 23.

The Cancer Genome Atlas Analysis Predicts MicroRNA for Targeting Cancer Growth and Vascularization in Glioblastoma

Affiliations

The Cancer Genome Atlas Analysis Predicts MicroRNA for Targeting Cancer Growth and Vascularization in Glioblastoma

Hon-Kit Andus Wong et al. Mol Ther. 2015 Jul.

Abstract

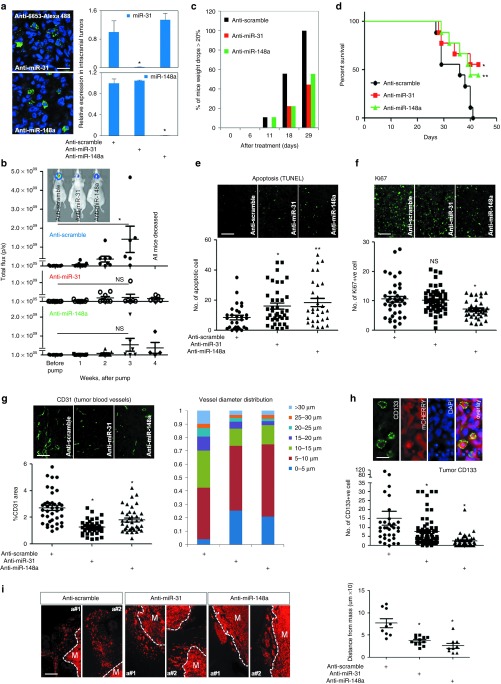
Using in silico analysis of The Cancer Genome Atlas (TCGA), we identified microRNAs associated with glioblastoma (GBM) survival, and predicted their functions in glioma growth and progression. Inhibition of two "risky" miRNAs, miR-148a and miR-31, in orthotopic xenograft GBM mouse models suppressed tumor growth and thereby prolonged animal survival. Intracranial tumors treated with uncomplexed miR-148a and miR-31 antagomirs exhibited reduced proliferation, stem cell depletion, and normalized tumor vasculature. Growth-promoting functions of these two miRNAs were, in part, mediated by the common target, the factor inhibiting hypoxia-inducible factor 1 (FIH1), and the downstream pathways involving hypoxia-inducible factor HIF1α and Notch signaling. Therefore, miR-31 and miR-148a regulate glioma growth by maintaining tumor stem cells and their niche, and providing the tumor a way to activate angiogenesis even in a normoxic environment. This is the first study that demonstrates intratumoral uptake and growth-inhibiting effects of uncomplexed antagomirs in orthotopic glioma.


Figures

Figure 1
Figure 1
The Cancer Genome Atlas (TCGA) analysis: identification of miRNAs associated with survival in glioblastoma (GBM), and related biofunctions. (a) Cox regression and Kaplan-Meier analysis of the GBM low and high miRNA expression groups from TCGA. (b) Five-year survival of patients in the miR-31 and miR-148a high and low expression groups from the GBM dataset, adjusted for patient age. Log-rank P value for miR-31 is 2.27e-5 and for miR-148a is 1.34e-3. (c) Relative expression of miR-148a and miR-31 in non-neoplastic controls, LGG, and GBM patients. (d) Pathway-level enrichment of various bioterms among the mRNAs correlating with miR-31 or miR-148a in GBM. Significantly correlated or anti-correlated genes (P < 0.0001) were assessed for enrichment of specific bioterms using multiple resources (KEGG, Biocarta, GO Biological Processes, and MSigDB). The bioterms overlapping for miR-148a and miR-31 are highlighted in red.
Figure 2
Figure 2
Effects of miR-31 and miR-148a inhibition in vitro. (a,b) Screening glioma cultures for expression of miR-31 (a) and miR-148a (b). Expression was analyzed by Taqman qRT-PCR and normalized to uniformly expressed miR-99a. Primary human brain endothelial cells (HBECs) are also included. (c) Knock-down of miR-31 or miR-148a in glioblastoma (GBM) with ASOs results in 80–90% reduced levels in all GBM lines tested. miRNA expression was analyzed by qRT-PCR 24 hours after transfections. Error bars depict standard deviation, and n = 3. *P < 0.001. (d) Silencing miR-31 or miR-148a does not affect glioma or HBEC cell viability, as determined by WST-1 assays. Error bar = SEM and n = 3. (e) Silencing miR-31 or miR-148a decreases invasion of specific glioma lines through matrigel. The number of invading cells was normalized to the number of cells migrated without matrigel. The cultures treated with either anti-miR-31 or anti-miR-148a were compared to control treatments. Lower panels show images of reduced U251 invasion after ASO treatment. Error bar = SEM and n = 5. *P < 0.05.
Figure 3
Figure 3
The experimental procedure of continuous delivery of miRNA inhibitors to intracranial glioblastoma (GBM) xenografts. (a) H&E histology of the LN229 and MGG75 intracranial gliomas. LN229 forms solid tumors with relatively well-defined boundary, and rarely-seen small areas of hemorrhage (left panel). MGG75 is highly infiltrative with poorly-defined tumor boundary, small hemorrhage areas, and large necrotic core. The contralateral, uninjected striatal area is shown for comparison (lower panels). Scale bar = 150 µm. (b) The experimental design used for investigation of miR-31 and miR-148a in vivo. (c) The set-up used for long-term, local delivery of miRNA inhibitors to intracranial GBM.
Figure 4
Figure 4
Silencing miR-31 or miR-148a in intracranial LN229 tumors reduces tumor burden and extents animal survival. (a) The inhibitors are taken-up by tumor cells, resulting in reduced miR-148a/miR-31 levels. LN229 tumors are immunostained with the antibody detecting the intracellular ASOs (anti-6653, left panel, green). miR-31 or miR-148a expression is markedly diminished in the tumor, as detected by qRT-PCR. Results are normalized by the uniformly expressed miR-99a. Data are average from four to five animals. *P < 0.001. Scale bar = 50 µm. (b) Silencing miR-31 or miR-148a markedly reduces tumor burden. The tumor growth is monitored by luciferase imaging in vivo, and is expressed in photon flux per second. There are eight to nine animals per group at the treatment initiation, and each dot represents an animal/tumor. *P = 0.026; NS is not significant. The insert illustrates tumor imaging in representative animals, 28 days after treatment initiation. (c) Silencing miR-31 or miR-148a helps maintain the body weight in mice bearing intracranial tumors. N = 8–9 animals per group. (d) Silencing miR-31 or miR-148a significantly extends animal survival, analyzed by Kaplan-Meier plot. N = 8–9 animals per group. *P = 0.0279 and **P = 0.0483, by log-rank test. (e) Silencing miR-31 or miR-148a significantly increases tumor cell apoptosis. *P = 0.0062 and **P = 0.0024. Scale bar = 150 µm. Each dot represents one analyzed image. (f) Silencing miR-148a reduces tumor cell proliferation, as indicated by Ki67 proliferative marker. *P = 0.0025 and NS = not significant. Scale bar = 150 µm. (g) Silencing miR-31 or miR-148a normalizes tumor vasculature. Blocking miR-31 or miR-148a leads to the reduction of CD31 positive areas (left panels) and decreases tumor blood vessel diameter (right panel). Tumor vessels look smaller and less torturous. *P < 0.001. Scale bar = 150 µm. (h) Silencing miR-31 or miR-148a diminishes tumor cell self-renewal, as indicated by CD133 staining. Upper panels show the CD133-positive tumor cells. *P < 0.001. Scale bar = 25 µm. (i) Silencing miR-31 or miR-148a reduces tumor invasion. Two representative tumors are shown for each treatment group. The distance between infiltrating tumor cells and tumor mass (M) was measured in three tumors per group, three sites per tumor. Blocking either miRNA reduces the distance between infiltrative tumor cells and tumor mass. *P < 0.01.
Figure 5
Figure 5
Silencing miR-31 or miR-148a in intracranial MGG75 tumors reduces tumor burden and extents animal survival. (a) Continuous delivery of miRNA inhibitors over a period of 8 weeks significantly reduces MGG75 growth rate, as monitored by luciferase imaging. N = 8–9 mice per group. *P < 0.05 in all time points examined. (b) Silencing miR-31 or miR-148a helps maintain the body weight in mice bearing MGG75 tumors. N = 10–11 mice per group. (c) Silencing miR-31 or miR-148a significantly extends survival of MGG75-bearing mice, as analyzed by Kaplan-Meier plot. N = 10–11 mice per group. *P < 0.0001 and **P = 0.0251, by log-rank test. (d) Silencing miR-31 or miR-148a reduces tumor cell proliferation, as indicated by Ki67 proliferative marker. *P <0.0001. Scale bar = 150 µm. Each dot represents an analyzed image. (e) Silencing miR-31 or miR-148a markedly reduces percentage of SOX2-positive cells. *P < 0.0001. Scale bar = 150 µm. (f) Silencing miR-31 or miR-148a slightly reduces percentage of nestin-positive cells. NS, not significant. Scale bar = 150 µm. (g) Silencing miR-31 or miR-148a normalizes tumor vasculature. Blocking miR-31 or miR-148a reduces the percentage of abnormal blood vessels, and decreases tumor blood vessel diameter (data not shown). Tumor vessels look smaller and less torturous. *P < 0.01. Scale bar = 150 µm.
Figure 6
Figure 6
FIH1 as the common target of miR-148a and miR-31 that antagonizes hypoxia and Notch pathways. (a) FIH is derepressed in glioblastoma (GBM) lines and spheres upon suppression of either miR-31 or miR-148a, and HIF1α levels are reduced. n = 5; representative western blot images are shown. (b) Percentage of intracranial LN229 tumor cells immuno-positive for FIH1 is prominently increased. *P < 0.0001. Scale bar = 150 µm. Each dot represents an analyzed image. (c) Percentage of intracranial MGG75 tumor cells immuno-positive for FIH is prominently increased. *P = 0.0001 and **P < 0.0001. Scale bar = 150 µm. (d) Validation of direct binding and regulation of FIH1 mRNA by miR-148a, using luciferase constructs bearing either WT or mutated FIH1 3'UTR. The site 1 containing 11-mer binding motif, which mutations abolished the binding (mut 1, underlined), is shown in the upper panel. *P < 0.05 and NS is not significant. (e) miR-148 or miR-31 inhibition reduces expression of HIF1α and NICD downstream genes in LN229 cells, whereas FIH1 silencing abolishes these effects. Upper panels show mRNA levels of ENO1, VEGF, HES1 and HEY1, normalized by 18S rRNA. N = 4. *P < 0.05. NS, not significant. (f) Percentage of nuclear NICD is dramatically reduced upon miR-31 or miR-148a inhibition in intracranial LN229 tumors. *P = 0.0061 and **P = 0.0019. Scale bar = 25 µm; N = 6. (g) Median VEGF level is reduced upon miR-31 or miR-148a inhibition in intracranial LN229 tumors. *P < 0.05. Scale bar = 25 µm. (h) Inhibition of miR-31 or miR-148a in MGG75 cultures reduces the levels of secreted VEGF, as indicated by antibody arrays and Western blotting. *P < 0.05. (i) The media conditioned (CM) with glioma MGG75 cells transfected with anti-miR-148a, enhances endothelial cell degeneration. CM collected after silencing miR-148a was added to the tubules formed by HUVECs or HBECs, which enhanced endothelial cell degeneration within 16 hours. Quantification of branching length and junctions is shown on the lower panels. N = 4. *P < 0.05.
Figure 7
Figure 7
A model of miR-148a/miR-31/FIH1/HIF1α-Notch signaling in glioblastoma self-renewal and angiogenesis.

References

    1. Chan, JA, Krichevsky, AM and Kosik, KS (2005). MicroRNA-21 is an antiapoptotic factor in human glioblastoma cells. Cancer Res 65: 6029–6033. - PubMed
    1. He, L, Thomson, JM, Hemann, MT, Hernando-Monge, E, Mu, D, Goodson, S et al. (2005). A microRNA polycistron as a potential human oncogene. Nature 435: 828–833. - PMC - PubMed
    1. Hayashita, Y, Osada, H, Tatematsu, Y, Yamada, H, Yanagisawa, K, Tomida, S et al. (2005). A polycistronic microRNA cluster, miR-17-92, is overexpressed in human lung cancers and enhances cell proliferation. Cancer Res 65: 9628–9632. - PubMed
    1. Iorio, MV and Croce, CM (2012). microRNA involvement in human cancer. Carcinogenesis 33: 1126–1133. - PMC - PubMed
    1. Janssen, HL, Reesink, HW, Lawitz, EJ, Zeuzem, S, Rodriguez-Torres, M, Patel, K et al. (2013). Treatment of HCV infection by targeting microRNA. N Engl J Med 368: 1685–1694. - PubMed

Publication types

MeSH terms