. 2015 Jun;200(2):443-54.
doi: 10.1534/genetics.115.175851. Epub 2015 Apr 21.

Measuring Food Intake and Nutrient Absorption in Caenorhabditis elegans

Affiliations

Measuring Food Intake and Nutrient Absorption in Caenorhabditis elegans

Rafael L Gomez-Amaro et al. Genetics. 2015 Jun.

Abstract

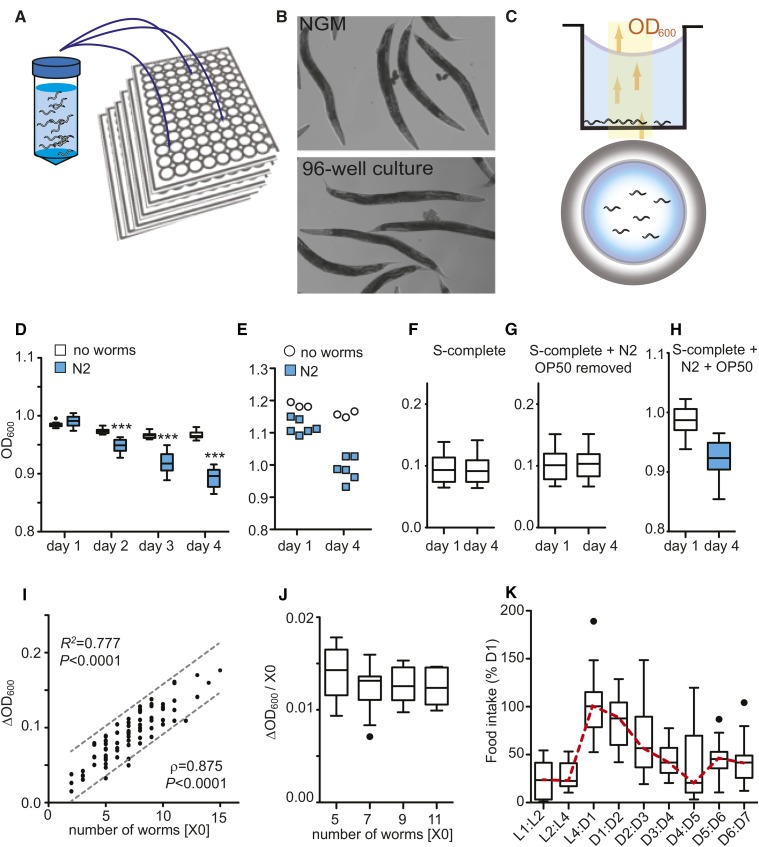
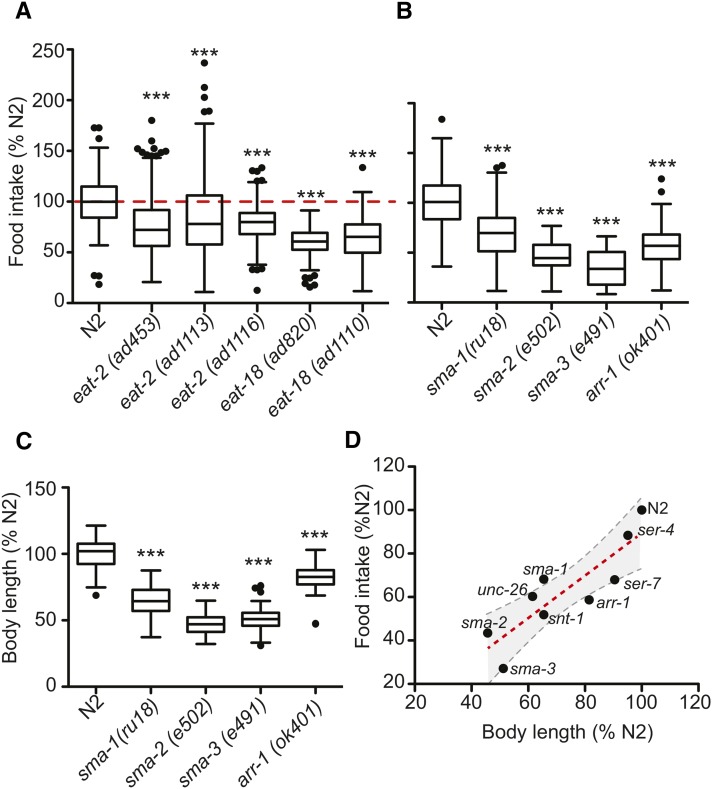
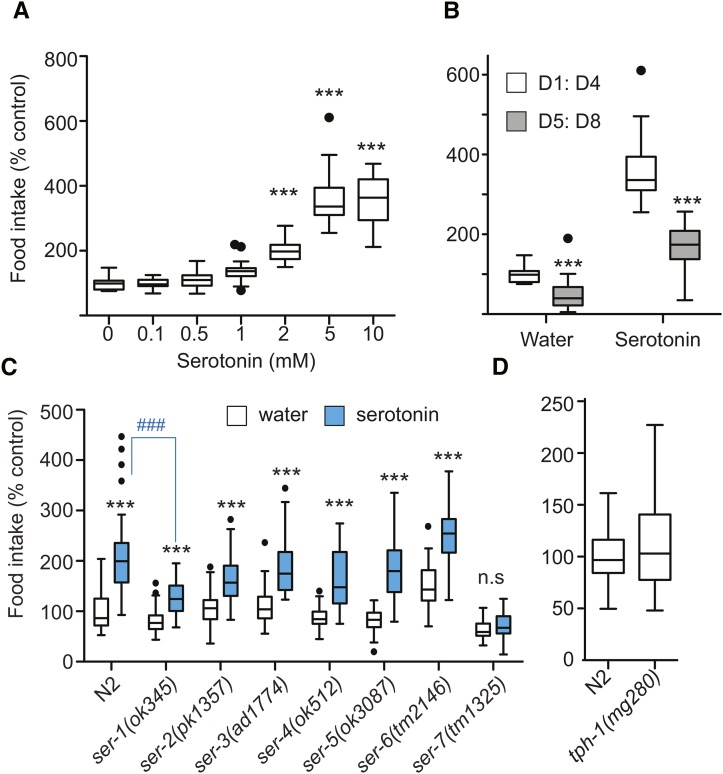
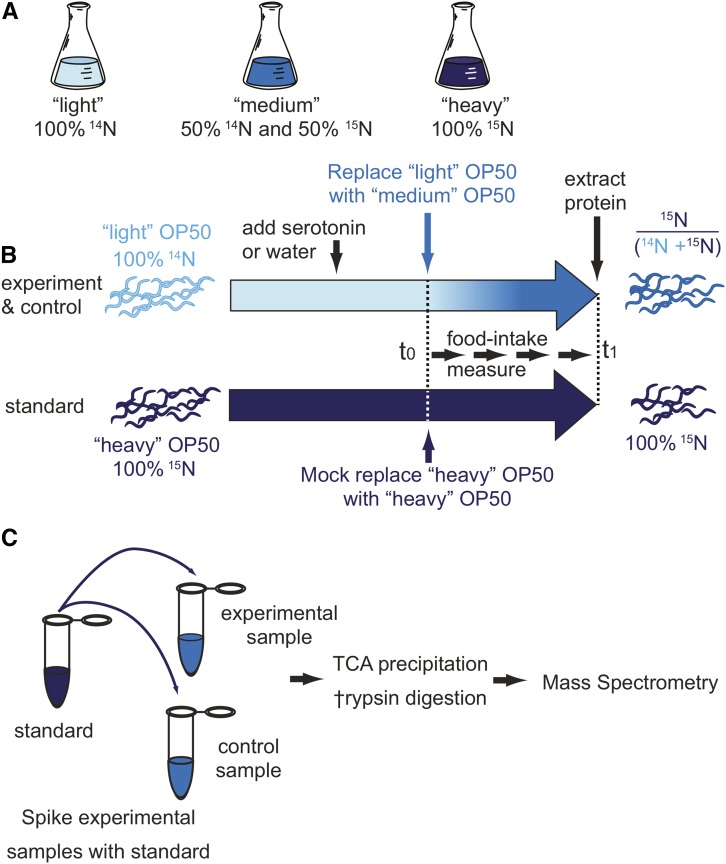
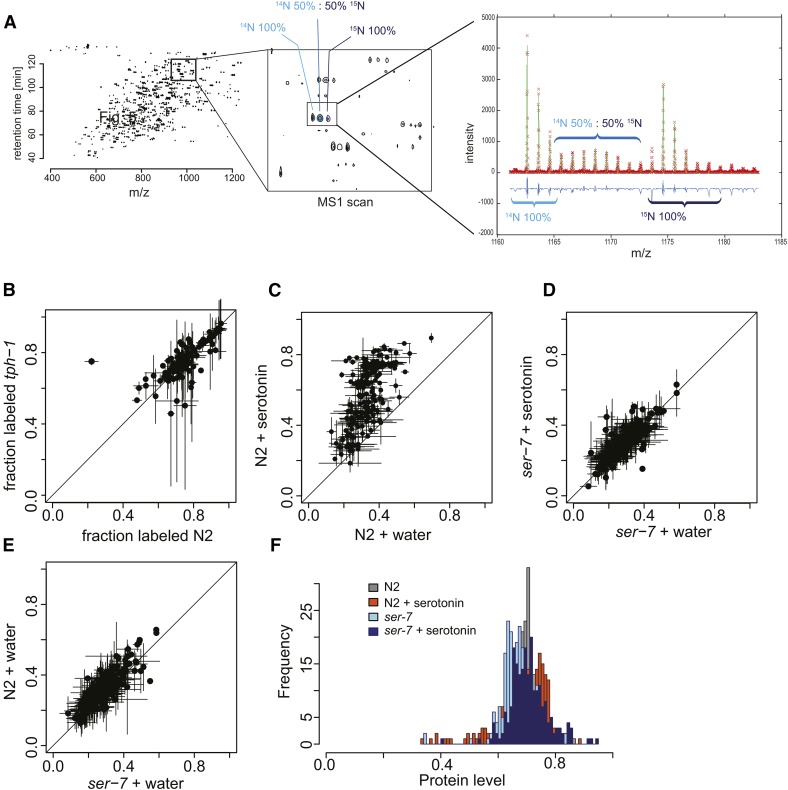
Caenorhabditis elegans has emerged as a powerful model to study the genetics of feeding, food-related behaviors, and metabolism. Despite the many advantages of C. elegans as a model organism, direct measurement of its bacterial food intake remains challenging. Here, we describe two complementary methods that measure the food intake of C. elegans. The first method is a microtiter plate-based bacterial clearing assay that measures food intake by quantifying the change in the optical density of bacteria over time. The second method, termed pulse feeding, measures the absorption of food by tracking de novo protein synthesis using a novel metabolic pulse-labeling strategy. Using the bacterial clearance assay, we compare the bacterial food intake of various C. elegans strains and show that long-lived eat mutants eat substantially more than previous estimates. To demonstrate the applicability of the pulse-feeding assay, we compare the assimilation of food for two C. elegans strains in response to serotonin. We show that serotonin-increased feeding leads to increased protein synthesis in a SER-7-dependent manner, including proteins known to promote aging. Protein content in the food has recently emerged as critical factor in determining how food composition affects aging and health. The pulse-feeding assay, by measuring de novo protein synthesis, represents an ideal method to unequivocally establish how the composition of food dictates protein synthesis. In combination, these two assays provide new and powerful tools for C. elegans research to investigate feeding and how food intake affects the proteome and thus the physiology and health of an organism.

Keywords: aging; de novo protein synthesis; feeding; metabolism; nutrition.


Figures

Figure 1
Figure 1
Measurement of bacterial clearance with C. elegans. (A) A 96-well liquid culture format. (B) Morphology of day 1 (D1) adult N2 worms grown on solid NGM plates (top) or in liquid culture (bottom). (C) The bacterial clearance assay. Schematic of worms placed into wells with an optical bottom to monitor bacterial concentrations by measuring the optical density (absorbance) at 600 nm (OD600). Side and top view. (D) Bacterial clearance is only observed in the presence of worms. Tukey-style box plots. OD600 depicting four time points, comparing wild-type N2 vs. no worms, nwells = 12 biological replicates (e.g., wells). Data represent five independent experiments. ***P < 0.001, two-way ANOVA with Bonferroni post hoc test. (E) Bacterial clearance is observed for bacteria killed by irradiation. Data represent three independent experiments. Wells with N2 (nwells = 6), wells with no worms (nwells = 3). (F–H) OD600 measurements are not influenced by the presence of eggs and depend only on the presence of worms eating bacteria. OD600 on D1 and D4 for wells containing (F) S-complete only, (G) N2 and eggs in S-complete with OP50 removed, or (H) N2 plus bacteria in S-complete. Data represent three independent experiments. (I) Bacterial clearance correlates with the number of worms per well (X0). Values depict bacterial clearance over 72 hr (D1:D4). Data depict 95% confidence interval (dashed lines), goodness of fit statistic (R2), and Spearman’s correlation ρ (P < 0.0001). Data represent three independent experiments (nwells = 84). (J) Data from I normalized to worms per well. (K) Age-related changes in food intake. Food intake expressed relative to bacterial clearance within the L4:D1 interval. Data represent three independent experiments (nwells = 36).
Figure 2
Figure 2
Body size influences food intake. (A) Food intake of long-lived eat mutants. Food intake expressed relative to wild-type N2 (D1:D4). Data represent three independent experiments, nwells ≥ 88. ***P < 0.01, one-way ANOVA with Dunnett’s multiple comparison post-test. (B) Small animals eat less. Data represent three independent experiments, nwells ≥ 43. ***P < 0.01, one-way ANOVA with Dunnett’s multiple comparison post-test. (C) Body length of animals in B. Body length as measured on day 4 of adulthood. Data represent three independent experiments, nwells ≥ 28. ***P < 0.001, one-way ANOVA with Dunnett’s multiple comparison post-test. (D) Interaction of animal size and food intake. Food intake and body length measurements expressed relative to wild-type N2 on day 4 of adulthood. Data represent three independent experiments. Linear regression line (dashed red line) and the 95% confidence interval (dashed gray lines) are shown. Goodness of fit statistic, R2 = 0.753 (P < 0.002).
Figure 3
Figure 3
Modulation of food intake by serotonergic signaling. (A) Dose–response curve for wild-type N2 animals treated with serotonin. Food intake expressed relative to control treatment (water). Tukey-style box plots, unless otherwise stated, depict food intake over the D1:D4 interval. Data are representative of three independent experiments, nwells = 20. ***P < 0.01, one-way ANOVA with Dunnett’s multiple comparison post-test. (B) Food intake of pre- and post-reproductive wild-type N2 animals treated with water or serotonin (2 mM). Food intake is expressed relative to the D1:D4 interval of control water-treated N2 animals. Data are representative of three independent experiments, n = 18. ***P < 0.0001, Student’s t-test. (C) Food intake in response to serotonin (2 mM) for wild-type N2 animals and serotonin receptor mutants. Data for each strain are representative of a minimum of three independent experiments. Data as depicted in graph represent two independent experiments, nwells ≥ 42. ***P < 0.001, two-way ANOVA with Bonferroni post-test comparing response to serotonin for each genotype. ###P < 0.001, one-way ANOVA with Dunnett’s multiple correction post-test comparing serotonin-treated animals of each genotype to wild-type serotonin-treated animals. (D) Basal food intake of serotonin-synthesis-deficient tph-1 mutants. Food intake is expressed relative to wild-type N2. Data represent three independent experiments, nwells ≥ 95. Student’s t-test was used to establish significance. Note: For a version of graphs in A and C showing S.E.M. and thus reproducibility between experiments, see Figure S2.
Figure 4
Figure 4
Measurement of nutrient absorption in C. elegans using metabolic labeling coupled with quantitative mass spectrometry. To metabolically label worms, (A) we first grew three different OP50 “foods” by culturing OP50 bacteria in minimal media enriched with either 100% (14NH4)2SO4, 50% (14NH4)2SO4 + 50% (15NH4)2SO4, or 100% (15NH4)2SO4. These foods were termed “light,” “medium,” and “heavy,” respectively. Second, we generated a population of heavy worms. These worms were fed heavy OP50 for three generations to ensure fully enriched 100% (15NH4)2SO4 worm proteins. (B) Third, light and heavy worms were synchronized and cultured in light and heavy food, respectively. The heavy worms were used as an external standard to facilitate the comparison of different experimental samples. 14N worms were given either the drug of choice or water at day 1. At day 5, or the start day for the pulse labeling, worms were washed and the food was switched from light to medium for drug- or water-treated worms, and from heavy to heavy for the mass-spec-standard worms. The worms were harvested on day 7 after pulse labeling and prepared for mass spectrometry analysis. (C) Preparation of samples for mass spectrometry analysis. For each experiment an external standard was generated, derived from heavy worms cultured in parallel. Each sample lysate was spiked with the external standard. Proteins were extracted by TCA precipitation, digested with trypsin, and analyzed by LC-MS/MS.
Figure 5
Figure 5
Pulse-feeding assay. (A) Whole worm lysate analyzed on the mass spectrometer, with sample data shown in Figure 4, B and C. Each peptide in the spectra has a “light,” “medium,” and “heavy” component. The intensity of the light component depends on the amount of each peptide present before the pulse-labeling period. The intensity of the medium component depends on the amount of ingested food after the start of the pulse-labeling period. The heavy component serves as a standard sample. (B) Correlation plot of fraction-labeled values for wild-type N2 (x-axis) vs. tph-1 mutant worms (y-axis) from L4:D1. (C) Correlation plot of fraction-labeled values by protein for wild-type N2 treated with water (x-axis) or serotonin (y-axis, 5 mM) from D5:D7. (D) Correlation plot of fraction-labeled values for ser-7 mutant worms grown with water (x-axis) or treated with serotonin (y-axis, 5 mM) from D5:D7. (E) Correlation plot of fraction-labeled values for wild-type N2 (y-axis) and ser-7 mutants (x-axis) treated with water from D5:D7. (F) Histogram of protein level values for wild-type N2 and ser-7 mutants treated with water or serotonin (5 mM).

References

    1. Ashrafi K., 2006. Mapping out starvation responses. Cell Metab. 3: 235–236. - PubMed
    1. Ashrafi K., Chang F. Y., Watts J. L., Fraser A. G., Kamath R. S., et al. , 2003. Genome-wide RNAi analysis of Caenorhabditis elegans fat regulatory genes. Nature 421: 268–272. - PubMed
    1. Avery L., 1993. The genetics of feeding in Caenorhabditis elegans. Genetics 133: 897–917. - PMC - PubMed
    1. Avery L., You Y. J., 2012. C. elegans feeding. WormBook 1–23. - PMC - PubMed
    1. Beaulieu J. M., Sotnikova T. D., Marion S., Lefkowitz R. J., Gainetdinov R. R., et al. , 2005. An Akt/beta-arrestin 2/PP2A signaling complex mediates dopaminergic neurotransmission and behavior. Cell 122: 261–273. - PubMed

Publication types