. 2015 Apr 23:6:6997.
doi: 10.1038/ncomms7997.

APOBEC family mutational signatures are associated with poor prognosis translocations in multiple myeloma

Affiliations

APOBEC family mutational signatures are associated with poor prognosis translocations in multiple myeloma

Brian A Walker et al. Nat Commun. .

Abstract

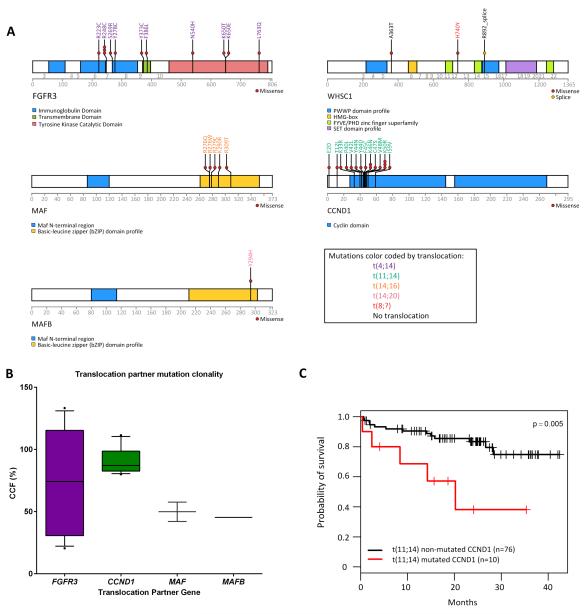
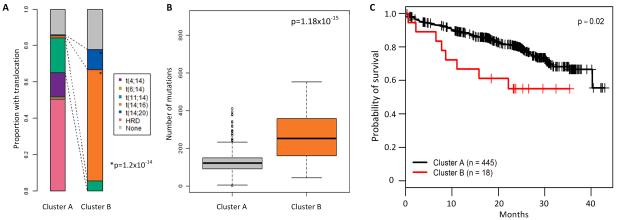
We have sequenced 463 presenting cases of myeloma entered into the UK Myeloma XI study using whole exome sequencing. Here we identify mutations induced as a consequence of misdirected AID in the partner oncogenes of IGH translocations, which are activating and associated with impaired clinical outcome. An APOBEC mutational signature is seen in 3.8% of cases and is linked to the translocation-mediated deregulation of MAF and MAFB, a known poor prognostic factor. Patients with this signature have an increased mutational load and a poor prognosis. Loss of MAF or MAFB expression results in decreased APOBEC3B and APOBEC4 expression, indicating a transcriptional control mechanism. Kataegis, a further mutational pattern associated with APOBEC deregulation, is seen at the sites of the MYC translocation. The APOBEC mutational signature seen in myeloma is, therefore, associated with poor prognosis primary and secondary translocations and the molecular mechanisms involved in generating them.


Figures

Figure 1
Figure 1. MYC abnormalities affect survival
Progression free (A) and overall survival (B) of patients with MYC translocation, gain or no abnormality. Progression free (C) or overall survival (D) of patients comparing no MYC abnormality to those with either a translocation or gain of the locus. E, Relative expression of MYC in samples with no MYC abnormality, a translocation at 8q24 or gain or loss of the MYC locus. The box and whisker plot shows the 10 and 90 percentiles (whiskers) and the median and 25 and 75 percentiles (box). P-values determined by log rank test.
Figure 2
Figure 2. Kataegis in myeloma
Kataegis at 8q24 coincides with translocation breakpoints and occurs on both chromosomes where a translocation has occurred. Examples of two samples are shown. For each sample the top left plot shows the distances between mutations and are colored on a chromosomal basis according to UCSC coloring. The top right panel show the same data but is colored by mutation type, as per the key. The bottom panels show the location on chromosome 8 and the partner translocation chromosome (22 or 2, respectively) where kataegis is found with genes or Ig loci segments indicated in green or cyan, respectively. The arrows indicated the position of the translocation breakpoint.
Figure 3
Figure 3. Mutations in translocation partner oncogenes
(A) Non-synonymous mutations in translocation partner oncogenes are depicted along with the translocation group they occur in. (B) The cancer cell fraction (CCF) in which the mutations occur. (C) Mutation of CCND1 in t(11;14) samples results in decreased overall survival in Myeloma XI samples. The box and whisker plot shows the 10 and 90 percentiles (whiskers) and the median and 25 and 75 percentiles (box).
Figure 4
Figure 4. Analysis of mutation context identifies two signatures in myeloma
(A) Mutation context identifies two signatures in myeloma, Signature A and Signature B. (B) t(14;16) and t(14;20) samples have significantly more mutations than other translocation groups. (C) The mutational context split by translocation group identifies t(14;16) and t(14;20) with more mutations which make up Signature B. (D) Stacked bar chart showing the percentage contribution of the two signatures identified by NMF in each sample, ordered by translocation group. The box and whisker plot shows the 10 and 90 percentiles (whiskers) and the median and 25 and 75 percentiles (box). P-values determined by ANOVA.
Figure 5
Figure 5. Myeloma mutations can be categorised as belonging to Signature A or Signature B
(A) Samples which mostly have Signature B mutations dominate Cluster B and are enriched for t(14;16) and t(14;20). P-value determined by a linear model. (B) Samples in Cluster B have more mutations than those in Cluster A, p-value determined by ANOVA. Patients in Cluster B have a significantly worse overall survival, p-value by log rank test (C). The box and whisker plot shows the 10 and 90 percentiles (whiskers) and the median and 25 and 75 percentiles (box).
Figure 6
Figure 6. t(14;16)/MAF samples have increased expression of APOBEC genes in the Myeloma IX (GSE15695) and the UAMS datasets (GES4581)
APOBEC3A (210873_x_at) and APOBEC3B (206632_s_at) were tested for increased expression in the t(14;16)/MAF samples and the significant results shown. P-value by ANOVA.
Figure 7
Figure 7. Knockdown of MAF and MAFB by shRNAs induced decrease in the expression of APOBECs
RPMI8226 cells (A and B) were transiently infected with supernatant containing control shRNA (shCont) or shRNA specific for c-Maf (shMaf) for 48 hours. Total RNA was then isolated and subjected to qRT-PCR analysis to detect MAF mRNA (A) and APOBEC3B mRNA (B). Sachi cells (C and B) were transiently infected with supernatant containing control shRNA (shCont) or shRNA specific for MAFB (shMafB) for 48hours and expression of MAFB (C) and APOBEC4 (D) were analyzed.

References

    1. Morgan GJ, Walker BA, Davies FE. The genetic architecture of multiple myeloma. Nat Rev Cancer. 2012;12:335–348. - PubMed
    1. Kuehl WM, Bergsagel PL. Multiple myeloma: evolving genetic events and host interactions. NatRevCancer. 2002;2:175–187. - PubMed
    1. Zhan F, et al. The molecular classification of multiple myeloma. Blood. 2006;108:2020–2028. - PMC - PubMed
    1. Chesi M, Nardini E, Lim RS, Smith KD, Kuehl WM, Bergsagel PL. The t(4;14) translocation in myeloma dysregulates both FGFR3 and a novel gene, MMSET, resulting in IgH/MMSET hybrid transcripts. Blood. 1998;92:3025–3034. - PubMed
    1. Walker BA, et al. A compendium of myeloma-associated chromosomal copy number abnormalities and their prognostic value. Blood. 2010;116:e56–65. - PubMed

Publication types