. 2015 Jun 1;113(10):3720-35.
doi: 10.1152/jn.00515.2014. Epub 2015 Apr 22.

Involvement of histaminergic inputs in the jaw-closing reflex arc

Affiliations

Involvement of histaminergic inputs in the jaw-closing reflex arc

Chikako Gemba et al. J Neurophysiol. .

Abstract

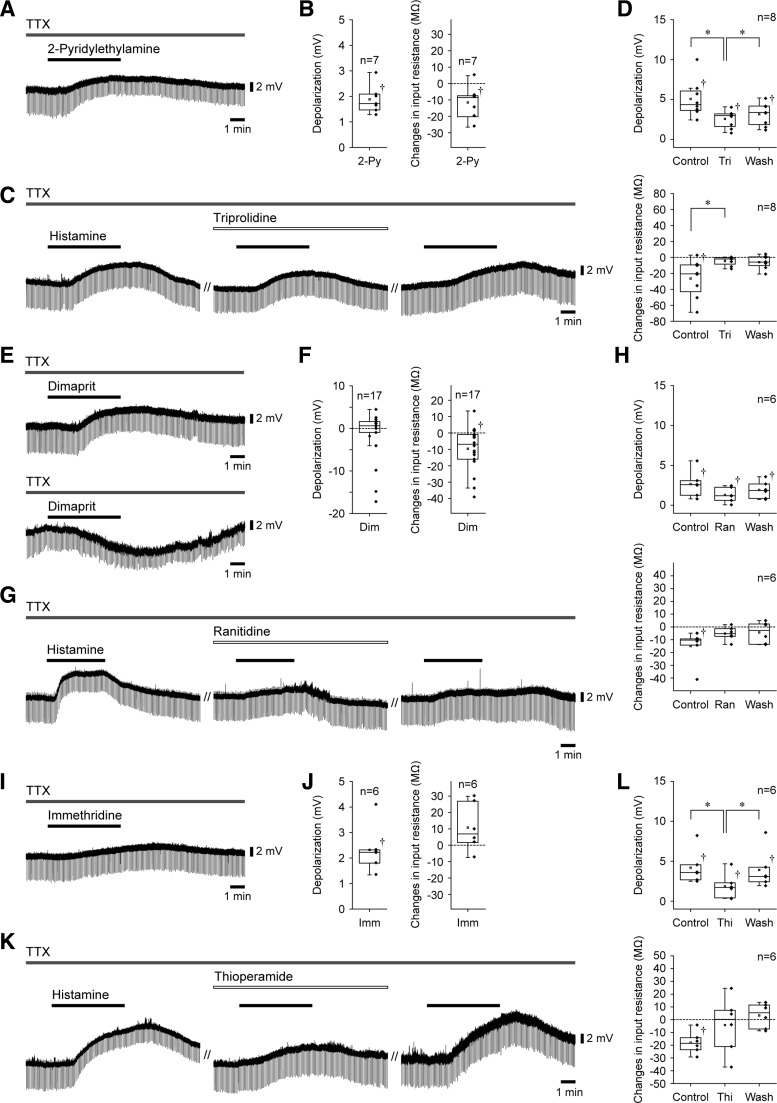
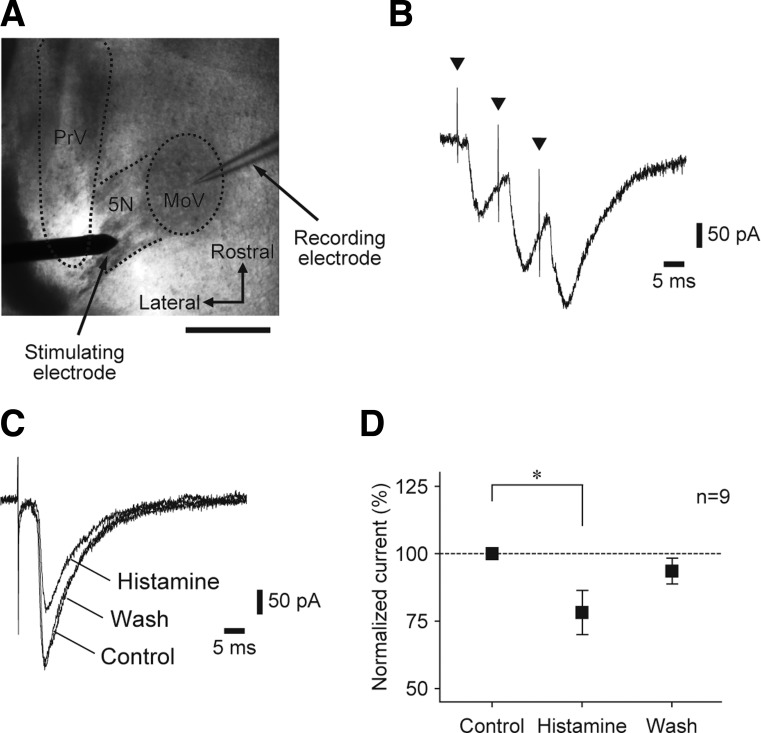
Histamine receptors are densely expressed in the mesencephalic trigeminal nucleus (MesV) and trigeminal motor nucleus. However, little is known about the functional roles of neuronal histamine in controlling oral-motor activity. Thus, using the whole-cell recording technique in brainstem slice preparations from Wistar rats aged between postnatal days 7 and 13, we investigated the effects of histamine on the MesV neurons innervating the masseter muscle spindles and masseter motoneurons (MMNs) that form a reflex arc for the jaw-closing reflex. Bath application of histamine (100 μM) induced membrane depolarization in both MesV neurons and MMNs in the presence of tetrodotoxin, whereas histamine decreased and increased the input resistance in MesV neurons and MMNs, respectively. The effects of histamine on MesV neurons and MMNs were mimicked by an H1 receptor agonist, 2-pyridylethylamine (100 μM). The effects of an H2 receptor agonist, dimaprit (100 μM), on MesV neurons were inconsistent, whereas MMNs were depolarized without changes in the input resistance. An H3 receptor agonist, immethridine (100 μM), also depolarized both MesV neurons and MMNs without changing the input resistance. Histamine reduced the peak amplitude of postsynaptic currents (PSCs) in MMNs evoked by stimulation of the trigeminal motor nerve (5N), which was mimicked by 2-pyridylethylamine but not by dimaprit or immethridine. Moreover, 2-pyridylethylamine increased the failure rate of PSCs evoked by minimal stimulation and the paired-pulse ratio. These results suggest that histaminergic inputs to MesV neurons through H1 receptors are involved in the suppression of the jaw-closing reflex although histamine depolarizes MesV neurons and/or MMNs.

Keywords: histamine; jaw-closing reflex; masseter motoneuron; mesencephalic trigeminal nucleus; patch clamp.


Figures

Fig. 1.
Fig. 1.
Effects of histamine on the resting membrane potentials of mesencephalic trigeminal nucleus (MesV) neurons. A: histamine-induced membrane depolarization in a MesV neuron in the presence of tetrodotoxin (TTX) (0.5 μM). Black bars show periods of bath application of histamine. Each concentration of histamine (0.1–1,000.0 μM) was applied to 1 MesV neuron. B: video images of a transverse brainstem slice preparation at high magnification. A differential interference contrast image (left) and an epifluorescence image (right) show the same field, including the MesV neurons. The MesV neurons that relay sensory inputs from the masseter muscle spindles were labeled by tetramethylrhodamine (right), and patch-clamp recording was performed on the fluorescently labeled MesV neuron. *MesV neurons. Scale bar = 50 μm. C: raw data (dots) and boxplot of the median membrane depolarization (left) and median changes in the input resistance (right) for each histamine concentration. The top of each box represents the 3rd quartile, and the bottom represents the 1st quartile. Horizontal lines in the boxes indicate the median of the distribution. Small open squares indicate the mean values. †P < 0.05 vs. before histamine application. *P < 0.05 vs. histamine concentrations. D: effects of TTX (0.5 μM) on the histamine-induced membrane depolarization in a MesV neuron. E: raw data (dots) and boxplot of the median membrane depolarization (left) and median changes in the input resistance (right) by bath application of histamine in the absence and presence of TTX. †P < 0.05 vs. before histamine application.
Fig. 2.
Fig. 2.
Effects of histamine receptor agonists and antagonists on MesV neurons. A: membrane depolarization in a MesV neuron by bath application of 2-pyridylethylamine (100 μM) in the presence of TTX (0.5 μM). B: raw data (dots) and boxplot of the median membrane depolarization by bath application of 2-pyridylethylamine (2-Py, left) and median change in the input resistance accompanied by 2-pyridylethylamine-induced membrane depolarization (right). †P < 0.05 vs. before 2-pyridylethylamine application. C: effects of triprolidine (100 μM) on histamine-induced membrane depolarization. Histamine-induced membrane depolarizations in control (left), in the presence of triprolidine (middle), and after washout of triprolidine (right) are shown in a MesV neuron in the presence of TTX (0.5 μM). D: raw data (dots) and boxplot of the median histamine-induced membrane depolarization (top) and median histamine-induced changes in the input resistance (bottom) for bath application of triprolidine (Tri). †P < 0.05 vs. before histamine application. *P < 0.05, control vs. triprolidine, triprolidine vs. wash. E: membrane depolarization (top) and membrane hyperpolarization (bottom) in MesV neurons by bath application of dimaprit (100 μM) in the presence of TTX (0.5 μM). F: raw data (dots) and boxplot of the median membrane depolarization by bath application of dimaprit (Dim, left) and the median change in the input resistance accompanied by dimaprit-induced membrane depolarization (right). †P < 0.05 vs. before dimaprit application. G: effects of ranitidine (100 μM) on histamine-induced membrane depolarization. Histamine-induced membrane depolarizations in control (left), in the presence of ranitidine (middle), and after washout of ranitidine (right) are shown in a MesV neuron in the presence of TTX (0.5 μM). H: raw data (dots) and boxplot of the median histamine-induced membrane depolarization (top) and median histamine-induced changes in the input resistance (bottom) for bath application of ranitidine (Ran). †P < 0.05 vs. before histamine application. I: membrane depolarization in a MesV neuron by bath application of immethridine (100 μM) in the presence of TTX (0.5 μM). J: raw data (dots) and boxplot of the median membrane depolarization by bath application of immethridine (Imm, left) and the median change in the input resistance accompanied by immethridine-induced membrane depolarizations (right). †P < 0.05 vs. before immethridine application. K: effects of thioperamide (100 μM) on histamine-induced membrane depolarization. Histamine-induced membrane depolarizations in control (left), in the presence of thioperamide (middle), and after washout of thioperamide (right) are shown in a MesV neuron in the presence of TTX (0.5 μM). L: raw data (dots) and boxplot of the median histamine-induced membrane depolarization (top) and median histamine-induced changes in the input resistance (bottom) for bath application of thioperamide (Thi). †P < 0.05 vs. before histamine application. *P < 0.05, control vs. thioperamide, triprolidine vs. wash.
Fig. 3.
Fig. 3.
Effects of histamine on the resting membrane potentials in masseter motoneurons (MMNs). A: histamine-induced membrane depolarization in an MMN in the presence of TTX (0.5 μM). Black bars show periods of bath application of histamine. Each concentration of histamine (0.1–1,000.0 μM) was applied to 1 MMN. B: video images of a transverse brainstem slice preparation at high magnification. A differential interference contrast image (left) and an epifluorescence image (right) show the same field including the trigeminal motoneurons. The MMNs were labeled by tetramethylrhodamine (right), and patch-clamp recording was performed on the fluorescently labeled MMNs. *Trigeminal motoneurons. Scale bar = 50 μm. C: raw data (dots) and boxplot of the median membrane depolarization (left) and median changes in the input resistance accompanied by histamine-induced membrane depolarization (right) for each histamine concentration. †P < 0.05 vs. before histamine application. *P < 0.05 vs. histamine concentrations. D: histamine-induced membrane depolarization in an MMN in the presence of tetramethylammonium (TEA) (20 mM), 4-aminopyridine (4-AP) (5 mM), and TTX (0.5 μM) in the artificial cerebrospinal fluid and Cs+ (120 mM) in the pipette solution. E: raw data (dots) and boxplot of the median histamine-induced membrane depolarization (left) and median histamine-induced changes in the input resistance (right) in the presence of TEA, 4-AP, Cs+, and TTX. †P < 0.05 vs. before histamine application. F: effects of TTX (0.5 μM) on the histamine-induced membrane depolarization in an MMN. G: raw data (dots) and boxplot of the median histamine-induced membrane depolarization (left) and median histamine-induced changes in the input resistance (right) in the absence and presence of TTX. †P < 0.05 vs. before histamine application. *P < 0.05, TTX free vs. TTX.
Fig. 4.
Fig. 4.
Effects of histamine receptor agonists and antagonists on the MMNs. A: membrane depolarization in an MMN by bath application of 2-pyridylethylamine (100 μM) in the presence of TTX (0.5 μM). B: raw data (dots) and boxplot of the median membrane depolarization by bath application of 2-pyridylethylamine (left) and the median change in the input resistance accompanied by 2-pyridylethylamine-induced membrane depolarization (right). †P < 0.05 vs. before 2-pyridylethylamine application. C: effects of triprolidine (100 μM) on histamine-induced membrane depolarization. Histamine-induced membrane depolarizations in control (left), in the presence of triprolidine (middle), and after washout of triprolidine (right) are shown in an MMN in the presence of TTX (0.5 μM). D: raw data (dots) and boxplot of the median histamine-induced membrane depolarization (top) and median histamine-induced changes in the input resistance (bottom) for bath application of triprolidine. †P < 0.05 vs. before histamine application. *P < 0.05, control vs. triprolidine, triprolidine vs. wash. E: membrane depolarization in an MMN by bath application of dimaprit (100 μM) in the presence of TTX (0.5 μM). F: raw data (dots) and boxplot of the median membrane depolarization by bath application of dimaprit (left) and the median change in the input resistance accompanied by dimaprit-induced membrane depolarization (right). †P < 0.05 vs. before dimaprit application. G: effects of ranitidine (100 μM) on histamine-induced membrane depolarization. Histamine-induced membrane depolarizations in control (left), in the presence of ranitidine (middle), and after washout of ranitidine (right) are shown in an MMN in the presence of TTX (0.5 μM). H: raw data (dots) and boxplot of the median histamine-induced membrane depolarization (top) and median histamine-induced changes in the input resistance (bottom) for bath application of ranitidine. †P < 0.05 vs. before histamine application. *P < 0.05, control vs. ranitidine. I: membrane depolarization in an MMN by bath application of immethridine (100 μM) in the presence of TTX (0.5 μM). J: raw data (dots) and boxplot of the median membrane depolarization by bath application of immethridine (left) and the median change in the input resistance accompanied by immethridine-induced membrane depolarization (right). †P < 0.05 vs. before immethridine application. K: effects of thioperamide (100 μM) on histamine-induced membrane depolarization. Histamine-induced membrane depolarizations in control (left), in the presence of thioperamide (middle), and after washout of thioperamide (right) are shown in an MMN in the presence of TTX (0.5 μM). L: raw data (dots) and boxplot of the median histamine-induced membrane depolarization (top) and median histamine-induced changes in the input resistance (bottom) for bath application of thioperamide. †P < 0.05 vs. before histamine application. *P < 0.05, control vs. thioperamide, thioperamide vs. wash.
Fig. 5.
Fig. 5.
Effects of bath application of histamine on the postsynaptic inward currents (PSCs) in MMNs evoked by electrical stimulation of the trigeminal motor nerve (5N). A: video image of a transverse brainstem slice preparation at low magnification. Black dashed lines show the trigeminal motor nucleus (MoV), the principal sensory trigeminal nucleus (PrV), and the 5N. Scale bar = 500 μm. B: PSCs evoked by high-frequency stimulation (100 Hz) of the 5N. Arrowheads indicate the onset of the stimulation. C: PSCs in an MMN evoked by electrical stimulation of the 5N in control conditions, during bath application of histamine (100 μM) and after washout of histamine. D: mean changes in the peak amplitude of evoked PSCs by bath application of histamine. *P < 0.05, control vs. histamine.
Fig. 6.
Fig. 6.
Effects of bath application of histamine receptor agonists on the PSCs in MMNs evoked by electrical stimulation of the 5N. A: PSCs in an MMN evoked by electrical stimulation of the 5N in control conditions, during bath application of 2-pyridylethylamine (100 μM) and after washout of 2-pyridylethylamine. B: mean changes in the peak amplitude of evoked PSCs by bath application of 2-pyridylethylamine. *P < 0.05, control vs. 2-pyridylethylamine. C: evoked PSCs in an MMN in control conditions, during bath application of 2-pyridylethylamine (100 μM) and after washout of 2-pyridylethylamine in the presence of triprolidine (10 μM). D: mean changes in the peak amplitude of evoked PSCs by bath application of 2-pyridylethylamine in the presence of triprolidine. E: evoked PSCs in an MMN in control conditions, during bath application of histamine (100 μM), during bath application of histamine in the presence of triprolidine (10 μM), and after washout of histamine and triprolidine. F: mean changes in the peak amplitude of evoked PSCs by bath application of histamine in the presence of triprolidine. G: evoked PSCs in an MMN in control conditions, during bath application of dimaprit (100 μM) and after washout of dimaprit. H: mean changes in the peak amplitude of evoked PSCs by bath application of dimaprit. I: evoked PSCs in an MMN in control conditions, during bath application of immethridine (100 μM) and after washout of immethridine. J: mean changes in the peak amplitude of evoked-PSCs by bath application of immethridine.
Fig. 7.
Fig. 7.
Effects of bath application of an H1 receptor agonist on presumed monosynaptic responses in MMNs evoked by minimal stimulation of the 5N. A: 12 superimposed responses recorded every 25 s in control conditions (a), during bath application of 2-pyridylethylamine (100 μM, b), and after washout (c). B: individual peak amplitudes monitored during the time course of the experiment in A. C: mean changes in the failure rate of minimal stimulation-evoked PSCs by bath application of 2-pyridylethylamine. *P < 0.05, control vs. 2-pyridylethylamine, 2-pyridylethylamine vs. wash. D: mean changes in the peak amplitude of minimal stimulation-evoked PSCs by bath application of 2-pyridylethylamine. E: 12 superimposed responses recorded every 25 s in control conditions (a), during bath application of 2-pyridylethylamine (b), and after washout (c) in the presence of triprolidine (10 μM). F: individual peak amplitudes monitored during the time course of the experiment in E. G: mean changes in the failure rate of minimal stimulation-evoked PSCs by bath application of 2-pyridylethylamine in the presence of triprolidine. H: mean changes in the peak amplitude of minimal stimulation-evoked PSCs by bath application of 2-pyridylethylamine in presence of triprolidine.
Fig. 8.
Fig. 8.
Effects of bath application of an H1 receptor agonist on responses in MMNs evoked by paired-pulse stimulation of the 5N. A: PSCs in an MMN evoked by paired-pulse stimulation of the 5N in control conditions (a), during bath application of 2-pyridylethylamine (100 μM, b), and after washout (c). B: PSCs in an MMN evoked by paired-pulse stimulation of the 5N in control conditions (a), during bath application of 2-pyridylethylamine (100 μM, b), and after washout (c) in the presence of triprolidine (10 μM). C: mean changes in the paired-pulse ratio by bath application of 2-pyridylethylamine. *P < 0.05, control vs. 2-pyridylethylamine, 2-pyridylethylamine vs. wash. D: mean changes in the paired-pulse ratio by bath application of 2-pyridylethylamine in the presence of triprolidine.

Similar articles

Cited by

References

    1. Appenteng K, Girdlestone D. Transneuronal transport of wheat germ agglutinin-conjugated horseradish peroxidase into trigeminal interneurones of the rat. J Comp Neurol 258: 387–396, 1987. - PubMed
    1. Arrang JM, Garbarg M, Schwartz JC. Autoregulation of histamine release in brain by presynaptic H3-receptors. Neuroscience 15: 553–562, 1985. - PubMed
    1. Arrang JM, Garbarg M, Schwartz JC. Autoinhibition of histamine synthesis mediated by presynaptic H3-receptors. Neuroscience 23: 149–157, 1987. - PubMed
    1. Baker R, Llinas R. Electronic coupling between neurons in the rat mesencephalic nucleus. J Physiol 212: 45–63, 1971. - PMC - PubMed
    1. Bell MI, Richardson PJ, Lee K. Histamine depolarizes cholinergic interneurons in the rat striatum via a H1-receptor mediated action. Br J Pharmacol 131: 1135–1142, 2000. - PMC - PubMed

Publication types

MeSH terms

LinkOut - more resources