. 2015 Apr 22;7(284):284ra59.
doi: 10.1126/scitranslmed.aaa4304.

Interferon-λ restricts West Nile virus neuroinvasion by tightening the blood-brain barrier

Affiliations

Interferon-λ restricts West Nile virus neuroinvasion by tightening the blood-brain barrier

Helen M Lazear et al. Sci Transl Med. .

Erratum in

Abstract

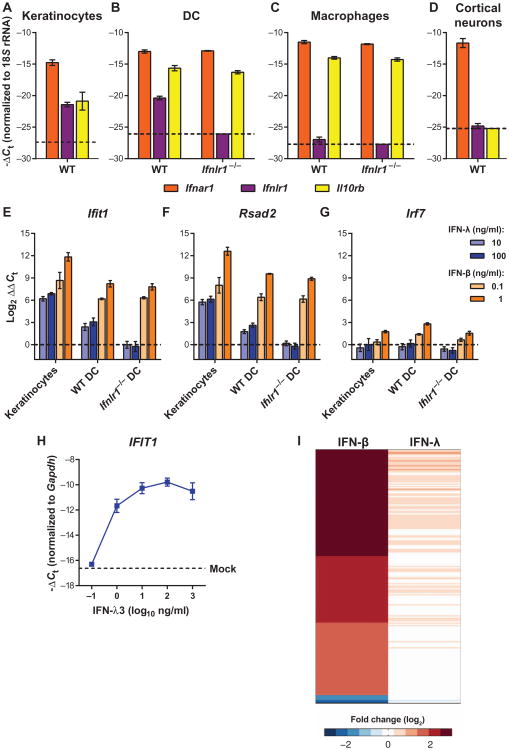
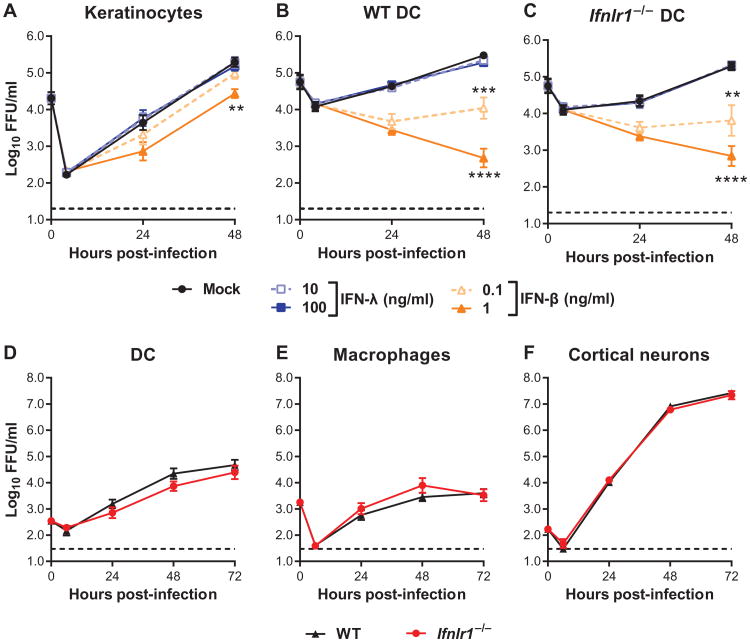
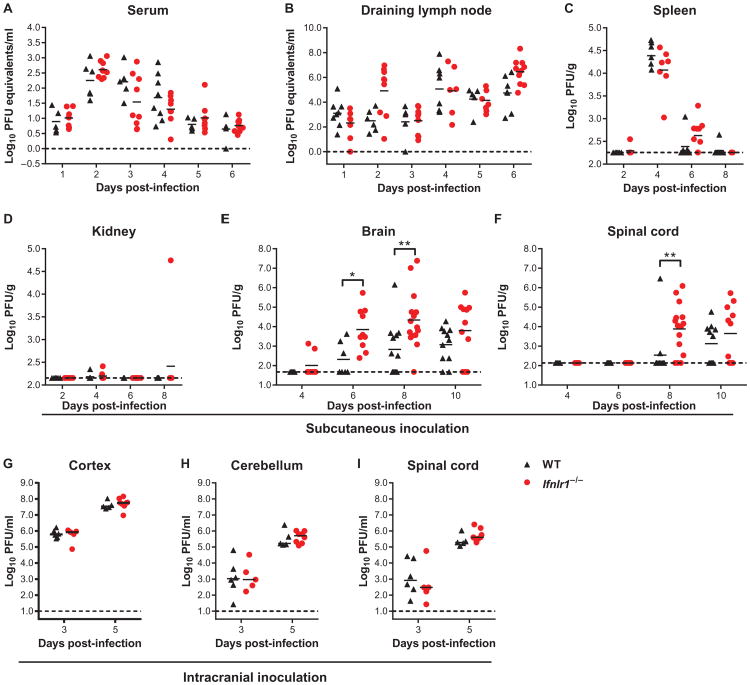
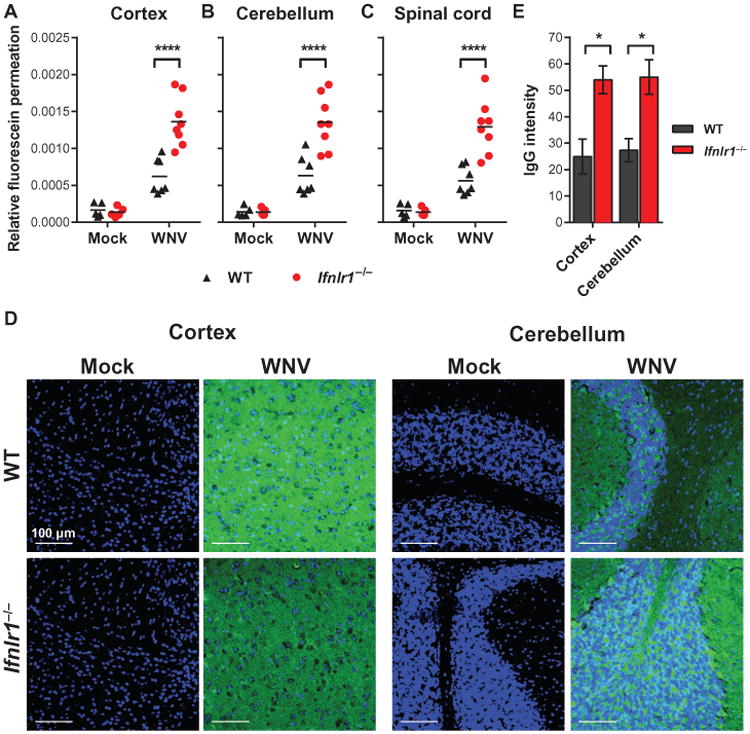
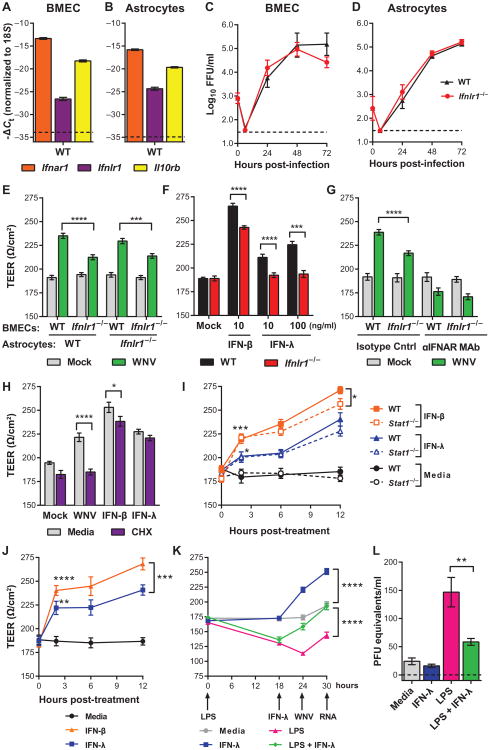
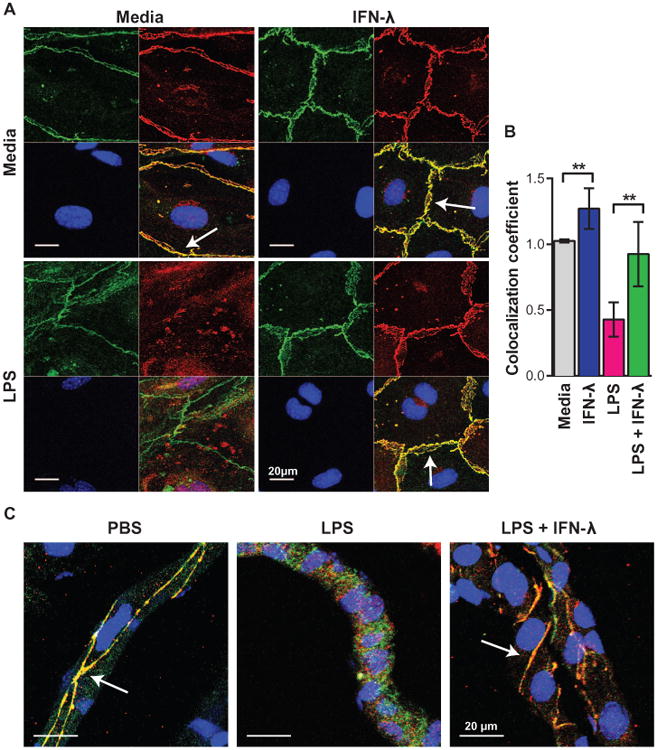
Although interferon-λ [also known as type III interferon or interleukin-28 (IL-28)/IL-29] restricts infection by several viruses, its inhibitory mechanism has remained uncertain. We used recombinant interferon-λ and mice lacking the interferon-λ receptor (IFNLR1) to evaluate the effect of interferon-λ on infection with West Nile virus, an encephalitic flavivirus. Cell culture studies in mouse keratinocytes and dendritic cells showed no direct antiviral effect of exogenous interferon-λ, even though expression of interferon-stimulated genes was induced. We observed no differences in West Nile virus burden between wild-type and Ifnlr1(-/-) mice in the draining lymph nodes, spleen, or blood. We detected increased West Nile virus infection in the brain and spinal cord of Ifnlr1(-/-) mice, yet this was not associated with a direct antiviral effect in mouse neurons. Instead, we observed an increase in blood-brain barrier permeability in Ifnlr1(-/-) mice. Treatment of mice with pegylated interferon-λ2 resulted in decreased blood-brain barrier permeability, reduced West Nile virus infection in the brain without affecting viremia, and improved survival against lethal virus challenge. An in vitro model of the blood-brain barrier showed that interferon-λ signaling in mouse brain microvascular endothelial cells increased transendothelial electrical resistance, decreased virus movement across the barrier, and modulated tight junction protein localization in a protein synthesis- and signal transducer and activator of transcription 1 (STAT1)-independent manner. Our data establish an indirect antiviral function of interferon-λ in which noncanonical signaling through IFNLR1 tightens the blood-brain barrier and restricts viral neuroinvasion and pathogenesis.


Figures

Fig. 1
Fig. 1. IFN-λ produces cell type–restricted induction of ISGs
(A to D) Expression of Ifnar1, Ifnlr1, and Il10rb was measured by qRT-PCR from uninfected mouse keratinocytes, DCs, macrophages, orcortical neurons. Gene expression was normalized to 18S ribosomal RNA (rRNA). Dotted lines indicate the sensitivity of the assay. WT, wild type. (E to G) Mouse keratinocytes and DCs were treated with murine IFN-λ3 or IFN-β for 6 hours. Expression of Ifit1, Rsad2, and Irf7 was measured by qRT-PCR. Gene expression was normalized to 18S rRNA and to mock-treated cells. Results represent means ± SEM of nine samples from three independent experiments. Dotted lines indicate gene expression in mock-treated cells. (H) Mouse keratinocytes were treated with IFN-λ3 for 6 hours, and expression of Ifit1 was measured by qRT-PCR. Gene expression was normalized to Gapdh. The dotted line represents gene expression in mock-treated cells. Results represent means ± SEM of 2 to 10 samples from three independent experiments. (I) Mouse DCs were treated with IFN-λ3 (10 ng/ml) or IFN-β (20 ng/ml) for 6 hours. Total RNA was analyzed by RNA-seq. Genes that were induced or repressed by more than threefold (relative to mock-treated) are shown in a heatmap representation.
Fig. 2
Fig. 2. IFN-λ does not directly inhibit WNV infection
(A to C) Mouse keratinocytes and DCs were pretreated with murine IFN-λ3 or IFN-β for 6 hours and then infected with WNV at a multiplicity of infection (MOI) of 0.1. Viral infection was measured by focus-forming assay and expressed as focus-forming units (FFU) per milliliter. (D to F) Primary cells prepared from WT or Ifnlr1−/− mice were infected with WNV. Results represent means ± SEM of nine samples from three independent experiments. Dotted lines indicate the sensitivity of the assay. Viral titers in IFN- treated cells were compared to mock-treated cells [two-way analysis of variance (ANOVA)]. (A) **P = 0.0057. (B) ***P = 0.0004, ****P < 0.0001. (C) **P= 0.0075, ****P < 0.0001. (D to F) The differences between WT and Ifnlr1−/− cells were not statistically significant (two-way ANOVA).
Fig. 3
Fig. 3. Viral burden in WT and Ifnlr1−/− mice
(A to I) Nine- to 12-week-old mice were infected with 102 plaque-forming units (PFU) of WNV via subcutaneous injection (A to F) or 101 PFU via intracranial injection (G to I). (A and B) Viral RNA was measured by qRT-PCR. (C to F) Viral titers were measured by plaque assay. Symbols represent individual mice from several independent experiments; bars indicate the mean of 5 to 15 mice per group. (G to I) Viral infection in CNS tissues was measured by plaque assay. Bars indicate the mean of five to six mice per group from two independent experiments. Dotted lines represent the limit of sensitivity of the assay. Viral titers in WT and Ifnlr1−/− mice were compared by the Mann-Whitney test (A to F) or t test (G to I). (E) *P = 0.0124, **P = 0.0045. (F) **P = 0.0031.
Fig. 4
Fig. 4. Cellular immune responses in WT and Ifnlr1−/− mice
(A to T) Leukocytes were harvested from the spleen (A to J) and brain (K to T) 8 days after WNV infection. Cells were stained with antibodies against CD45, CD19, CD11b, CD11c, CD3, CD4, CD8, and granzyme B. Cells were either stained with a tetramer displaying the immunodominant WNV peptide (Db-NS4B) (E and O) or restimulated with NS4B peptide and then stained with antibodies against IFN-γ and TNF-α (G, H, Q, and R). Total numbers of the indicated cell populations are shown. IFN-γ and TNF-α production is expressed as geometric mean fluorescence intensity (GMFI). Symbols represent individual mice, and data are combined from two independent experiments. The differences between WT and Ifnlr1−/− mice were not significant (Mann-Whitney test). Representative flow cytometry plots showing CD8+ and NS4B+ cells (I and S) or CD8+ and IFN-γ+ cells (J and T). Numbers indicate the percentage of cells in each quadrant, and the results are representative of two independent experiments.
Fig. 5
Fig. 5. BBB permeability in infected WT and Ifnlr1−/− mice
WT and Ifnlr1−/− mice were infected via a subcutaneous route with WNV or diluent (mock). (A to C) BBB permeability was assessed at 4 days after infection by measuring the accumulation of sodium fluorescein dye in CNS tissues after intraperitoneal administration. Symbols represent individual animals from two independent experiments. ****P < 0.0001 (t test). (D and E) Brain sections were stained to detect endogenous IgG leakage into the CNS parenchyma (shown in green); nuclei are shown in blue. Representative images were taken at×40 magnification (scale bars, 100 mm). (E) IgG staining was quantified from two fields from three mice per group and compared by t test. Cortex: *P = 0.0263; cerebellum: *P = 0.0241.
Fig. 6
Fig. 6. IFN-λ increases TEER in BMECs
(A and B) Expression of Ifnar1, Ifnlr1, and Il10rb was measured by qRT-PCR from WT uninfected BMECs and astrocytes. Gene expression was normalized to 18S rRNA. (C and D) BMECs and astrocytes prepared from WT and Ifnlr1−/− mice were infected with WNV, and viral replication was measured by focus-forming assay (expressed as focus-forming units per milliliter). Results represent means ±SEM of nine samples from three experiments. The differences between WT and Ifnlr1−/− cells were not significant (two-way ANOVA). (E to I) WT or Ifnlr1−/− BMECs were cultured on Transwell inserts with astrocytes prepared from WT (E, left; and F to I) or Ifnlr1−/−(E, right) mice. Results represent means ± SEM of nine samples from two experiments. (E) BMECs were infected with WNV, and TEER was measured 6 hours later. WNV-infected WT BMECs were compared to Ifnlr1−/− BMECs (t test). ****P < 0.0001, ***P = 0.0006. (F) BMECs were treated with murine IFN-β or IFN-λ3, and TEER was measured 6 hours later. WT BMECs were compared to Ifnlr1−/− BMECs (t test). IFN-β and IFN-λ (10 ng/ml): ****P < 0.0001. IFN-λ (100 ng/ml): ***P = 0.0003. (G) BMECs were pretreated with an IFNAR-blocking or isotype control monoclonal antibody (MAb) and then infected with WNV. TEER was measured 6 hours after infection. WT BMECs were compared to Ifnlr1−/− BMECs (t test). ****P < 0.0001. (H) WT BMECs were pretreated with cycloheximide (CHX) (20 μg/ml) for 18 hours and then infected with WNV or treated with murine IFN-β (10 ng/ml) or IFN-λ3 (100 ng/ml). TEER was measured 6 hours later. CHX-treated BMECs were compared to media-treated cells (t test). ****P < 0.0001, *P = 0.009. (I) BMECs were prepared from WT and Stat1−/− mice and treated with murine IFN-β or IFN-λ3, and TEER was measured 2, 6, and 12 hours after treatment. Results represent means ± SEM of six samples from two experiments. IFN-treated BMECs were compared to vehicle-treated cells of the same genotype at 2 hours after treatment (t test). IFN-β: ***P = 0.0005 (WT), ***P < 0.0001 (Stat1−/−). IFN-λ: *P = 0.0204 (WT), *P = 0.0347 (Stat1−/−). WT and Stat1−/− cells were compared by two-way ANOVA. IFN-β: *P = 0.0311. (J) HCMEC/D3 cells were cultured on Transwell inserts and treated with human IFN-β (10 ng/ml) or pegylated human IFN-λ1 (100 ng/ml), and TEER was measured. Results represent means ± SEM of eight samples from two experiments. IFN-treated cells were compared to vehicle-treated cells at 2 hours after treatment (t test). IFN-β: ****P < 0.0001. IFN-λ: **P = 0.0011. IFN-β– and IFN-λ–treated cells were compared by two-way ANOVA. ***P = 0.0006. (K and L) HCMEC/D3 cells were pretreated for 18 hours with LPS (100 ng/ml) or media as control, followed by pegylated human IFN-λ1 (100 ng/ml) for 6 hours (or media). The cells were then infected with WNV at an MOI of 0.01 from the upper chamber. TEER was measured over the course of the experiment (K); at 6 hours after infection, virus crossing into the lower chamber was measured by qRT-PCR (L). Results represent means ± SEM of 12 samples from three experiments. (K) IFN-λ treatment was compared to media or LPS treatment by two-way ANOVA (K) or t test (L). ****P < 0.0001, **P = 0.0047.
Fig. 7
Fig. 7. Cell junction protein localization in endothelial cells
(A and B) WT BMECs were pretreated for 18 hours with LPS (100 ng/ml) and subsequently treated with murine IFN-λ3 (100 ng/ml) for 6 hours. (C) WT mice were treated with LPS (3 mg/kg via an intraperitoneal route), LPS and pegylated murine IFN-λ2 (25 μg via intravenous route), or phosphate-buffered saline (PBS) alone. (A to C) Cells and brain sections were costained for the cell junction proteins ZO-1 (green) and claudin-5 (red); nuclei are shown in blue. Images were taken by confocal microscopy at ×63 magnification (scale bars, 20 mm). Arrows indicate ZO-1 and claudin-5 colocalization at intact tight junctions. Results are representative of two independent experiments. (B) Colocalization of ZO-1 and claudin-5 staining was determined using ImageJ software and compared by t test. Media versus IFN-λ: **P = 0.0033. LPS versus LPS + IFN-λ: **P = 0.0014.
Fig. 8
Fig. 8. IFN-λ enhances BBB tightness and restricts WNV neuroinvasion
(A to C) Eight-week-old WT mice were treated with LPS, LPS and pegylated murine IFN-λ2 (25 mg via intravenous route), or PBS alone. BBB permeability was assessed 24 hours later by fluorescein or IgG permeation as described for Fig. 5. Symbols represent individual animals from two independent experiments. Values for LPS-treated mice were compared to mice receiving LPS + IFN-λ (t test). (A) Cortex: ****P < 0.0001, cerebellum: **P = 0.0096, spinal cord: **P = 0.0082. (C) Cortex: *P = 0.0348, cerebellum: *P = 0.0168. (D and E) Five-week-old WT mice were infected with 102 PFU of WNV via a subcutaneous route. On the day of infection and at days 2 and 4 afterward, 20 μg of pegylated murine IFN-λ2 protein (or PBS) was administered via an intravenous route. (D) Viral RNA in the plasma was measured on days 2 and 4 after infection. (E) Survival was monitored for 21 days after infection. n = 22 mice, *P = 0.0264 (log-rank test). (F and G) Nine-week-old WT mice were infected with 102 PFU of WNV via a subcutaneous route. At days 2, 3, and 4, 25 μg of pegylated murine IFN-λ2 protein (or PBS) was administered via an intravenous route. (F) Viral RNA in the plasma was measured on days 3,4, and5. (G) Viral burdeninthe CNS was measured by plaque assayatday 8. Symbols represent individual animals. Dotted lines represent the limit of sensitivity of the assay. ***P = 0.0009 (Mann-Whitney test).

Comment in

  • Is the third interferon a charm?
    Best SM. Best SM. Sci Transl Med. 2015 Apr 22;7(284):284fs16. doi: 10.1126/scitranslmed.aaa2817. Epub 2015 Apr 22. Sci Transl Med. 2015. PMID: 25904738

References

    1. Donnelly RP, Kotenko SV. Interferon-lambda: A new addition to an old family. J Interferon Cytokine Res. 2010;30:555–564. - PMC - PubMed
    1. Ank N, Iversen MB, Bartholdy C, Staeheli P, Hartmann R, Jensen UB, Dagnaes-Hansen F, Thomsen AR, Chen Z, Haugen H, Klucher K, Paludan SR. An important role for type III interferon (IFN-λ/IL-28) in TLR-induced antiviral activity. J Immunol. 2008;180:2474–2485. - PubMed
    1. Sommereyns C, Paul S, Staeheli P, Michiels T. IFN-lambda (IFN-λ) is expressed in a tissue-dependent fashion and primarily acts on epithelial cells in vivo. PLOS Pathog. 2008;4:e1000017. - PMC - PubMed
    1. Mordstein M, Neugebauer E, Ditt V, Jessen B, Rieger T, Falcone V, Sorgeloos F, Ehl S, Mayer D, Kochs G, Schwemmle M, Günther S, Drosten C, Michiels T, Staeheli P. Lambda interferon renders epithelial cells of the respiratory and gastrointestinal tracts resistant to viral infections. J Virol. 2010;84:5670–5677. - PMC - PubMed
    1. Pott J, Mahlakõiv T, Mordstein M, Duerr CU, Michiels T, Stockinger S, Staeheli P, Hornef MW. IFN-λ determines the intestinal epithelial antiviral host defense. Proc Natl Acad Sci USA. 2011;108:7944–7949. - PMC - PubMed

Publication types

MeSH terms