. 2015 Apr 22;35(16):6335-49.
doi: 10.1523/JNEUROSCI.0971-14.2015.

Population responses in V1 encode different figures by response amplitude

Affiliations

Population responses in V1 encode different figures by response amplitude

Ariel Gilad et al. J Neurosci. .

Abstract

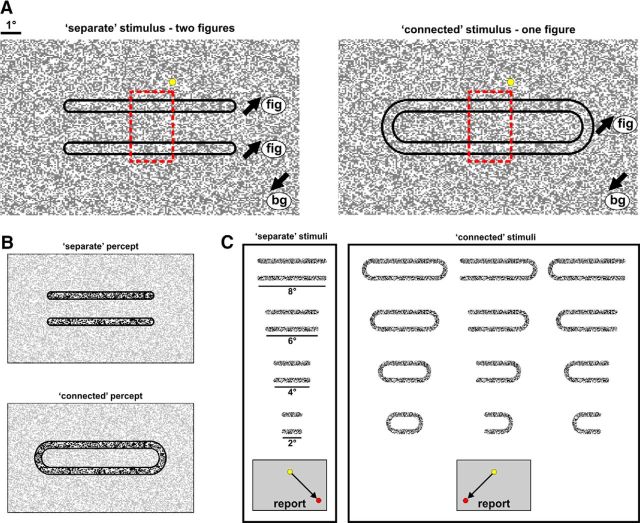
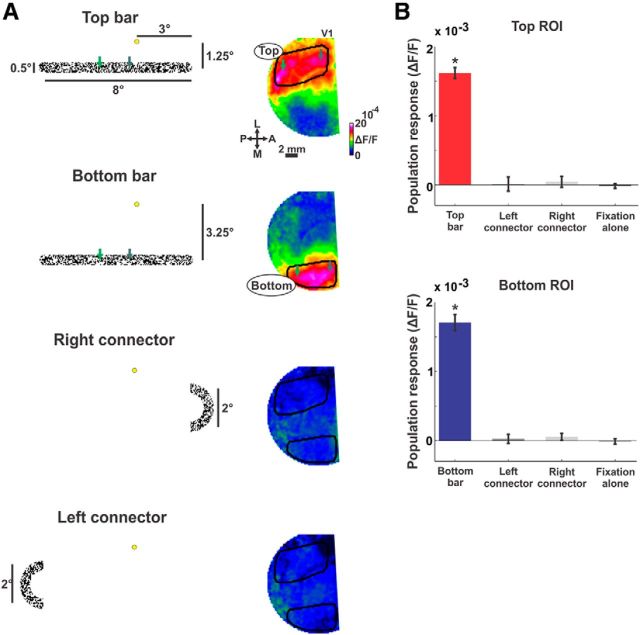
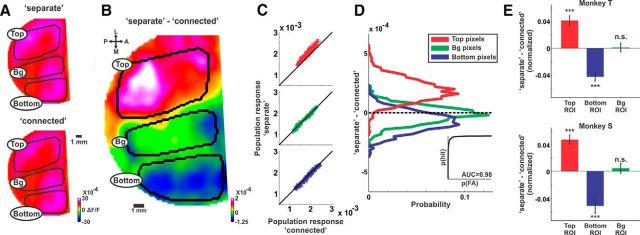
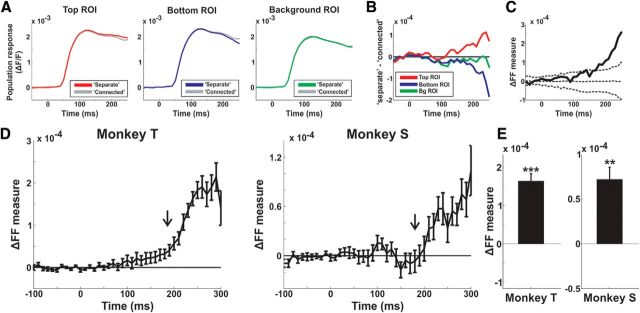
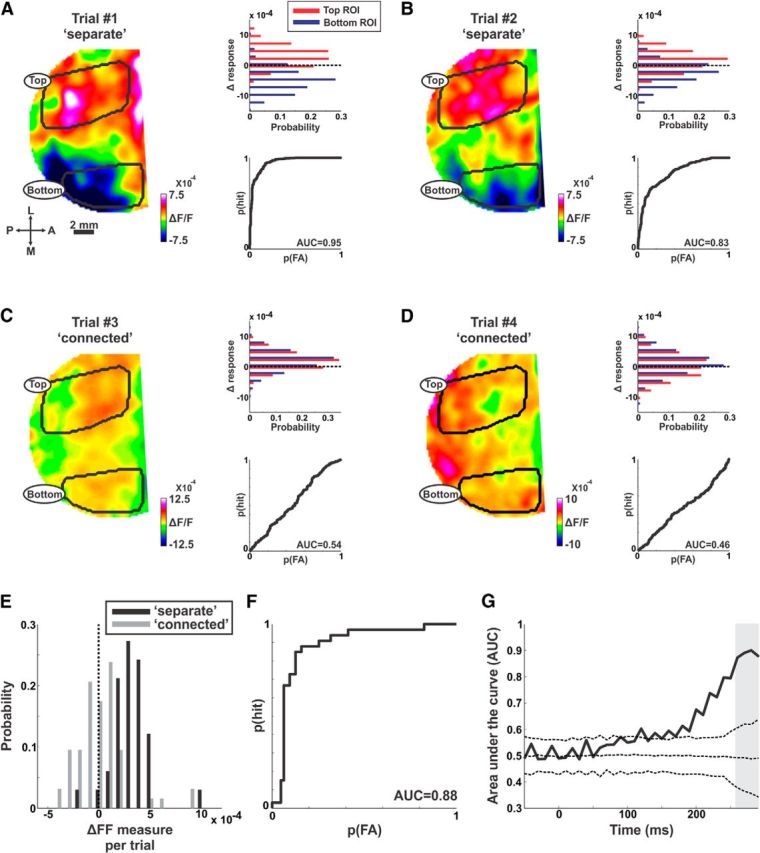
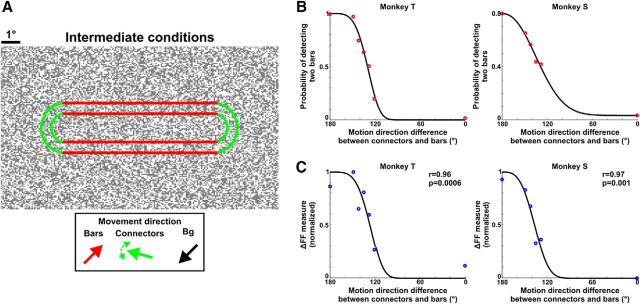
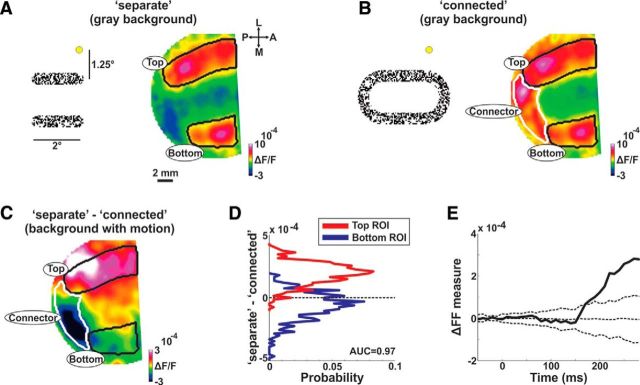
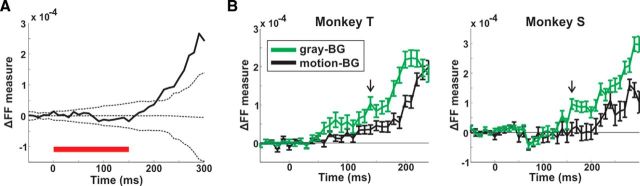
The visual system simultaneously segregates between several objects presented in a visual scene. The neural code for encoding different objects or figures is not well understood. To study this question, we trained two monkeys to discriminate whether two elongated bars are either separate, thus generating two different figures, or connected, thus generating a single figure. Using voltage-sensitive dyes, we imaged at high spatial and temporal resolution V1 population responses evoked by the two bars, while keeping their local attributes similar among the two conditions. In the separate condition, unlike the connected condition, the population response to one bar is enhanced, whereas the response to the other is simultaneously suppressed. The response to the background remained unchanged between the two conditions. This divergent pattern developed ∼200 ms poststimulus onset and could discriminate well between the separate and connected single trials. The stimulus separation saliency and behavioral report were highly correlated with the differential response to the bars. In addition, the proximity and/or the specific location of the connectors seemed to have only a weak effect on this late activity pattern, further supporting the involvement of top-down influences. Additional neural codes were less informative about the separate and connected conditions, with much less consistency and discriminability compared with a response amplitude code. We suggest that V1 is involved in the encoding of each figure by different neuronal response amplitude, which can mediate their segregation and perception.

Keywords: amplitude code; behaving monkeys; figure ground; object representation; primary visual cortex; voltage-sensitive dye imaging.


Figures

Figure 1.
Figure 1.
Behavioral paradigm and stimuli. A, The monkeys were presented with a pattern of random moving dots during fixation (yellow point denotes fixation point). Black arrows denote the motion direction. Left, Separate condition: two separate and elongated subgroups of dots moved in a common direction (fig) that was opposite to the motion direction of the background dots (bg). Right, Connected condition: the same two bars were connected by remote circular connectors with the same motion parameters. The dashed red rectangle, added only for illustration, approximately outlines the stimulus part that was retinotopically mapped onto the imaged V1 area. B, The outcome perception of the stimuli in A, highlighted with higher contrast. C, To generalize the task over separate and connected conditions, we used a set of different stimuli for each group (shown here without background for visualization purposes only). The monkeys were required to report whether the bars were connected (right box) or not (left box) regardless of their length, position, or connectivity type. The direction of saccadic report for each condition is depicted at the bottom.
Figure 2.
Figure 2.
The imaged area in V1 is activated by both bars but not by the connectors. A, Maps of population response (right column) obtained by presenting each of the different parts of the stimulus (left column). From top to bottom (yellow dot depicts the fixation point): top bar, bottom bar, right connector, and left connector. Color denotes normalized fluorescence (ΔF/F). The areas activated by the top and bottom bars are approximately outlined in black on the relevant maps. The green arrows depict coordinates on the bars: in the visual field (left) and approximately on the imaged V1 area (right). B, Population response in the different ROIs (ROIs include pixels passing SNR threshold within the outlined areas in A; see Materials and Methods). Top, The mean population response (averaged between 150 and 300 ms after stimulus onset; also verified for earlier times: 80–150 ms), in the top ROI obtained by presenting the top bar (red), left connector (dark gray), right connector (light gray) or fixation alone (black; no stimulus presentation). Bottom, The average (as above) population response in the bottom ROI obtained by presenting the bottom bar (blue), left connector (dark gray), right connector (light gray), or fixation alone (black; no stimulus presentation). Error bars are SEM over recording sessions (n = 6 in Monkey T); *p < 0.05.
Figure 3.
Figure 3.
Separate response relative to connected response: population responses is enhanced for the top bar and suppressed for the bottom bar. A, The mean activation maps (averaged at 200–250 ms after stimulus onset) in the separate (top) and connected (bottom) conditions in one recording session (n = 124 and 128 trials in the separate and connected conditions respectively). The areas activated by the top and bottom bars as well as background (Bg) area are approximately outlined in black. B, The differential map (population response in the separate condition minus the population response in the connected condition) of the maps in A. C, Scatter plots of the population response in pixels, for B: top outlined area (red, top), background outlined area (green, middle), and the bottom outlined area (blue, bottom). Each dot depicts the population response (ΔF/F) in one pixel for the separate (y-axis) versus the population response in the connected (x-axis). D, Histogram of the differential response shown in B for the top (red), background (green), and bottom (red) outlined areas. The histogram shows the differential response of pixels, comprising each of the outlined areas. The ROC curve between top and bottom distributions is shown in the inset (AUC = 0.98). E, Grand average of the normalized differential response for each ROI averaged at the late phase (220–350 ms) shown for both monkeys (each trial was normalized to the mean activity in the 3 ROIs; see Materials and Methods). Error bars are SEM over recording sessions (n = 24 and 13 for Monkeys T and S, respectively); ***p < 0.001. n.s., Not significant.
Figure 4.
Figure 4.
Dynamics of ΔFF. A, The population response in the top (red), bottom (blue), and background (green) ROIs for the separate and connected (gray) conditions in an example recording session. B, The difference (separate minus connected) of the responses in A for the top (red), bottom (blue), and background (green) ROIs. C, The ΔFF as a function of time in the example recording session from B (red curve minus blue curve in B). The dashed lines are mean ± 2STD for the ΔFF calculated on shuffled trials (see Materials and Methods). D, The grand average ΔFF as a function of time for each monkey (n = 24 and 13 for Monkeys T and S, respectively). Error bars are SEM over recording sessions. The black arrow indicates the median latency of the ΔFF measure. E, The grand average ΔFF, averaged at late times (220–350 ms) for each monkey. Error bars are as in D; **p < 0.01;***p < 0.001.
Figure 5.
Figure 5.
ΔFF measure is informative at the single trial level. An example from a typical recording session. A, B, Two example trials from the separate condition. Left, ΔResponse maps in the late phase (the mean population response in the connected condition was subtracted from each map). Top, Right, Distribution histograms of the Δresponse in the maps on the left. Each distribution shows Δresponse in pixels belonging the top ROI (red) and bottom ROI (blue). Bottom, Right, The ROC curves derived from the histograms in the top right panels. C, D, Same as in A, B, but for two example trials in the connected condition. E, Histograms of the ΔFF for single trials (averaged at 260–300 ms; gray bar in G; see Materials and Methods) in the separate (black; n = 124 trials) and connected (gray; n = 128 trials) conditions. F, The ROC curve (black) derived from the histogram in (E) between the ΔFF computed for separate and connected trials; AUC = 0.88. G, The AUC as a function of time. The ROC curve was calculated as in F but for each time frame after which the AUC was obtained. The dashed curves display the shuffled AUC (mean ± 2STD) derived from the shuffled data in which trials were given a random label.
Figure 6.
Figure 6.
ΔFF measure is correlated with the separation saliency of the two bars and the monkeys' perceptual report. A, In another set of experiments we presented the monkeys with a set of stimuli in which we varied the motion direction of the dots in the connectors (outlined in green) relative to motion direction in the bars' (outlined in red; see Materials and Methods). As the connectors' direction became less similar to the bars' direction and more similar to the background's direction, the saliency of the two separate bars increased. B, The psychometric curve of Monkeys T (left) and S (right) displaying the probability of detecting two bars as a function of the connectors' direction (relative to the bars' direction; n = 5 and 4 recording sessions for Monkeys T and S, respectively). Points were fitted with a Weibull function (black curve). C, The neurometric curve for Monkeys T (left) and S (right) calculated for the ΔFF as a function of the motion direction difference between connectors and bars (same data as in B). Data were normalized between 0 and 1 for each recording session (Materials and Methods). Points are fitted with a Weibull function.
Figure 7.
Figure 7.
ΔFF is also present in a close proximity to the connectors. A, A map of population response (right) obtained by presenting the two bars (2° length) with a gray background (left; dot depicts the fixation point). Color denotes ΔF/F. The top and bottom areas are approximately outlined in black. B, A map of population response (right) obtained by presenting the two connected bars with a gray background (left). In this case, the left connector is also imaged (outlined in white). C, The differential map for the example in A, B, but with a motion background (as in Fig. 3A). Despite the close proximity of the connector, the top ROI exhibits positive values whereas the bottom ROI exhibit slightly negative values. The connector ROI (white outline; Present only in the connected condition) shows negative ΔF/F values as expected. D, Histogram of the differential response of pixels shown in C for the top ROI (red) and the bottom ROI (blue). E, The ΔFF as a function of time (as in Fig. 4D) for the example in C (n = 56 trials). The dashed lines are mean ± 2STD for the ΔFF calculated on shuffled trials.
Figure 8.
Figure 8.
ΔFF dynamics on other stimulus conditions. A, Dynamics of ΔFF (as in Fig. 4D) induced by shorter stimulus presentation (150 ms; red bar at the bottom) in an example recording session (n = 124 trials). The dashed lines are mean ± 2STD for the ΔFF computed on trials with random label shuffling. B, ΔFF dynamics when presenting the bars on a gray background (gray-BG; green curve; no motion in the background) or background with motion (motion-BG; black curve). Monkey T is on the left and Monkey S is on the right. Error bars are SEM over trials (n = 190/167 and 187/124 trials in gray-BG and motion-BG respectively; Monkeys T/S). The arrow indicates the first time frame with a significant difference between conditions (140 and 160 ms in Monkeys T and S, respectively; Mann–Whitney U test; p < 0.05).

Comment in

Similar articles

Cited by

References

    1. Angelucci A, Levitt JB, Walton EJ, Hupe JM, Bullier J, Lund JS. Circuits for local and global signal integration in primary visual cortex. J Neurosci. 2002;22:8633–8646. - PMC - PubMed
    1. Arieli A, Shoham D, Hildesheim R, Grinvald A. Coherent spatiotemporal patterns of ongoing activity revealed by real-time optical imaging coupled with single-unit recording in the cat visual cortex. J Neurophysiol. 1995;73:2072–2093. - PubMed
    1. Arieli A, Grinvald A, Slovin H. Dural substitute for long-term imaging of cortical activity in behaving monkeys and its clinical implications. J Neurosci Methods. 2002;114:119–133. doi: 10.1016/S0165-0270(01)00507-6. - DOI - PubMed
    1. Ayzenshtat I, Meirovithz E, Edelman H, Werner-Reiss U, Bienenstock E, Abeles M, Slovin H. Precise spatiotemporal patterns among visual cortical areas and their relation to visual stimulus processing. J Neurosci. 2010;30:11232–11245. doi: 10.1523/JNEUROSCI.5177-09.2010. - DOI - PMC - PubMed
    1. Ayzenshtat I, Gilad A, Zurawel G, Slovin H. Population response to natural images in the primary visual cortex encodes local stimulus attributes and perceptual processing. J Neurosci. 2012;32:13971–13986. doi: 10.1523/JNEUROSCI.1596-12.2012. - DOI - PMC - PubMed

Publication types

LinkOut - more resources