. 2015 Apr 22;35(16):6401-12.
doi: 10.1523/JNEUROSCI.4208-14.2015.

Costimulation of AMPA and metabotropic glutamate receptors underlies phospholipase C activation by glutamate in hippocampus

Affiliations

Costimulation of AMPA and metabotropic glutamate receptors underlies phospholipase C activation by glutamate in hippocampus

Hye-Hyun Kim et al. J Neurosci. .

Abstract

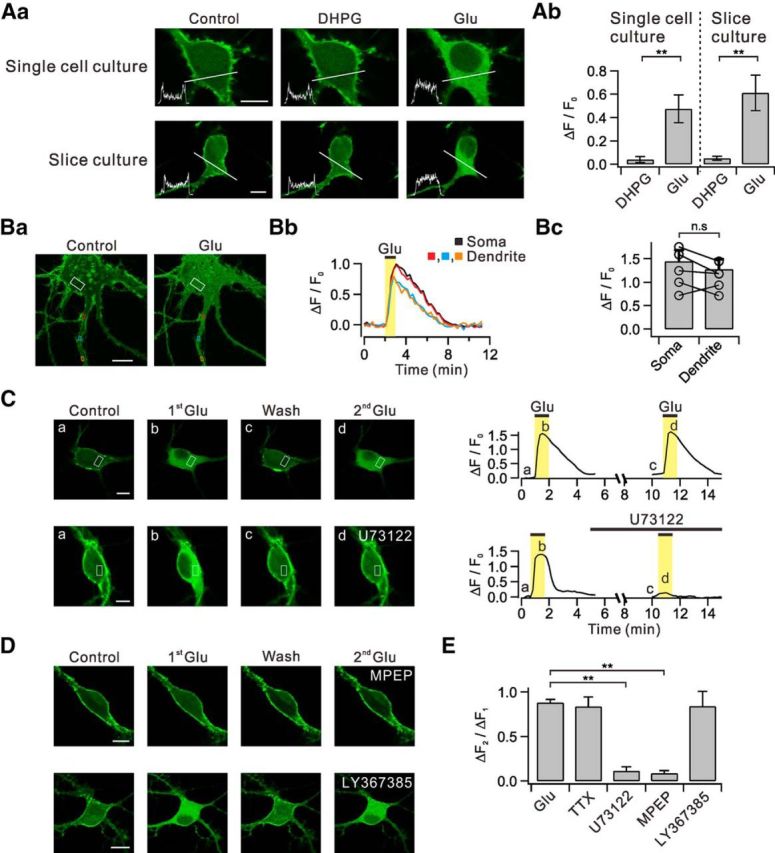
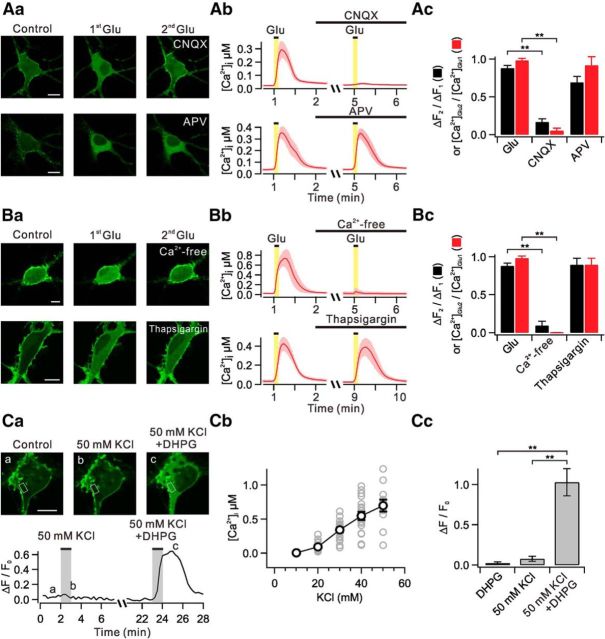
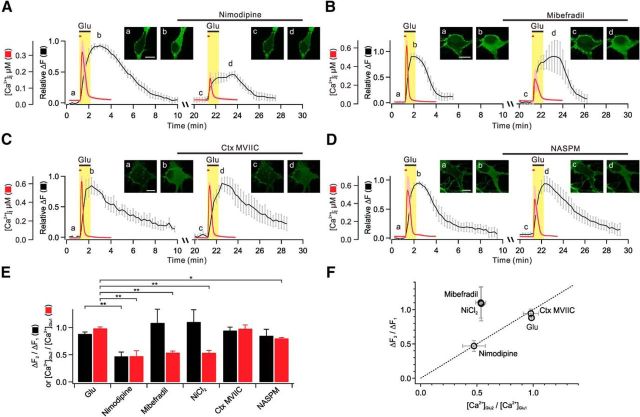
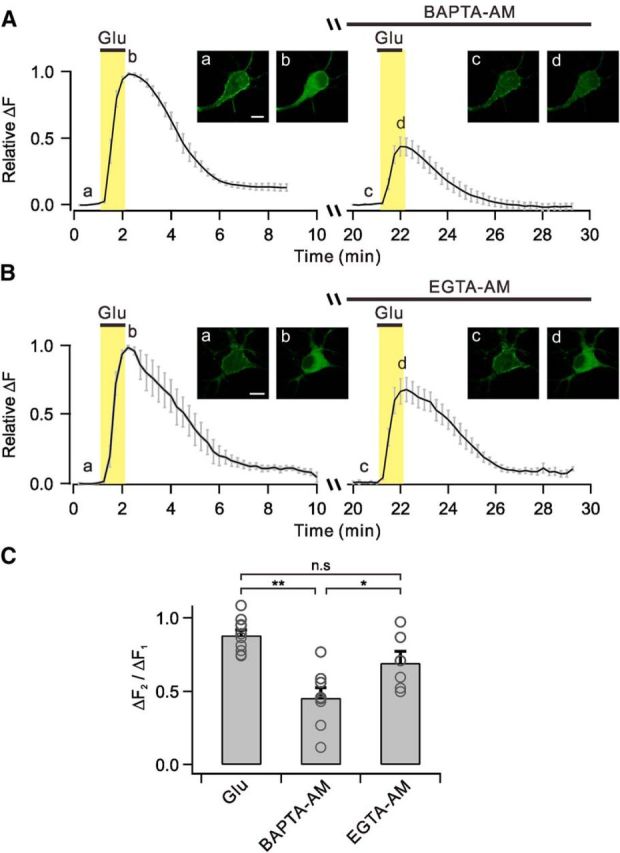
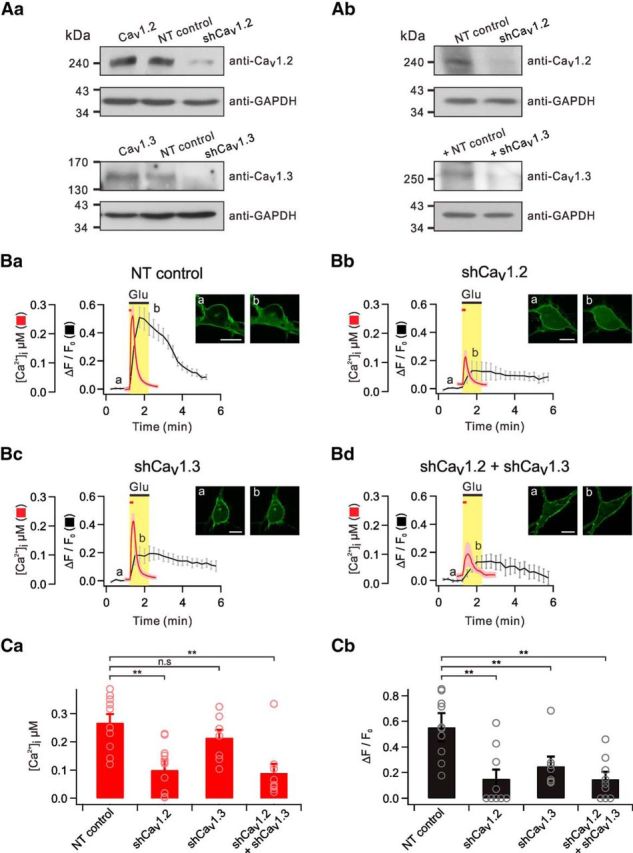
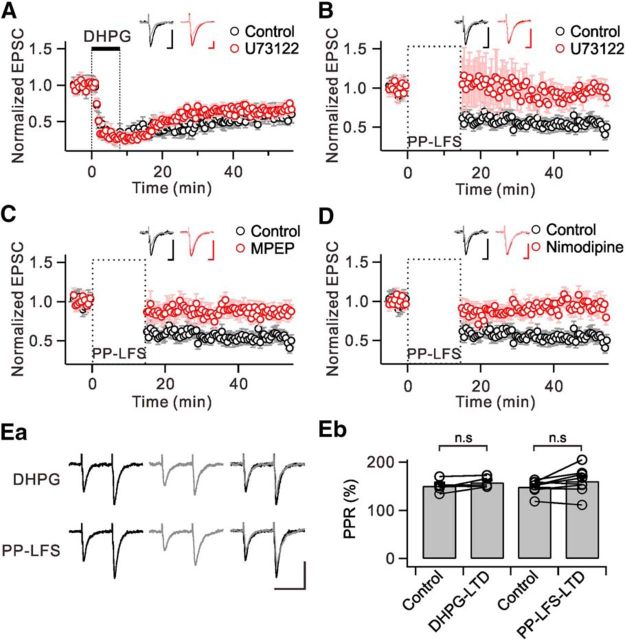
Glutamate, a major neurotransmitter in the brain, activates ionotropic and metabotropic glutamate receptors (iGluRs and mGluRs, respectively). The two types of glutamate receptors interact with each other, as exemplified by the modulation of iGluRs by mGluRs. However, the other way of interaction (i.e., modulation of mGluRs by iGluRs) has not received much attention. In this study, we found that group I mGluR-specific agonist (RS)-3,5-dihydroxyphenylglycine (DHPG) alone is not sufficient to activate phospholipase C (PLC) in rat hippocampus, while glutamate robustly activates PLC. These results suggested that additional mechanisms provided by iGluRs are involved in group I mGluR-mediated PLC activation. A series of experiments demonstrated that glutamate-induced PLC activation is mediated by mGluR5 and is facilitated by local Ca(2+) signals that are induced by AMPA-mediated depolarization and L-type Ca(2+) channel activation. Finally, we found that PLC and L-type Ca(2+) channels are involved in hippocampal mGluR-dependent long-term depression (mGluR-LTD) induced by paired-pulse low-frequency stimulation, but not in DHPG-induced chemical LTD. Together, we propose that AMPA receptors initiate Ca(2+) influx via the L-type Ca(2+) channels that facilitate mGluR5-PLC signaling cascades, which underlie mGluR-LTD in rat hippocampus.

Keywords: Cav1.2; Cav1.3; confocal imaging; electrophysiology; local calcium; mGluR-LTD.


Figures

Figure 1.
Figure 1.
Glutamate, but not DHPG, induces translocation of PHδ-GFP via the mGluR5-PLC pathways. Aa, Dissociated hippocampal neurons in primary culture (single-cell culture) transfected with PHδ-GFP showed prominent green fluorescence signals in plasma membrane versus cytosol (Control). DHPG and glutamate (Glu) was applied to bath to see whether they induce PHδ-GFP translocation. Line profiles of fluorescence intensity (insets) were obtained across the white lines. Similar series of experiments were performed with hippocampal neurons in organotypic slice culture transfected with PHδ-GFP. Ab, Summary data showing the relative amplitudes of DHPG-induced and glutamate-induced PHδ-GFP translocation (ΔF/F0) in single-cell and slice culture conditions. Ba, Glutamate-induced PHδ-GFP translocation (ΔF/F0) was measured in ROIs of somatic cytosol (white) and multiple regions of dendritic cytosol (red, blue, and orange). Bb, Time courses of ΔF/F0 measured in designated ROIs. Bc, Bar graphs summarize the amplitudes of DHPG-induced or glutamate-induced PHδ-GFP translocation in soma and dendrites. C, Consecutive applications of 30 μm glutamate in control and in the presence of U73122. Images of PHδ-GFP-transfected neurons (left) and time courses of ΔF/F0 measured in designated ROIs (right). D, Effect of specific blockers for mGluR5 or mGluR1 on PHδ-GFP translocation. E, Bar graphs summarize ΔF2F1 in the presence of tetrodotoxin (TTX) and other experimental conditions described in C and D. n.s p > 0.05; **p < 0.01. Scale bar, 10 μm in all panels where indicated. Error bars represent SEM.
Figure 2.
Figure 2.
Ca2+ influx triggered by AMPA receptor activation facilitates glutamate-induced PHδ-GFP translocation. Aa, Images demonstrate glutamate-induced translocation of PHδ-GFP in the presence of CNQX (AMPA receptor blocker) and APV (NMDA receptor blocker). Ab, Glutamate-induced [Ca2+]i in the presence of CNQX and APV. Error bars are shown in light colors. Ac, Bar graphs summarize mean ΔF2F1 (black) and [Ca2+]Glu2/[Ca2+]Glu1 (red). Ba, Images demonstrate glutamate-induced translocation of PHδ-GFP in Ca2+-free solutions or in the presence of thapsigargin (a sarco-endoplasmic reticulum Ca2+-ATPase blocker). Bb, Glutamate-induced [Ca2+]i in experimental conditions described in Ba. Bc, Bar graphs summarize mean ΔF2F1 (black) and [Ca2+]Glu2/[Ca2+]Glu1 (red). Ca, Images of PHδ-GFP translocation induced by 50 mm KCl only or 50 mm KCl plus DHPG (top) and time courses of ΔF/F0 measured in designated ROIs (bottom). Cb, Plot of [Ca2+]i versus different concentrations of KCl. Gray circles represent individual data. Cc, ΔF/F0 values are summarized in bar graph in experimental conditions described in Ca. **p < 0.01. Scale bar, 10 μm in all panels where indicated. Error bars represent SEM.
Figure 3.
Figure 3.
L-type Ca2+ channels provide Ca2+ for glutamate-induced PHδ-GFP translocation. A–D, Averages of glutamate-induced [Ca2+]i (red) and relative ΔF (black) are plotted against time for two successive applications of glutamate (first applications are glutamate only, and second applications are glutamate plus L-type, T-type, or N/P/Q-type Ca2+ channel blockers, or Ca2+-permeable AMPA receptor blocker). The time intervals of first and second glutamate applications are actual values (20 min) for ΔF, but for [Ca2+]i measurements the time intervals were 4 min, as described in Figure 2Ab: they were superimposed for comparison of time-dependent events. The insets show representative images of PHδ-GFP translocation at indicated time points (a–d). Scale bar, 10 μm. E, Bar graphs summarize mean ΔF2F1 (black) and [Ca2+]Glu2/[Ca2+]Glu1 (red). F, ΔF2F1 values are plotted versus [Ca2+]Glu2/[Ca2+]Glu1 values. Dashed line indicates linear relationship. **p < 0.01; *p < 0.05. Error bars represent SEM.
Figure 4.
Figure 4.
BAPTA, but not EGTA, inhibits glutamate-induced PHδ-GFP translocation. A–B, Averages of glutamate-induced relative ΔF are plotted against time with BAPTA-AM (A) or EGTA-AM (B) loadings before second glutamate applications. The insets show representative images of PHδ-GFP translocation at indicated time points (a–d). Scale bar, 10 μm. C, Bar graphs summarize mean ΔF2F1 in experimental conditions described in A and B. n.s p > 0.05; **p < 0.01; *p < 0.05. Error bars represent SEM.
Figure 5.
Figure 5.
Both Cav1.2 and Cav1.3 contribute to glutamate-induced PHδ-GFP translocation. Aa, Western blotting of overexpressed Cav1.2 (top) and Cav1.3 (bottom) in HEK293 cells transfected with NT control, Cav1.2 shRNA (shCav1.2), or Cav1.3 shRNA (shCav1.3). Ab, Western blotting of endogenous Cav1.2 (top) and Cav1.3 (bottom) in primary cultured hippocampal neurons transfected with NT control, shCav1.2, or shCav1.3. GAPDH served as a loading control. Ba–Bc, Average of glutamate-induced [Ca2+]i and ΔF/F0 are plotted against time in cells transfected with NT control, shCav1.2, or shCav1.3. The insets show representative images of PHδ-GFP translocation at indicated time points (a, b). Scale bar, 10 μm. C, Bar graph summarizes [Ca2+]i (Ca) or ΔF/F0 (Cb) for each group. n.s p > 0.05; **p < 0.01. Error bars represent SEM.
Figure 6.
Figure 6.
PLC is involved in mGluR-LTD induced by PP-LFS-LTD, but not in DHPG-LTD. EPSC amplitudes were normalized to the pre-DHPG or PP-LFS baseline values and were averaged. A, DHPG application induced a persistent depression of EPSC amplitude (black). Preincubation of slices in U73122 did not affect the magnitude of DHPG-LTD (red). The inset shows representative EPSCs during the baseline period (dark) and 40 min after (light) DHPG application in each condition. B, PP-LFS induced a similar magnitude of LTD compared with DHPG-LTD (black). PP-LFS-LTD was significantly blocked by U73122 (red). C, Pharmacological blockade of mGluR5 by MPEP almost completely blocked PP-LFS-LTD (red). D, PP-LFS-LTD was blocked by nimodipine (red). Insets (B–D) represent EPSCs during the baseline period (dark) and 35 min after (light) PP-LFS in each condition. Ea, Representative EPSCs elicited by paired-pulse stimulation (50 ms interval) during baseline (black, left) and after DHPG application or PP-LFS (gray, middle). Superimposed traces are shown in right panels. Scale bar, 50 ms (horizontal) and 100 pA (vertical). Eb, Bar graphs summarize paired-pulse ratio (PPR) changes in each group. n.s p > 0.05. Error bars represent SEM.

Similar articles

Cited by

References

    1. Abe T, Sugihara H, Nawa H, Shigemoto R, Mizuno N, Nakanishi S. Molecular characterization of a novel metabotropic glutamate receptor mGluR5 coupled to inositol phosphate/Ca2+ signal transduction. J Biol Chem. 1992;267:13361–13368. - PubMed
    1. Alagarsamy S, Rouse ST, Junge C, Hubert GW, Gutman D, Smith Y, Conn PJ. NMDA-induced phosphorylation and regulation of mGluR5. Pharmacol Biochem Behav. 2002;73:299–306. doi: 10.1016/S0091-3057(02)00826-2. - DOI - PubMed
    1. Alagarsamy S, Saugstad J, Warren L, Mansuy IM, Gereau RWt, Conn PJ. NMDA-induced potentiation of mGluR5 is mediated by activation of protein phosphatase 2B/calcineurin. Neuropharmacology. 2005;49(Suppl 1):135–145. - PMC - PubMed
    1. Aramori I, Nakanishi S. Signal transduction and pharmacological characteristics of a metabotropic glutamate receptor, mGluR1, in transfected CHO cells. Neuron. 1992;8:757–765. doi: 10.1016/0896-6273(92)90096-V. - DOI - PubMed
    1. Berger SM, Bartsch D. The role of L-type voltage-gated calcium channels Cav1.2 and Cav1.3 in normal and pathological brain function. Cell Tissue Res. 2014;357:463–476. doi: 10.1007/s00441-014-1936-3. - DOI - PubMed

Publication types

MeSH terms