. 2015 Apr 22;35(16):6575-83.
doi: 10.1523/JNEUROSCI.4298-14.2015.

Projection-specific characteristics of retinal input to the brain

Affiliations

Projection-specific characteristics of retinal input to the brain

Gregory Gauvain et al. J Neurosci. .

Abstract

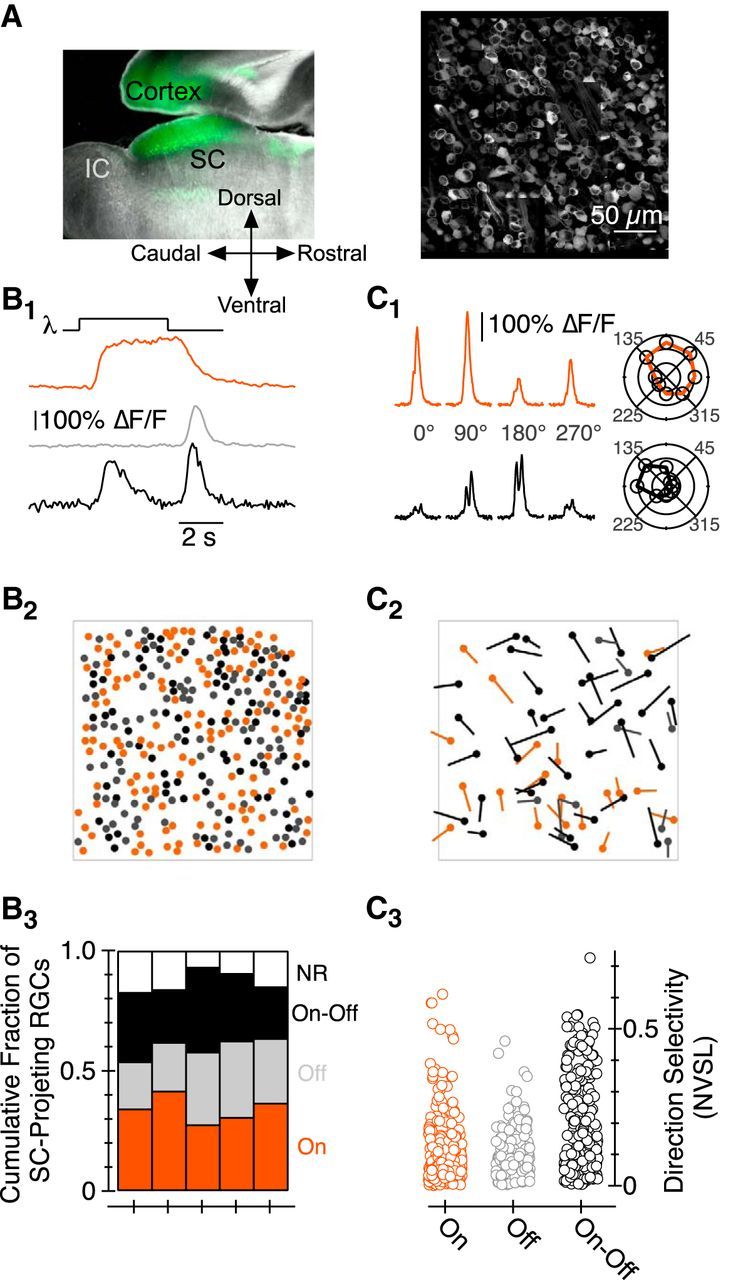
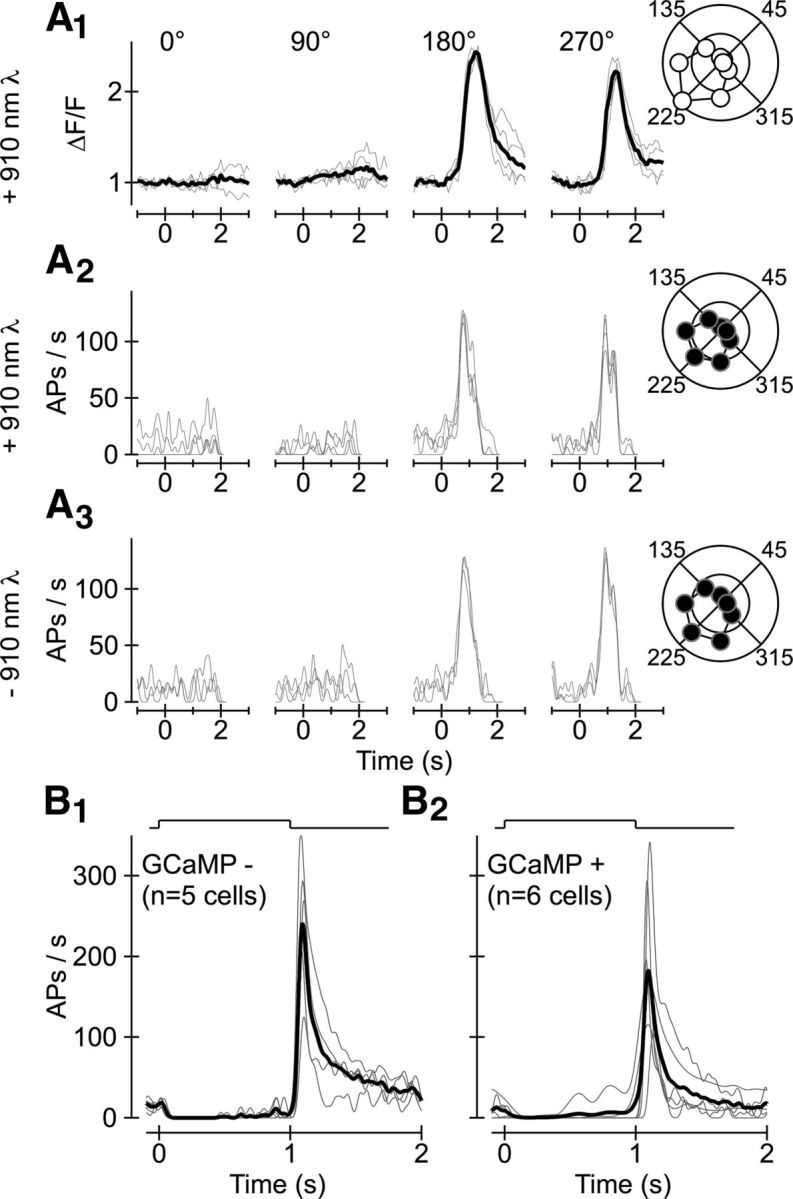
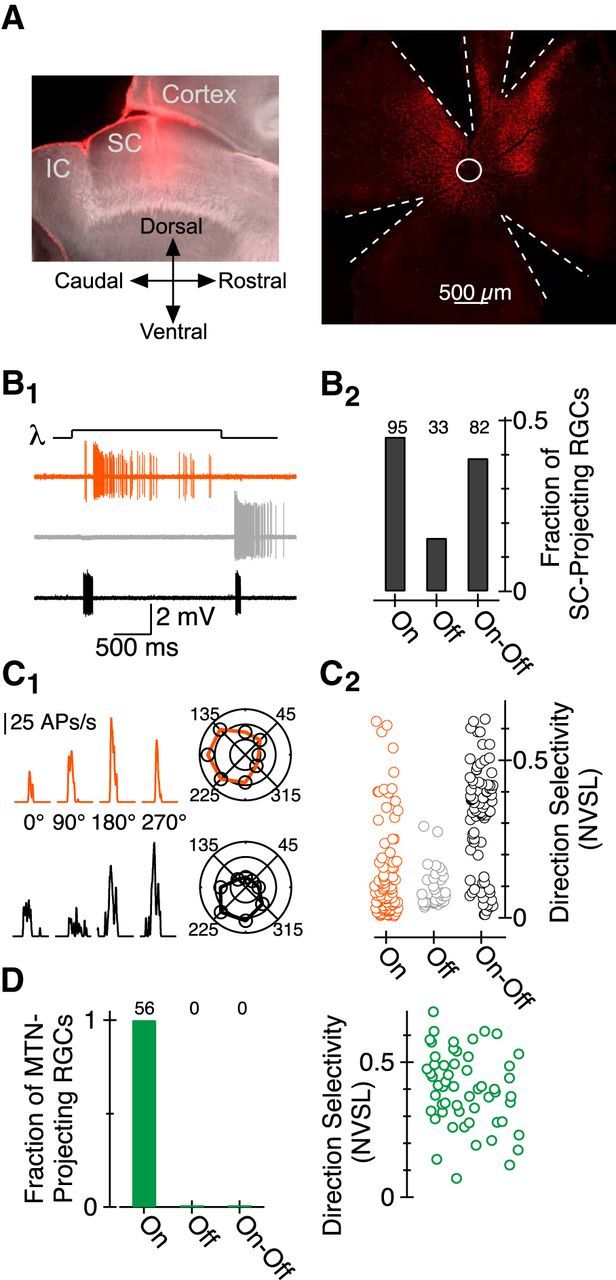
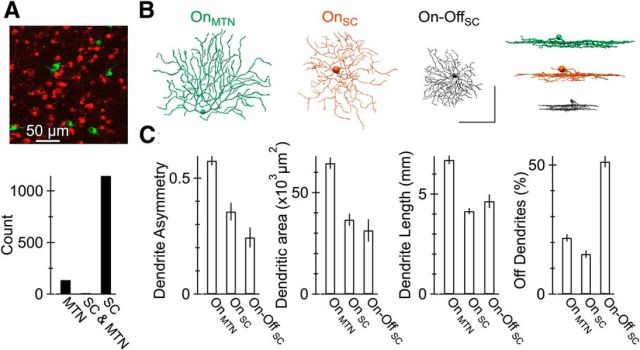
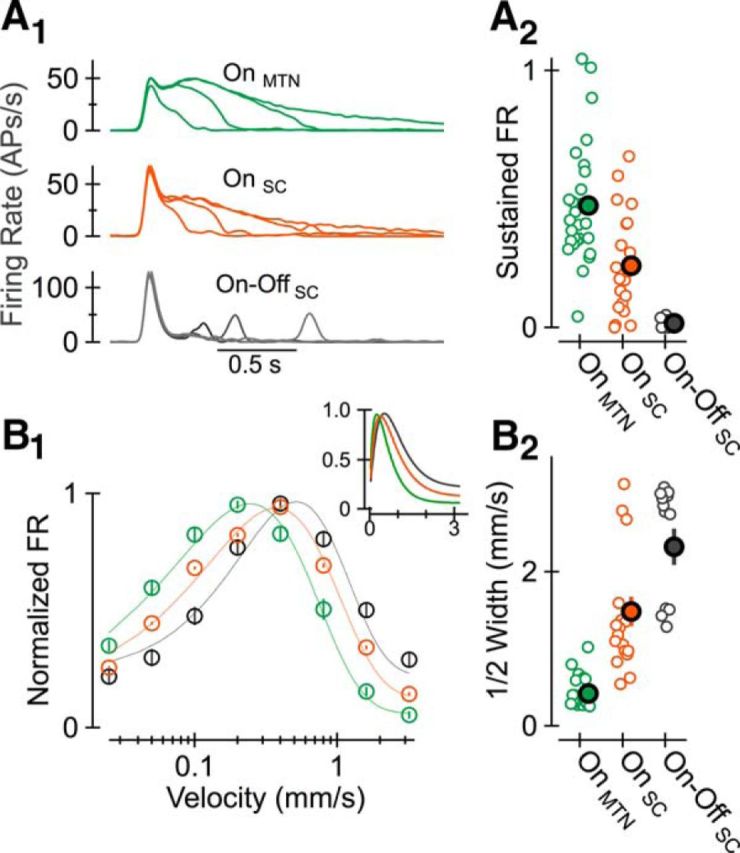
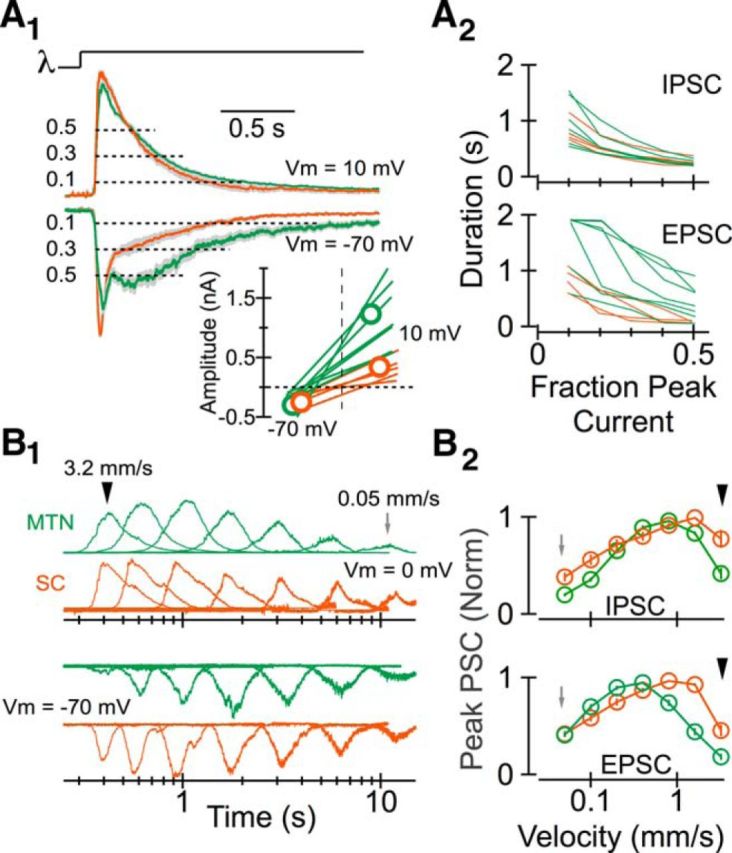
The brain receives information about the direction of object motion from several types of retinal ganglion cells (RGCs). On-Off direction-selective (DS) RGCs respond preferentially to stimuli moving quickly in one of four directions and provide a significant (but difficult to quantify) fraction of RGC input to the SC. On DS RGCs, in comparison, respond preferentially to stimuli moving slowly in one of three directions and are thought to only target retinorecipient nuclei comprising the accessory optic system, e.g., the medial terminal nucleus (MTN). To determine the fraction of SC-projecting RGCs that exhibit direction selectivity, and the specificity with which On-Off and On DS RGCs target retinorecipient areas, we performed optical and electrophysiological recordings from RGCs retrogradely labeled from the mouse SC and MTN. We found, surprisingly, that both On-Off and On DS RGCs innervate the SC; collectively they constitute nearly 40% of SC-projecting RGCs. In comparison, only On DS RGCs project to the MTN. Subsequent experiments revealed that individual On DS RGCs innervate either the SC or MTN and exhibit robust projection-specific differences in somatodendritic morphology, cellular excitability, and light-evoked activity; several projection-specific differences in the output of On DS RGCs correspond closely to differences in excitatory synaptic input the cells receive. Our results reveal a robust projection of On DS RGCs to the SC, projection-specific differences in the response properties of On DS RGCs, and biophysical and synaptic mechanisms that underlie these functional differences.

Keywords: accessory optic system; retinorecipient; tectum.


Figures

Figure 1.
Figure 1.
Characterization of SC-projecting RGC responses to light stimuli via GCaMP6f. A, Left, Sagittal section of a mouse brain in which AAV_hSyn_GCaMP6f was injected in the SC. Fluorescence in areas rostral to the SC originates from the axons of GCaMP-expressing SC neurons that project to pretectal nuclei; we see no fluorescent cell bodies in the pretectal areas. Right, Montage image of a subset of the RGCs labeled following injection of an AAV coding for GCaMP6f into the SC. B1, ΔF/F as a function of time in three ROIs. B2, Location of On (orange), Off (gray), and On-Off (black) SC-projecting RGCs from retina shown in A. B3, Fraction of On, Off, On-Off, and NR SC-projecting RGCs in each of five Ca2+-imaging experiments. C1, ΔF/F as a function of time for stimuli moving in one of four directions; the top/bottom data are from an On/On-Off RGC, respectively. Polar plot representation of peak ΔF/F as a function of the direction of object motion for each RGC is shown on the right. C2, Location, and preferred direction, of DS RGCs in the piece of retina shown in A; the length of each vector corresponds to the NVSL. C3, NVSL for GCaMP6f-mediated responses elicited by eight different directions of motion in each On, Off, and On-Off RGC. IC, inferior colliculus.
Figure 2.
Figure 2.
GCaMP6f-mediated optical signals faithfully represent light-evoked electrical activity. A1, Change in fluorescence over background fluorescence (ΔF/F) triggered in a representative On-Off RGC by a small stimulus moving in several different directions. Responses on individual trials are shown in thin gray lines; mean response is superimposed in the thick black line. Polar plot representation shows the relative response as a function of all eight directions of motion presented. A2, Electrophysiological activity—APs per second—from same cell/epochs as in A1. A3, APs per second elicited in the same cell (and by the same stimuli) as in A1 and A2 but in the absence of scanned laser (910 nm) light. B, Responses elicited by a stationary (100–200 μm diameter) stimulus in Off transient alpha RGCs that do (B2) and do not (B1) express GCaMP6f.
Figure 3.
Figure 3.
Characterization of SC-projecting RGC responses to light stimuli via cell-attached electrophysiological recordings. A, Left, Sagittal sections from the right hemisphere of a mouse brain in which red retro Fluor beads were injected +0.7 mm lateral from the midline and directly ventral to lambda. Right, Image of RGCs labeled following stereotaxic injection of red beads into the SC. White circle indicates location of optic nerve head; dashed white lines show location of strain-reducing radial cuts. B1, Current as a function of time in three representative SC-projecting RGCs. B2, Fraction of SC-projecting RGCs exhibiting On, Off, and On-Off responses. C1, Firing rate (APs per second) as a function of time for small (100–200 μm) diameter stimulus moving in one of four directions; the top/bottom data are from a representative On/On-Off RGC, respectively. Polar plot representation of peak firing rate as a function of the direction of object motion for each cell is shown on the right. C2, NVSL for electrophysiological responses elicited by eight different directions of motion in each On, Off, and On-Off RGC; data in this panel were obtained from the retinae of 24 mice. D, Same as B2 and C2 for MTN-projecting RGCs; data were obtained from the retinae of 17 mice. IC, inferior colliculus.
Figure 4.
Figure 4.
Nonoverlapping populations of RGCs project to the SC and MTN. A, Top, Retina from an animal in which beads conjugated to rhodamine and fluorescein were injected into the SC and MTN, respectively. The number of cells labeled by red, green, and red and green beads is shown below. B, XY and XZ projections of morphological reconstructions of representative MTN-projecting and SC-projecting On DS RGCs and SC-projecting On-Off DS RGCs. Scale bar, 50 μm. C, Dendritic asymmetry, area, length, and percentage volume in the Off sublamina of the inner plexiform layer for three classes of DS RGCs (n = 7, 5, and 3 cells reconstructed, respectively).
Figure 5.
Figure 5.
Projection-specific differences in the output of On DS RGCs. A1, Across-cell average of AP responses elicited by a stationary spot presented for four different stimulus durations in MTN-projecting and SC-projecting On DS RGCs and SC-projecting On-Off DS RGCs. A2, Ratio of steady state to peak firing rate for each RGC contributing to averages in A1. B1, Normalized firing rate as a function of stimulus speed (in the preferred direction). Inset shows the same data with a linear, rather than log-based, x-axis. B2, Speed tuning—width at half-max—for each RGC contributing to the average shown in B1. Data from each cell, and populations of like cells, were fit with a gamma function (Nover et al., 2005).
Figure 6.
Figure 6.
Intrinsic biophysical characteristics of SC-projecting and MTN-projecting On DS RGCs. A1, Responses of a representative MTN-projecting (left) and SC-projecting (right) On DS RGC to hyperpolarizing and depolarizing current steps. A2, Instantaneous firing rate (1 interspike interval) elicited by several current steps delivered to the two RGCs shown in A. B, Mean firing rate as a function of current step amplitude for each MTN-projecting and SC-projecting On DS RGC. Mean firing rate was calculated over the course of the 2 s current step. Inset, Coefficient of variation for the distribution of interspike intervals in MTN-projecting (black diamonds) and SC-projecting (gray diamonds) On DS RGCs; AP generation in SC-projecting RGCs exhibited higher interspike interval values over a broad range of current step amplitudes.
Figure 7.
Figure 7.
Projection-specific differences in the synaptic input to On DS RGCs. A1, Mean peak-normalized inhibitory (top) and excitatory (bottom) postsynaptic currents elicited in MTN-projecting (green) and SC-projecting (orange) On DS RGCs by a spatially uniform stimulus 2 s in duration. EPSCs were measured at the reversal potential for Cl (approximately −70 mV); IPSCs were measured at the reversal potential for mixed cation currents (through AMPA/NMDA receptors, for example; between 0 and 10 mV). The inset below shows the absolute peak amplitude of EPSCs and IPSCs in each cell contributing to the peak-normalized average above. A2, Duration of postsynaptic currents in each cell contributing to the averages shown in A1. Duration was calculated as the time the current was >10%, 20%, 30%, 40%, or 50% of the normalized peak amplitude. B1, Peak-normalized postsynaptic currents elicited by a stimulus moving at a variety of different speeds (in the preferred direction) from a representative MTN-projecting (green) and SC-projecting (orange) On DS RGC. Data are shown on a log timescale. B2, Peak-normalized postsynaptic current amplitude as a function of motion velocity.

Similar articles

Cited by

References

    1. Amthor FR, Takahashi ES, Oyster CW. Morphologies of rabbit retinal ganglion cells with concentric receptive fields. J Comp Neurol. 1989;280:72–96. doi: 10.1002/cne.902800107. - DOI - PubMed
    1. Barlow HB, Hill RM. Selective sensitivity to direction of motion in ganglion cells of the rabbit retina. Science. 1963;139:412–414. doi: 10.1126/science.139.3553.412. - DOI - PubMed
    1. Barlow HB, Hill RM, Levick WR. Retinal ganglion cells responding selectively to direction and speed of image motion in the rabbit. J Physiol. 1964;173:377–407. doi: 10.1113/jphysiol.1964.sp007463. - DOI - PMC - PubMed
    1. Berson DM. Retinal ganglion cell types and their central projections. In: Basbaum AI, Kaneko A, Shepherd GM, Westheimer G, editors. The senses: a comprehensive reference. San Diego, CA: Academic; 2008. pp. 491–520.
    1. Borghuis BG, Tian L, Xu Y, Nikonov SS, Vardi N, Zemelman BV, Looger LL. Imaging light responses of targeted neuron populations in the rodent retina. J Neurosci. 2011;31:2855–2867. doi: 10.1523/JNEUROSCI.6064-10.2011. - DOI - PMC - PubMed

Publication types

LinkOut - more resources