. 2015 Apr 22;35(16):6584-99.
doi: 10.1523/JNEUROSCI.0195-15.2015.

Are striatal tyrosine hydroxylase interneurons dopaminergic?

Affiliations

Are striatal tyrosine hydroxylase interneurons dopaminergic?

Harry S Xenias et al. J Neurosci. .

Abstract

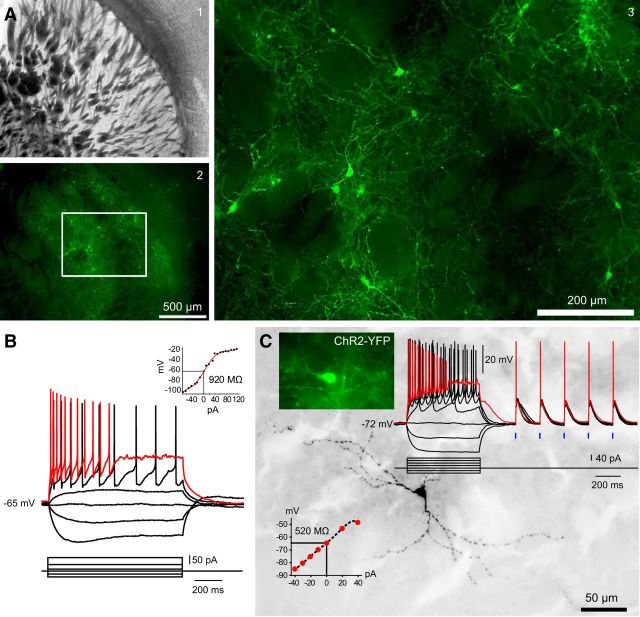
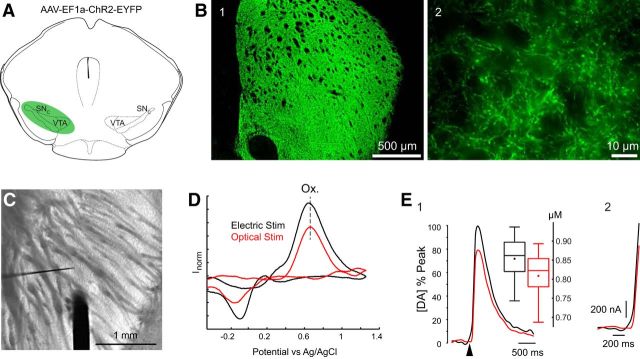
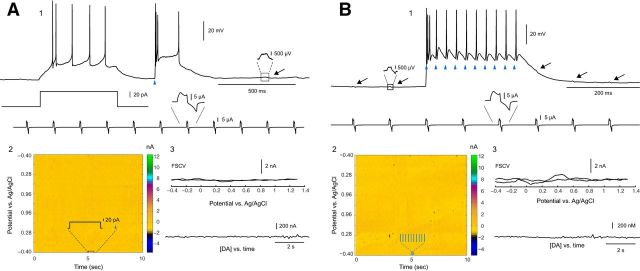
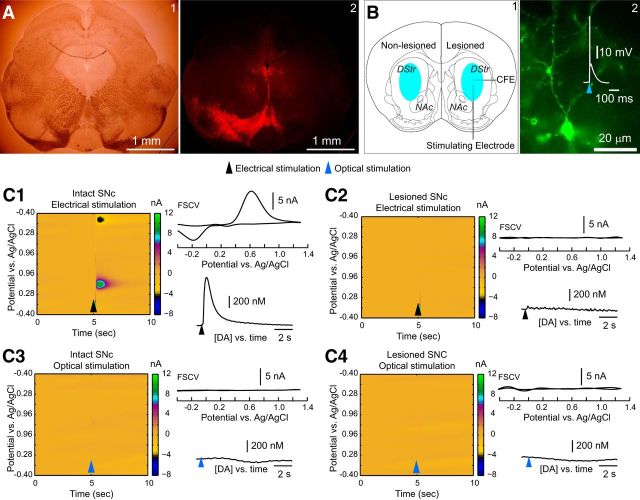
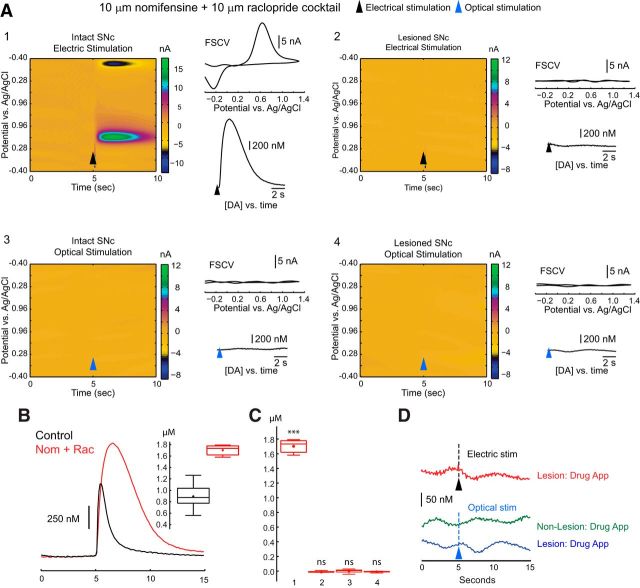
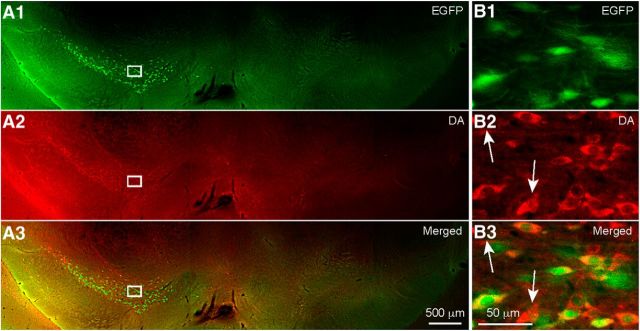
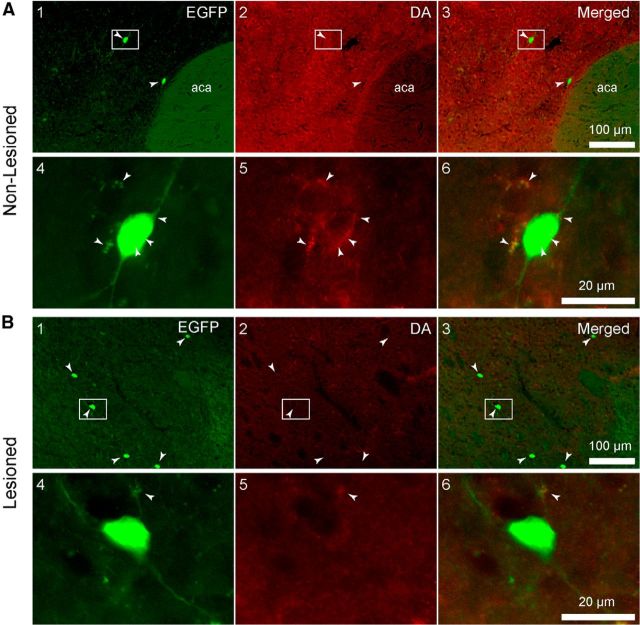
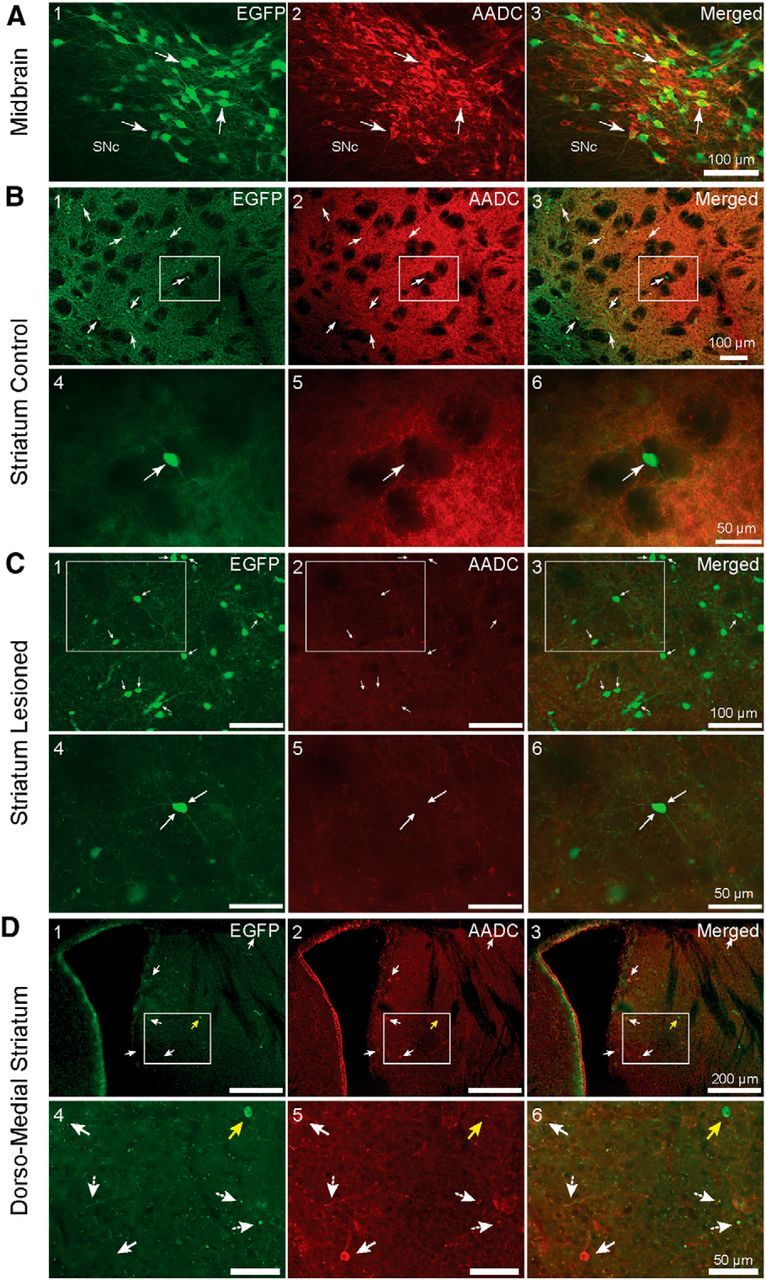
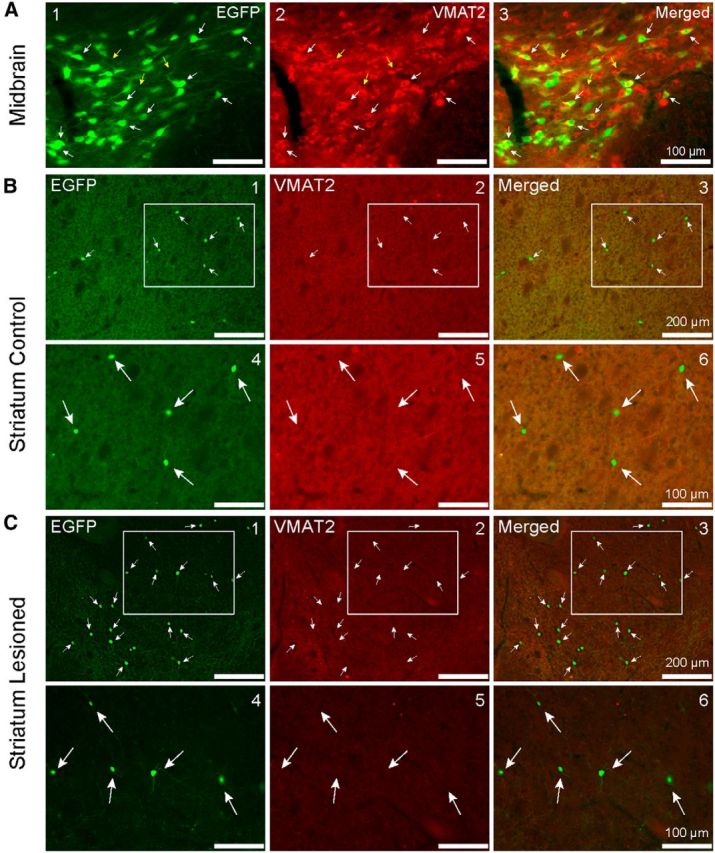
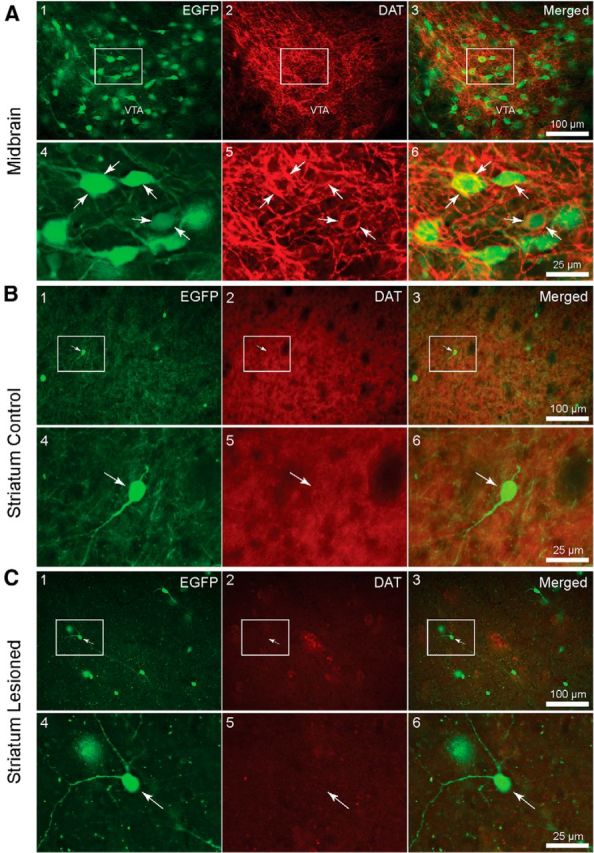
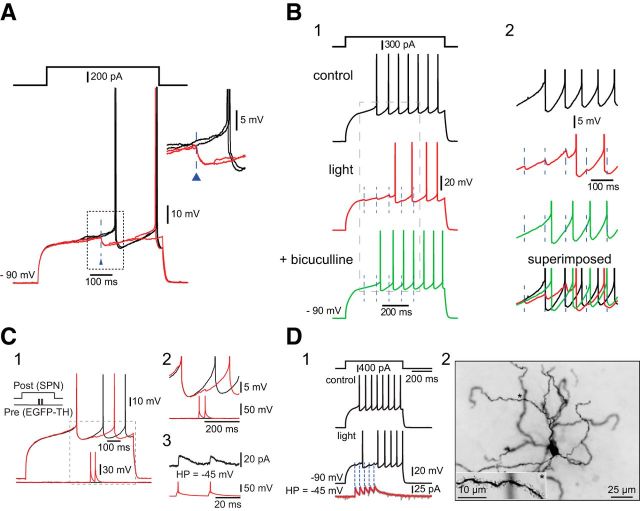
Striatal GABAergic interneurons that express the gene for tyrosine hydroxylase (TH) have been identified previously by several methods. Although generally assumed to be dopaminergic, possibly serving as a compensatory source of dopamine (DA) in Parkinson's disease, this assumption has never been tested directly. In TH-Cre mice whose nigrostriatal pathway had been eliminated unilaterally with 6-hydroxydopamine, we injected a Cre-dependent virus coding for channelrhodopsin-2 and enhanced yellow fluorescent protein unilaterally into the unlesioned midbrain or bilaterally into the striatum. Fast-scan cyclic voltammetry in striatal slices revealed that both optical and electrical stimulation readily elicited DA release in control striata but not from contralateral striata when nigrostriatal neurons were transduced. In contrast, neither optical nor electrical stimulation could elicit striatal DA release in either the control or lesioned striata when the virus was injected directly into the striatum transducing only striatal TH interneurons. This demonstrates that striatal TH interneurons do not release DA. Fluorescence immunocytochemistry in enhanced green fluorescent protein (EGFP)-TH mice revealed colocalization of DA, l-amino acid decarboxylase, the DA transporter, and vesicular monoamine transporter-2 with EGFP in midbrain dopaminergic neurons but not in any of the striatal EGFP-TH interneurons. Optogenetic activation of striatal EGFP-TH interneurons produced strong GABAergic inhibition in all spiny neurons tested. These results indicate that striatal TH interneurons are not dopaminergic but rather are a type of GABAergic interneuron that expresses TH but none of the other enzymes or transporters necessary to operate as dopaminergic neurons and exert widespread GABAergic inhibition onto direct and indirect spiny neurons.

Keywords: GABA; dopamine; interneuron; neostriatum; optogenetics; voltammetry.


Figures

Figure 1.
Figure 1.
Optogenetic targeting and selective activation of striatal THINs. A1, Low-magnification bright-field photomicrograph of a coronal section through the striatum of a TH–Cre mouse, which was injected previously with AAV–ChR2–EYFP (1.33 μl). A2, Fluorescence photomicrograph of the same field shown in A1 showing widespread viral transduction of striatal THINs. A3, Higher-magnification view of boxed area of A2, detailing abundant ChR2–EYFP somata, axons, and dendrites. B, Representative whole-cell current-clamp recording of a type I striatal THIN from an EGFP–TH mouse, exhibiting typical high input resistance and the characteristic depolarization block at moderate depolarizing current injections typical of type I THINS reported previously. C, Whole-cell recording of a virally transduced ChR2–EYFP striatal THIN (top right inset) from a coronal striatal section from a TH–Cre mouse. Both the electrophysiology and anatomy were typical of type I striatal THINs as seen previously in EGFP–TH mice (compare with B). Optical stimuli from a blue LED at 2.5 ms (blue ticks) evoke large depolarizations that consistently evoke spikes.
Figure 2.
Figure 2.
Voltammetric detection of optogenetically evoked striatal DA release from nigrostriatal neurons in a TH–Cre mouse. A, Schematic illustration of the midbrain injection site of AAV–ChR2–EYFP (1.2 μl). B1, Coronal section of the striatum of a TH–Cre mouse 2 weeks after midbrain injection of AAV–ChR2–EYFP, showing an extremely dense distribution of fluorescent virally transduced nigrostriatal fibers throughout the striatum. B2, Higher-magnification photomicrograph of the same striatum shown in B1. C, Bright-field micrograph taken through the recording microscope shows the placement of the concentric bipolar stimulating electrode (thick dark structure) and the much thinner voltammetric CFE. D, Both electrical and optical stimulation protocols produce nearly identical cyclic voltammograms, whose peak oxidation (Ox.) and reduction potentials identify them as resulting from DA. The dashed line shows the nearly identical oxidation potentials resulting from the two stimuli. E1, DA release after electrical (black) or optical (red) stimulation normalized to the maximum peak oxidation current. Box plot summaries of evoked [DA]e from electrical (black) and optical (red) stimuli show no significant difference (n = 11 recordings). E2, A magnified view of the initial time profile of E1, illustrating identical release kinetics for both stimulation protocols. The arrowhead denotes the onset of electrical or optical stimulation.
Figure 3.
Figure 3.
Optical activation of ChR2–YFP transduced striatal THINs in slices from mice with unilateral midbrain 6-OHDA lesions during simultaneous FSCV. A1, Neither current injection (50 pA for 500 ms) nor optical stimulation (single 5 ms light pulse, blue triangle) elicited detectable evoked release of DA ipsilateral to midbrain 6-OHDA lesions. Note the absence of any oxidation or reduction peaks in the voltammetric heat map (A2). A3, No response in CFE (top) or any evoked DA release over a several-second-long recording period was detected (n = 12 cells). B, A strong optical stimulation train (10 5-ms blue light pulse with an ISI of 25 ms) failed to evoke any detectable DA despite the elicitation of spikes to each light pulse (blue triangles). Black arrows in B1 indicate inductive voltage changes during current-clamp recording originating from the simultaneous voltammetric scan sweep below (see blow up of box region to the left of the recording sweep). B2 and B3 show the absence of any response in CFE or DA release.
Figure 4.
Figure 4.
Simultaneous voltammetry in the striatum during optogenetic activation of striatal THINs. A1, Bright-field photomicrograph of a coronal section through the midbrain of a TH–Cre mouse after a unilateral midbrain 6-OHDA injection and bilateral striatal injections of AAV–ChR2–EYFP (1.33 μl). A2, Fluorescent photomicrograph of the same field as in A1, processed for TH immunofluorescence showing a complete absence of TH on the 6-OHDA-treated side but densely packed TH immunoreactive somata and processes in the substantia nigra and the ventral tegmental area on the contralateral side. B1, Schematic depiction of bilateral striatal injections of AAV–ChR2–EYFP. B2, Striatal THIN expressing ChR2–EYFP. The neuron reliably fires an action potential on a single 2.5 ms pulse of blue light. DStr, Dorsal striatum; NAc, nucleus accumbens. C, Voltammetric color maps, FSCVs, and [DA]e versus time plots. Electrical stimulation elicits DA from the control striatum (C1) but not from the lesioned side (C2). In contrast, optical stimulation failed to elicit any detectable amounts of DA from the striatum, either ipsilateral or contralateral to the 6-OHDA midbrain injection (C3, C4). Black and red arrowheads, respectively, denote the onset of electrical and optical stimulation (n = 7 mice, n = 13 slices).
Figure 5.
Figure 5.
Effects of uptake and autoreceptor blockade on striatal DA release after optogenetic activation of striatal THINs. Nomifensine (10 μm) plus raclopride (10 μm) present for all experiments (n = 5 mice, 14 slices). Slices from mice treated as described above. A1, Nomifensine plus raclopride greatly enhanced the release of DA in response to local electrical stimulation in the control striatum but failed to yield any detectable release of DA ipsilateral to the 6-OHDA midbrain injection (A2). A3, A4, Optical stimulation failed to elicit detectable levels of DA from either the lesioned or control side. B, Overlay of evoked DA after electrical stimulation in the absence (black, n = 17 recordings) and presence (red, n = 14 recordings) of nomifensine (Nom) plus raclopride (Rac). Peak [DA] in the presence of the drugs (1.70 ± 0.02 μm) was significantly greater than in their absence [0.96 ± 0.05 μm; t(29) = 13.17, p < 0.001]. C, Box plot summaries of evoked peak [DA] in nomifensine plus raclopride for the following groups: electrical stimulation in striata contralateral to the lesion (group 1), electrical stimulation ipsilateral to the lesion (group 2), optical stimulation in the contralateral side (group 3), and optical stimulation ipsilateral to the lesion (group 4). D, Magnified scale of [DA]e versus time plots of A2–A4, showing no detectable DA for group 2 (red), group 3 (green), and group 4 (blue), even down at the level of CFE noise. ***p < 0.001.
Figure 6.
Figure 6.
DA immunofluorescence in the midbrain of unilaterally lesioned EGFP–TH mice. A, Coronal section of the midbrain of an EGFP–TH mouse processed for DA immunofluorescence after injection of 6-OHDA into the right midbrain. Note the absence of both EGFP and DA immunofluorescence on the 6-OHDA-treated side but abundant EGFP and DA immunoreactive somata on the control side. B, Higher-magnification photomicrographs of the corresponding boxed regions of A show DA immunofluorescent somata that colocalize EGFP (n = 5). In some cases, there were DA immunofluorescent somata that did not colocalize EGFP (white arrows), indicating that, in these mice, EGFP underreports the number of TH immunoreactive cells.
Figure 7.
Figure 7.
Photomicrographs of coronal sections through the dorsal striatum of an EGFP–TH mouse processed for DA immunofluorescence after unilateral 6-OHDA injections into the midbrain. A, Control side. B, Lesioned side. Magnified views of the boxed regions in A1–A3 and B1–B3 are shown in A4–A6 and B4–B6. No colocalization of DA with EGFP–TH was evident in any of the sections examined (n = 5 brains). Note what appear to be DA immunoreactive puncta surrounding the THINs in A5 and A6 (white arrowheads), suggesting innervation of THINs by nigrostriatal terminals. Note the increase of visible THINs in the lesioned striatum (B1) compared with the nonlesioned striatum (B2; white arrowheads).
Figure 8.
Figure 8.
AADC immunofluorescence in the midbrain and striatum of unilaterally lesioned EGFP–TH mice. A, High-magnification views of the contralateral midbrain showing EGFP-labeled neurons in the substantia nigra and VTA. White arrows point to representative neurons that colocalize EGFP and AADC. B1–B3, Low-magnification coronal photomicrographs of the striatum of an EGFP–TH mouse contralateral to the midbrain 6-OHDA injection that was processed for AADC immunofluorescence. Note that none of the THINs (white arrows) also express AADC. B4–B6, High-magnification view of the boxed regions in B1–B3 shows a single THIN that clearly lacks AADC expression. C, Photomicrographs of coronal sections of the striatum ipsilateral 6-OHDA injection into the midbrain. C4–C6, Magnified view of the boxed regions in C1–C3 shows a representative THIN, which did not colocalize AADC. Note the increased expression of EGFP and lower AADC background expression on the lesioned side (C) compared with the control side (B). D1–D3, AADC+-only striatal cells in the striatum. Fluorescent photomicrograph of a coronal section of the subcallosal region of the central striatum, near the lateral ventricle. Note a sparse number of AADC+-only cells (white arrows) distinct from EGFP+ cells that do not colocalize AADC (yellow arrow). D4–D6, Higher-magnification images of the boxed regions for D1–D3.
Figure 9.
Figure 9.
VMAT2 immunofluorescence in the midbrain of unilaterally lesioned EGFP–TH mice. A1–A3, Coronal photomicrographs of the SNc, depicting EGFP and VMAT2 immunopositive expression. Note the coexpression of EGFP and VMAT2 (white arrows) but also a few VMAT2-only cells that did not colocalize TH (yellow arrows). B1–B3, VMAT2 immunofluorescence in the striatum of unilaterally lesioned EGFP–TH mice. Low-magnification photomicrographs of a coronal section through the striatum of an EGFP–TH mouse contralateral to a midbrain 6-OHDA injection that was processed for VMAT2 immunofluorescence. Note that none of the EGFP–TH interneurons also express VMAT2. B4–B6, High-magnification view of the boxed regions in B1–B3 depicts a single THIN that clearly lacks VMAT2 expression. C1–C3, Photomicrographs of coronal sections of the striatum ipsilateral to 6-OHDA lesioning of the midbrain. C4–C6, Magnified view of the boxed regions in B1–B3 shows a representative THIN that does not express VMAT2. Note the increased expression of EGFP and lower VMAT2 background expression on the lesioned side (C) compared with the control side (B).
Figure 10.
Figure 10.
DAT immunofluorescence in the midbrain of unilaterally lesioned EGFP–TH mice. A1–A3, Low-magnification photomicrographs of a coronal section through the SNc contralateral to a midbrain injection of 6-OHDA showing a large number of EGFP fluorescent neurons. A4–A6, High-magnification photomicrograph of the boxed regions in A1–A3. Note the dense labeling of the neuropil and membrane of cells (white arrows). Note the perisomatic expression of AADC colocalizing with EGFP (A6). B1–B3, DAT immunofluorescence in the striatum of unilaterally lesioned EGFP–TH mice. Low-magnification photomicrograph of a coronal section through the striatum of an EGFP–TH mouse contralateral to a midbrain 6-OHDA injection that was processed for DAT immunofluorescence showing five EGFP–TH interneurons. B2, B5, Note the high background staining in the neuropil resulting from DAT expression in nigrostriatal axons. Merge indicates no coexpression of DAT and EGFP (B3). B4–B6, High-magnification images of boxed regions in B1–B3 show no expression of the DAT. C1–C3, Low-magnification photomicrograph of a coronal section through the striatum of an EGFP–TH mouse ipsilateral to a midbrain 6-OHDA injection that was processed for DAT immunofluorescence shows a number of EGFP–TH interneurons. Note that EGFP–TH does not colocalize with DAT immunofluorescence (C4–C6). Note also the reduction in background staining compared with that in C5 compared with B5 as a result of the loss of the DAT-expressing nigrostriatal axons.
Figure 11.
Figure 11.
Striatal THINs exert widespread GABAergic inhibition onto SPNs. A, Ex vivo whole-cell current-clamp recording of an SPN in a TH–Cre mouse bilaterally injected with AAV–ChR2–EYFP in the striatum. Presentation of 2.5 ms blue light stimuli (blue triangles) elicits IPSPs. B1, IPSPs in another SPN evoked by optical stimulation of THINs (dashed lines, red trace) are blocked by bicuculline (green trace), a GABAA antagonist. B2, Magnified views of the corresponding traces in B1. C1, Paired recording of a type III THIN synaptically connected to an SPN during paired-pulse current injections. C2, Magnified view of evoked unitary IPSPs of the boxed region in C1. C3, Unitary IPSCs of ∼16 pA (black trace) were evoked in the same pair at a holding potential of −45 mV. D1, Optogenetic activation of THINs during whole-cell recording of another SPN. Voltage-clamp recording of the same SPN during optogenetic activation of THINs reveals an average IPSC of ∼32 pA at −45 mV. D2, Photomicrograph of the SPN in D1. Inset at the bottom left is a magnified view of the dendrite marked by asterisks.

References

    1. Adams JC. Heavy metal intensification of DAB-based HRP reaction product. J Histochem Cytochem. 1981;29:775. doi: 10.1177/29.6.7252134. - DOI - PubMed
    1. Betarbet R, Turner R, Chockkan V, DeLong MR, Allers KA, Walters J, Levey AI, Greenamyre JT. Dopaminergic neurons intrinsic to the primate striatum. J Neurosci. 1997;17:6761–6768. - PMC - PubMed
    1. Beyene M, Carelli RM, Wightman RM. Cue-evoked dopamine release in the nucleus accumbens shell tracks reinforcer magnitude during intracranial self-stimulation. Neuroscience. 2010;169:1682–1688. doi: 10.1016/j.neuroscience.2010.06.047. - DOI - PMC - PubMed
    1. Bové J, Perier C. Neurotoxin-based models of Parkinson's disease. Neuroscience. 2012;211:51–76. doi: 10.1016/j.neuroscience.2011.10.057. - DOI - PubMed
    1. Cossette M, Parent A, Lévesque D. Tyrosine hydroxylase-positive neurons intrinsic to the human striatum express the transcription factor Nurr1. Eur J Neurosci. 2004;20:2089–2095. doi: 10.1111/j.1460-9568.2004.03661.x. - DOI - PubMed

Publication types

MeSH terms

Substances