. 2015 Apr 22;35(16):6600-18.
doi: 10.1523/JNEUROSCI.4786-14.2015.

Unit Activity of Hippocampal Interneurons before Spontaneous Seizures in an Animal Model of Temporal Lobe Epilepsy

Affiliations

Unit Activity of Hippocampal Interneurons before Spontaneous Seizures in an Animal Model of Temporal Lobe Epilepsy

Izumi Toyoda et al. J Neurosci. .

Abstract

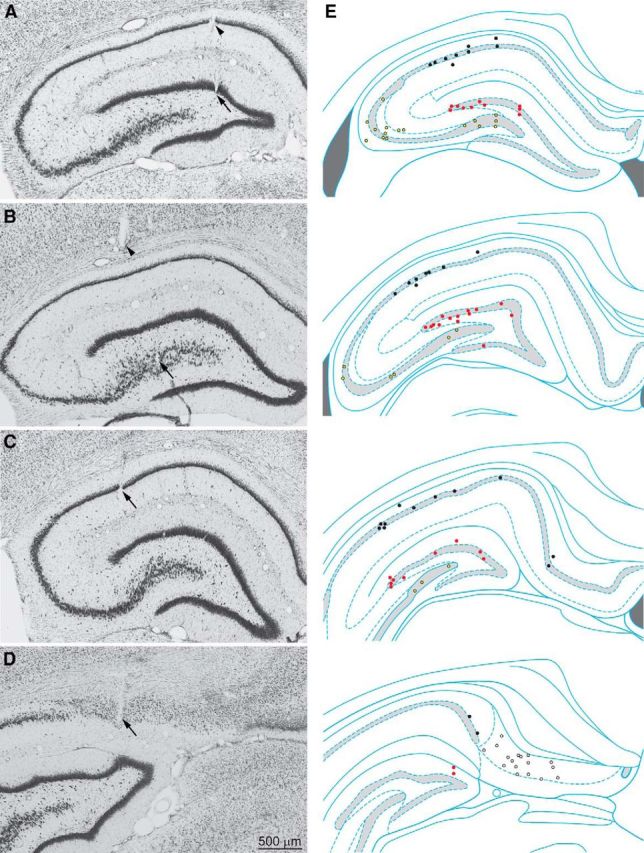
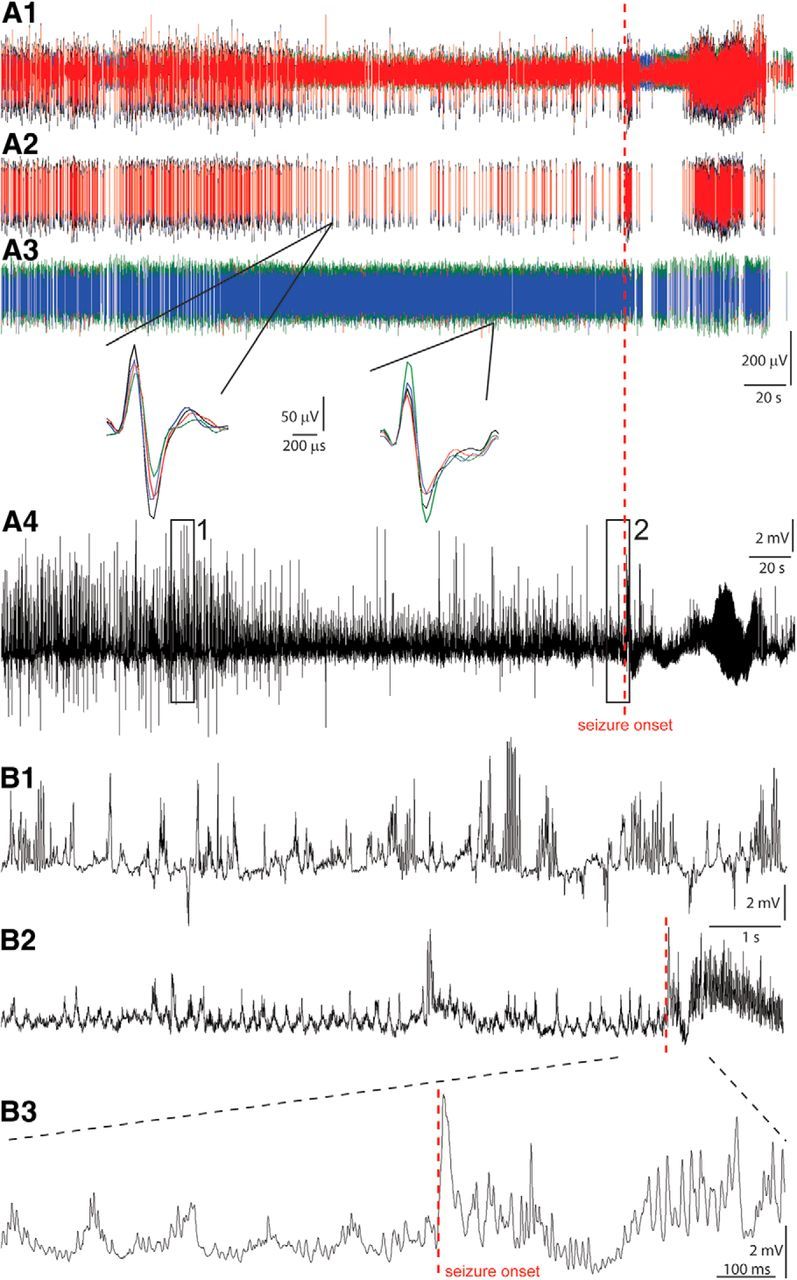
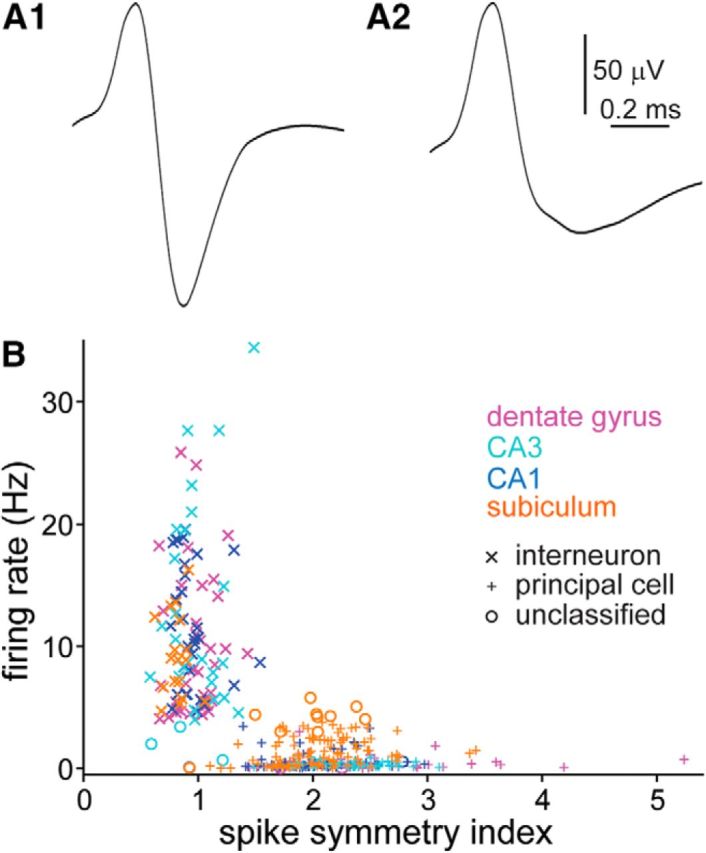
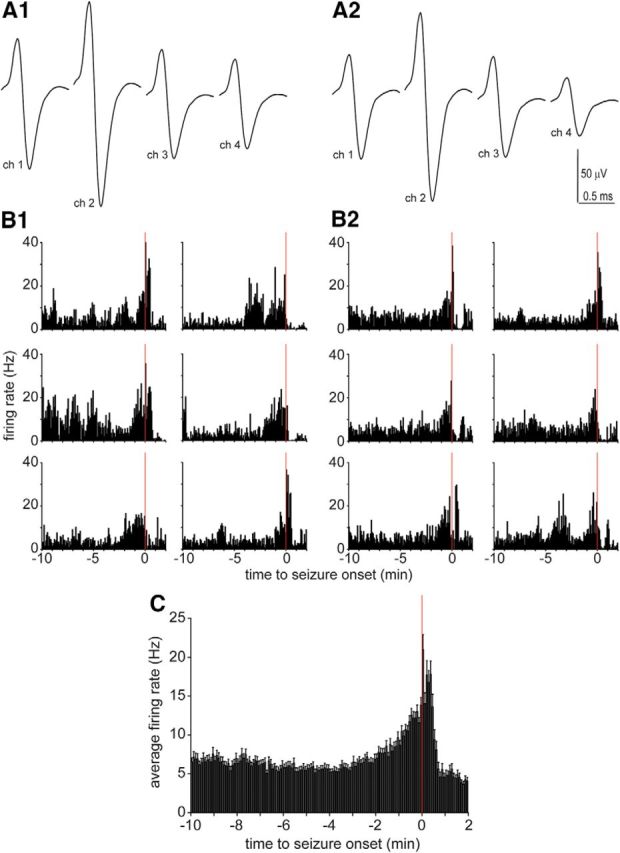
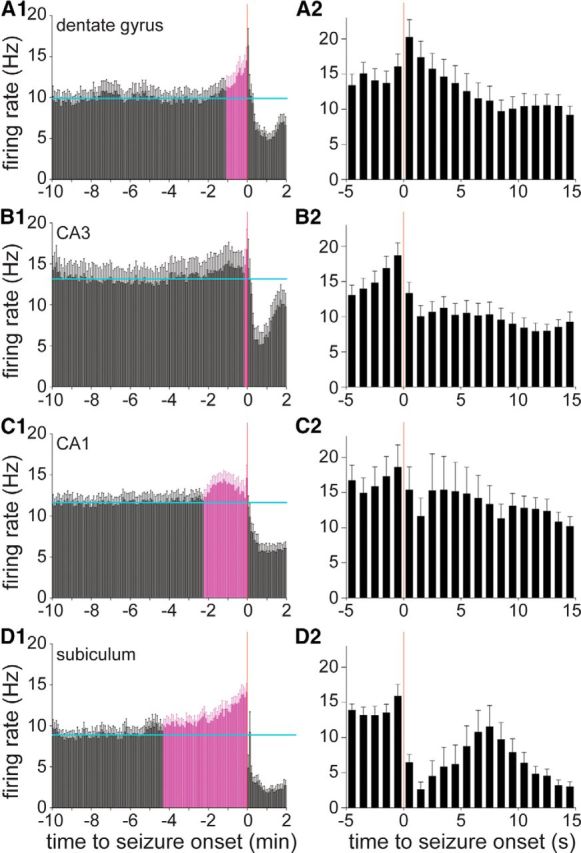
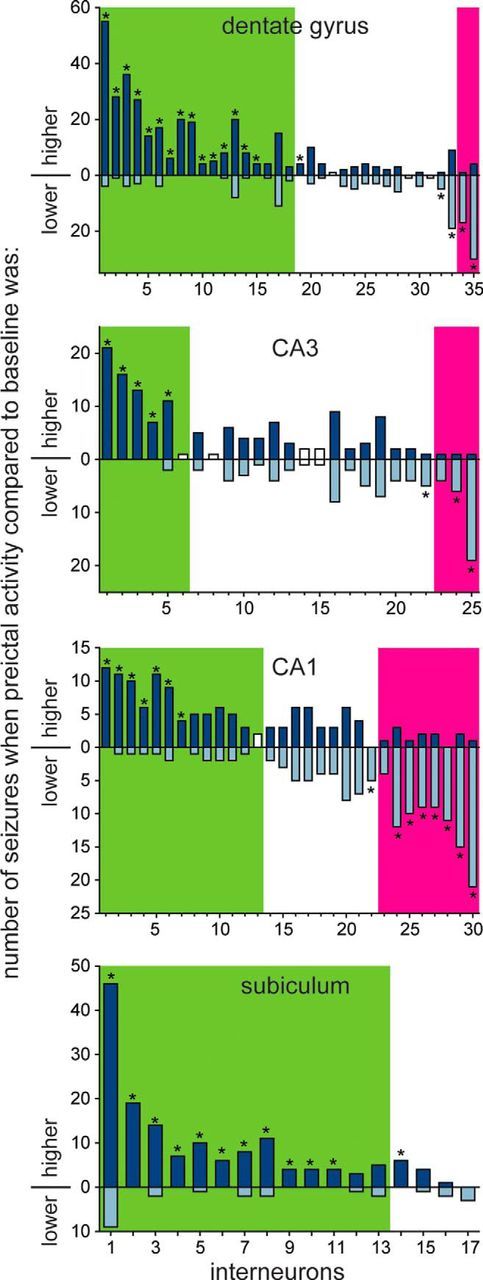
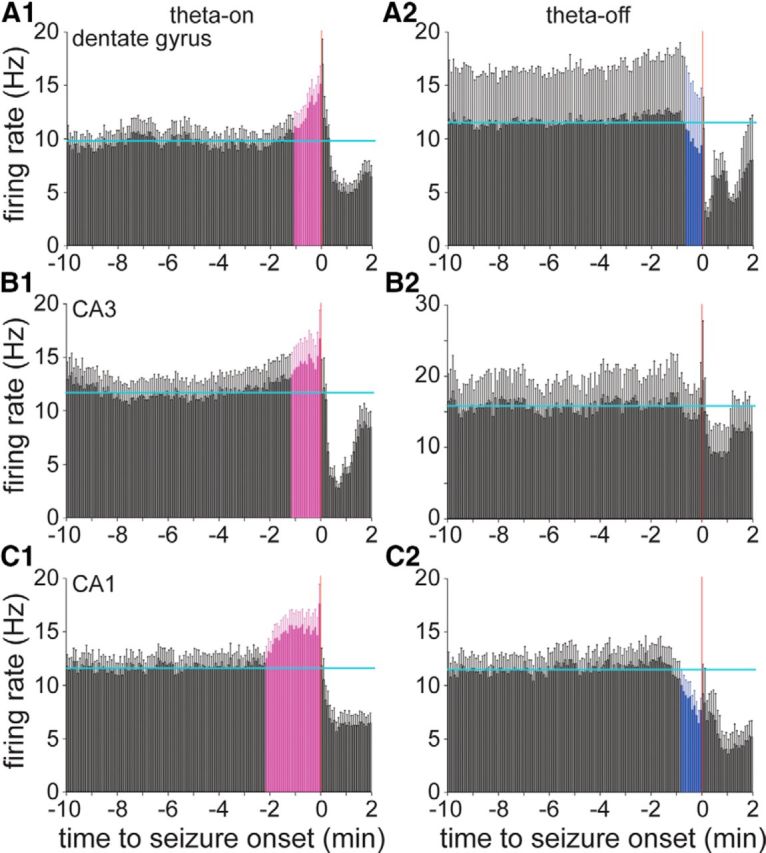
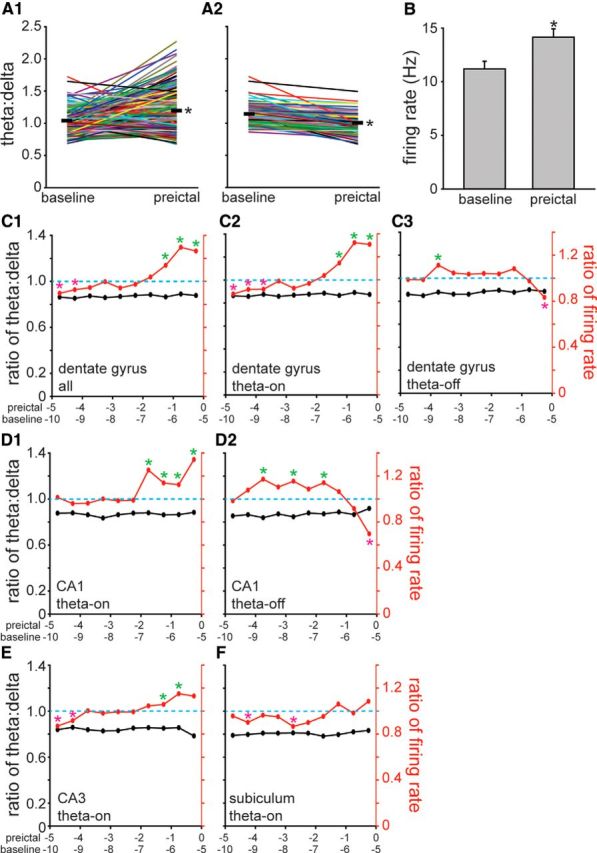
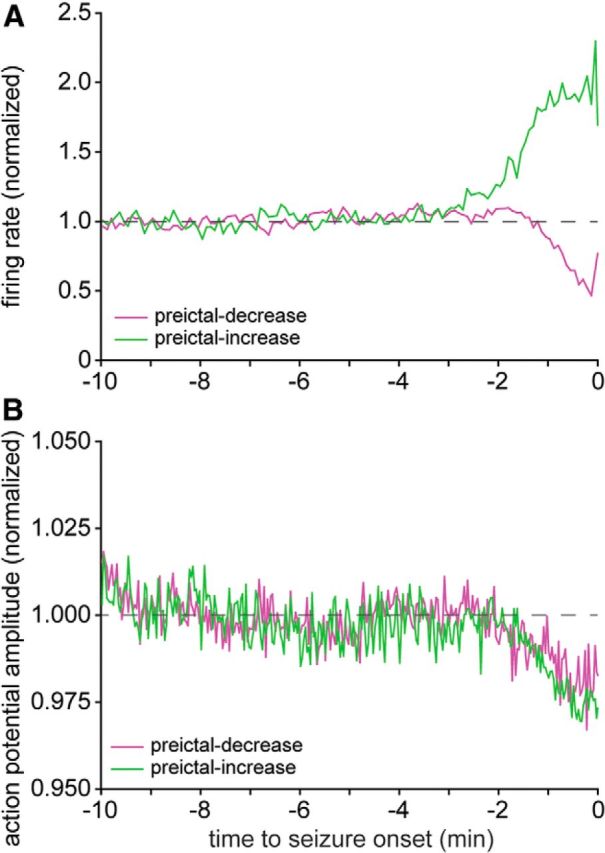
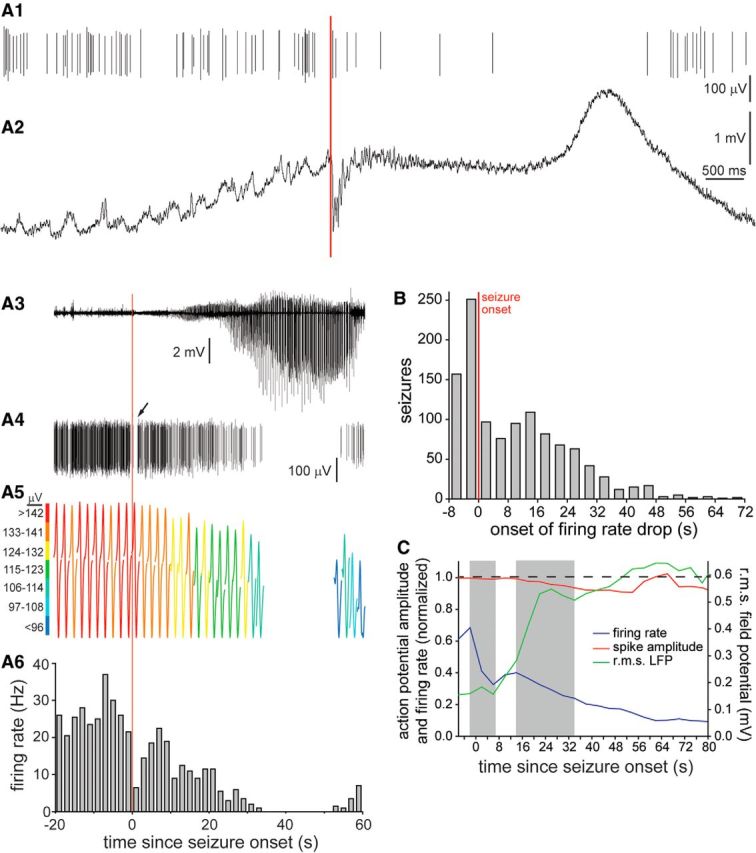
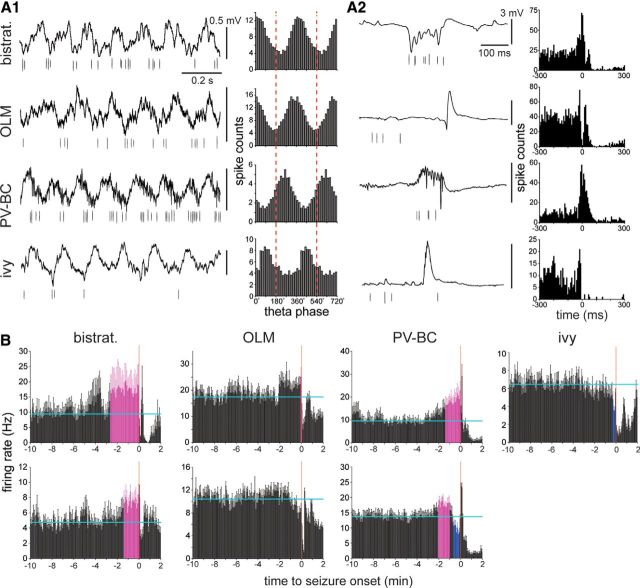
Mechanisms of seizure initiation are unclear. To evaluate the possible roles of inhibitory neurons, unit recordings were obtained in the dentate gyrus, CA3, CA1, and subiculum of epileptic pilocarpine-treated rats as they experienced spontaneous seizures. Most interneurons in the dentate gyrus, CA1, and subiculum increased their firing rate before seizures, and did so with significant consistency from seizure to seizure. Identification of CA1 interneuron subtypes based on firing characteristics during theta and sharp waves suggested that a parvalbumin-positive basket cell and putative bistratified cells, but not oriens lacunosum moleculare cells, were activated preictally. Preictal changes occurred much earlier than those described by most previous in vitro studies. Preictal activation of interneurons began earliest (>4 min before seizure onset), increased most, was most prevalent in the subiculum, and was minimal in CA3. Preictal inactivation of interneurons was most common in CA1 (27% of interneurons) and included a putative ivy cell and parvalbumin-positive basket cell. Increased or decreased preictal activity correlated with whether interneurons fired faster or slower, respectively, during theta activity. Theta waves were more likely to occur before seizure onset, and increased preictal firing of subicular interneurons correlated with theta activity. Preictal changes by other hippocampal interneurons were largely independent of theta waves. Within seconds of seizure onset, many interneurons displayed a brief pause in firing and a later, longer drop that was associated with reduced action potential amplitude. These findings suggest that many interneurons inactivate during seizures, most increase their activity preictally, but some fail to do so at the critical time before seizure onset.

Keywords: CA1; CA3; dentate gyrus; local field potential; subiculum; theta.


Figures

Figure 1.
Figure 1.
Coronal Nissl-stained sections were used to identify tetrode tracks. A–D, Arrows indicate tetrode tip locations in the dentate gyrus (A), CA3 (B), CA1 (C), and subiculum (D). A, B, Arrowheads indicate other tetrode tracks. E, Sites of recorded interneurons in the dentate gyrus (red markers), CA3 (yellow), CA1 (black), and subiculum (white) at rostral (top) to caudal (bottom) levels. Hippocampal schematic diagrams are from Paxinos and Watson (2009).
Figure 2.
Figure 2.
Interneurons were recorded before and during spontaneous seizures. A1–A4, Unit and local field potential recordings from the dentate gyrus. Multiunit (A1), sorted single-unit (A2, A3), and local field potential recordings (A4). The multiunit and one of the sorted single-unit recordings (A2) were obtained from the same tetrode. The other sorted single-unit recording (A3) was obtained with a different tetrode. Insets show single action potentials recorded by four channels (different colors) of the tetrodes. A4, B1, B2, Boxed regions in the local field potential (A4) are non-theta (1) and preictal theta (2) periods that are shown at higher resolution below (B1 and B2, respectively). B3, Expanded view around seizure onset. Up is negative in A1–A3. Up is positive in A4 and B1–B3.
Figure 3.
Figure 3.
Units were classified as interneurons or principal cells based on spike symmetry and firing rate. A1, A2, Average waveforms of an interneuron (A1) and principal cell (A2) recorded in the dentate gyrus. Up is negative. B, Firing rate and spike symmetry index values of interneurons (x) and principal cells (+) recorded in the dentate gyrus, CA3, CA1, and subiculum. Some units could not be classified confidently (o).
Figure 4.
Figure 4.
Interneurons were recorded during multiple spontaneous seizures. A1, A2, Waveforms of an interneuron recorded in the dentate gyrus by four channels of a tetrode 1 d (A1) and 9 d later (A2). The tetrode was not moved between days. Across days, waveforms (A1, A2), baseline firing rates (5.8 and 5.2 Hz, respectively), spike symmetry indices (0.87 and 0.85), spike widths (0.18 and 0.18 ms), and relative amplitude relationships among the four channels were similar. B1–B2, Firing rate data from six consecutively recorded seizures are plotted from the day corresponding to A1 (B1) and A2 (B2). C, A total of 59 seizures recorded during six sessions over a 35 d period were averaged. Error bars indicate the SEM.
Figure 5.
Figure 5.
A–D, Average preictal activity of dentate gyrus (A), CA3 (B), CA1 (C), and subicular (D) interneurons (n = 35, 25, 30, and 17, respectively). A1, B1, C1, D1, Horizontal cyan lines indicate the average baseline firing rate during the 10–5 min period before seizure onset. Error bars indicate the SEM. Coloring indicates bars beginning immediately before seizure onset that are consistently >2 SDs greater than the baseline average. A2, B2, C2, D2, Same data around seizure onset plotted in 1 s bins.
Figure 6.
Figure 6.
Many interneurons displayed significantly consistent preictal-increased (or preictal-decreased) activity. Number of dentate gyrus, CA3, CA1, and subicular interneurons classified as preictally increased, unchanged, or preictally decreased. Each bar represents a single interneuron and indicates the number of seizures when its firing rate during the last 30 s before seizure onset was greater than the average baseline firing rate for that seizure (top, dark blue part of bar) and the number of seizures when its preictal firing rate was less than baseline (bottom, light blue part of bar). For example, the first interneuron in the dentate gyrus was recorded during 59 seizures, 55 of which had higher preictal versus baseline firing rates and 4 of which had lower preictal versus baseline firing rates. Green and magenta shading indicates neurons classified as preictally increased or preictally decreased, respectively, based on comparison of preictal (last 30 s before seizure onset) and baseline firing rates averaged across all seizures for that neuron (>2 SDs from baseline average). Asterisks indicate neurons with significantly higher or lower preictal activity based on a scrambling test. White bars are neurons for which the scrambling test could not be performed, because firing rate variability was too high.
Figure 7.
Figure 7.
A1–C2, Average preictal activity of dentate gyrus, CA3, and CA1 interneurons classified as theta-on (A1, B1, C1) or theta-off (A2, B2, C2), depending on whether their average firing increased or decreased, respectively, during interictal theta waves. Horizontal cyan lines indicate the average baseline firing rate during the 10–5 min period before seizure onset. Error bars indicate the SEM. Coloring indicates bars beginning immediately before seizure onset that are consistently >2 SDs from the baseline average: magenta indicates higher than average, and blue indicates lower than average. The average firing rates of theta-on interneurons in all regions increased significantly preictally. All subicular interneurons were theta-on (Fig. 5D1). The average firing rates of theta-off interneurons in the dentate gyrus and CA1, but not CA3, decreased significantly before seizure onset. All plots use the same y-axis scale except that in B2.
Figure 8.
Figure 8.
Increased preictal firing of subicular interneurons was theta dependent, but preictal changes in the firing rate of interneurons in other hippocampal regions were at least partly theta independent. A1, Baseline and preictal theta/delta frequency ratios of all seizures during which dentate gyrus interneurons were recorded. Data from individual seizures are indicated by colored lines. Thick, black horizontal lines represent the average theta/delta frequency ratios 5.5–5.0 min (baseline) and 0.5–0 min before seizure onset (preictal). *p < 0.001, paired t test. A2, Seizures in which theta/delta frequency ratios increased from baseline to preictal periods were excluded, leaving only those in which theta/delta frequency ratios were unchanged or decreased preictally. B, Average firing rates of dentate gyrus interneurons 5.5–5.0 min (baseline) and 0.5–0 min before onset (preictal) of seizures without preictal theta (A2). Values represent the mean ± SEM. *p < 0.05, paired t test. C1, Average firing rates of all interneurons recorded in the dentate gyrus (n = 35) increased preictally during seizures without preictal theta activity (p < 0.05, paired t test). The right-most marker in the theta/delta frequency plot was calculated by dividing the average theta/delta frequency ratio during the preictal period by that of the baseline period (values in A2). Similarly, the right-most marker in the firing rate plot was calculated by dividing the preictal by the baseline average firing rate (values in B). The next set of markers to the left in C1 represent values calculated identically, except the baseline period was 6.0–5.5 min and the preictal period was 1.0–0.5 min before seizure onset, and so on. A green (magenta) asterisk indicates significantly higher (lower) average preictal versus baseline firing rates (p < 0.05, paired t test). All average preictal theta/delta frequency ratios were significantly lower than baseline (p < 0.05, paired t test), as expected, because seizures with preictal theta waves were excluded. C2, C3, Average action potential firing rates of theta-on interneurons recorded in the dentate gyrus (n = 31) increased preictally during seizures without preictal theta activity (C2), whereas theta-off interneurons (n = 4) reduced their average firing rate preictally (C3). D1, D2, Theta-on interneurons in CA1 (n = 21) increased their average firing rate preictally without preictal theta (D1), whereas theta-off interneurons in CA1 (n = 9) decreased their average firing rate preictally (D2). E, Theta-on interneurons in CA3 (n = 16) increased their average firing rate before seizure onset without preictal theta. F, In contrast, after excluding seizures with increased preictal theta activity, the average firing rate of subicular interneurons did not change significantly during the preictal period.
Figure 9.
Figure 9.
Action potential amplitude decreased slightly preictally in both preictally decreased and preictally increased interneurons. A, Average normalized firing rates of preictal-increase (green) and preictal-decrease (magenta) CA1 interneurons. B, Average normalized action potential amplitudes of preictal-increase and preictal-decrease CA1 interneurons. Note that the y-axis does not begin at zero.
Figure 10.
Figure 10.
Interneuron action potential firing rates and amplitudes during seizures. A1–A6, Example of a CA1 interneuron that displayed a brief pause in action potential firing at the onset of a spontaneous seizure and a later, longer period of inactivation during the seizure. High-temporal resolution view of seizure onset in broadband local field potential (A2) and isolated single-unit discharges of the interneuron (A1). The red line indicates seizure onset. A3, Local field potential (LFP), high-passed filtered (10 Hz). A4, Sorted single unit. Arrow indicates first pause in firing. A5, Interneuron action potentials averaged in 2 s bins. Each individual action potential recording is of 1 ms duration. A6, Firing rate. The time scale of perievent time histogram pertains to A3–A6. B, Number of seizures in which early and late drops in firing rate were detected. Data obtained from interneurons in all hippocampal regions. C, Average normalized action potential amplitudes and average normalized firing rates immediately before and during seizures. Onsets and durations of first and second drops in firing rate are indicated by shading.
Figure 11.
Figure 11.
Preictal activity patterns of putatively identified CA1 interneuron types. A1, A2, Interneuron types were identified based on theta phase preference (A1) and firing characteristics during sharp waves (A2). Putative bistratified (bistrat.), parvalbumin-positive basket cells (PV-BC), OLM cells, and an ivy cell were identified. Traces are local field potentials (top) and unit activity (bottom). A1, In theta-phase plots, red dashed vertical lines indicate positive peaks of the local field potential recorded in stratum oriens or pyramidale. Spike counts from 0° to 360° are duplicated through 720° for ease of viewing. A2, Zero is the peak amplitude of the sharp wave in the histograms. B, Preictal firing rate histograms of two putative bistratified neurons, OLM cells, PV-BCs, and an ivy cell. Cells in the top row correspond to cells in A. Horizontal cyan lines indicate the average baseline firing rate during the 10-5 min period before seizure onset. Error bars indicate SEM. Coloring indicates bars closely approaching seizure onset that are >2 SDs from the baseline average: magenta indicates higher than average, and blue indicates lower than average.

Similar articles

Cited by

References

    1. Avoli M, de Curtis M. GABAergic synchronization in the limbic system and its role in the generation of epileptiform activity. Prog Neurobiol. 2011;95:104–132. doi: 10.1016/j.pneurobio.2011.07.003. - DOI - PMC - PubMed
    1. Ben-Ari Y, Krnjević, Reinhardt W. Hippocampal seizures and failure of inhibition. Can J Physiol Pharmacol. 1979;57:1462–1466. doi: 10.1139/y79-218. - DOI
    1. Bland BH, Konopacki J, Dyck RH. Relationship between membrane potential oscillations and rhythmic discharges in identified hippocampal theta-related cells. J Neurophysiol. 2002;88:3046–3066. doi: 10.1152/jn.00315.2002. - DOI - PubMed
    1. Bower MR, Buckmaster PS. Changes in granule cell firing rates precede locally recorded spontaneous seizures by minutes in an animal model of temporal lobe epilepsy. J Neurophysiol. 2008;99:2431–2442. doi: 10.1152/jn.01369.2007. - DOI - PubMed
    1. Bragin A, Csicsvári J, Penttonen M, Buzsáki G. Epileptic afterdischarge in the hippocampal-entorhinal system: current source density and unit studies. Neuroscience. 1997;76:1187–1203. doi: 10.1016/S0306-4522(96)00446-0. - DOI - PubMed

Publication types