Review
. 2015 Apr 8:9:112.
doi: 10.3389/fnins.2015.00112. eCollection 2015.

Glycolysis and the significance of lactate in traumatic brain injury

Affiliations
Review

Glycolysis and the significance of lactate in traumatic brain injury

Keri L H Carpenter et al. Front Neurosci. .

Abstract

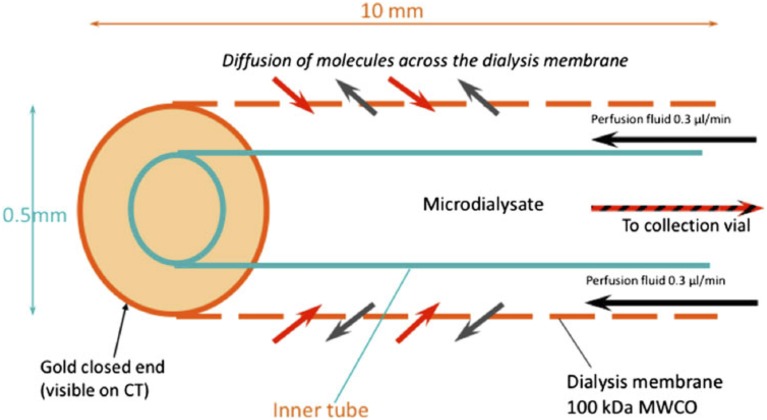
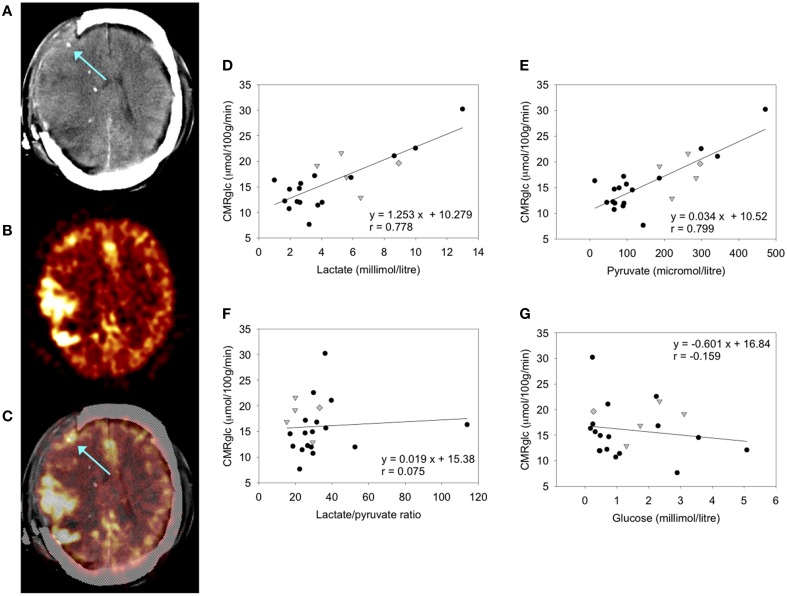
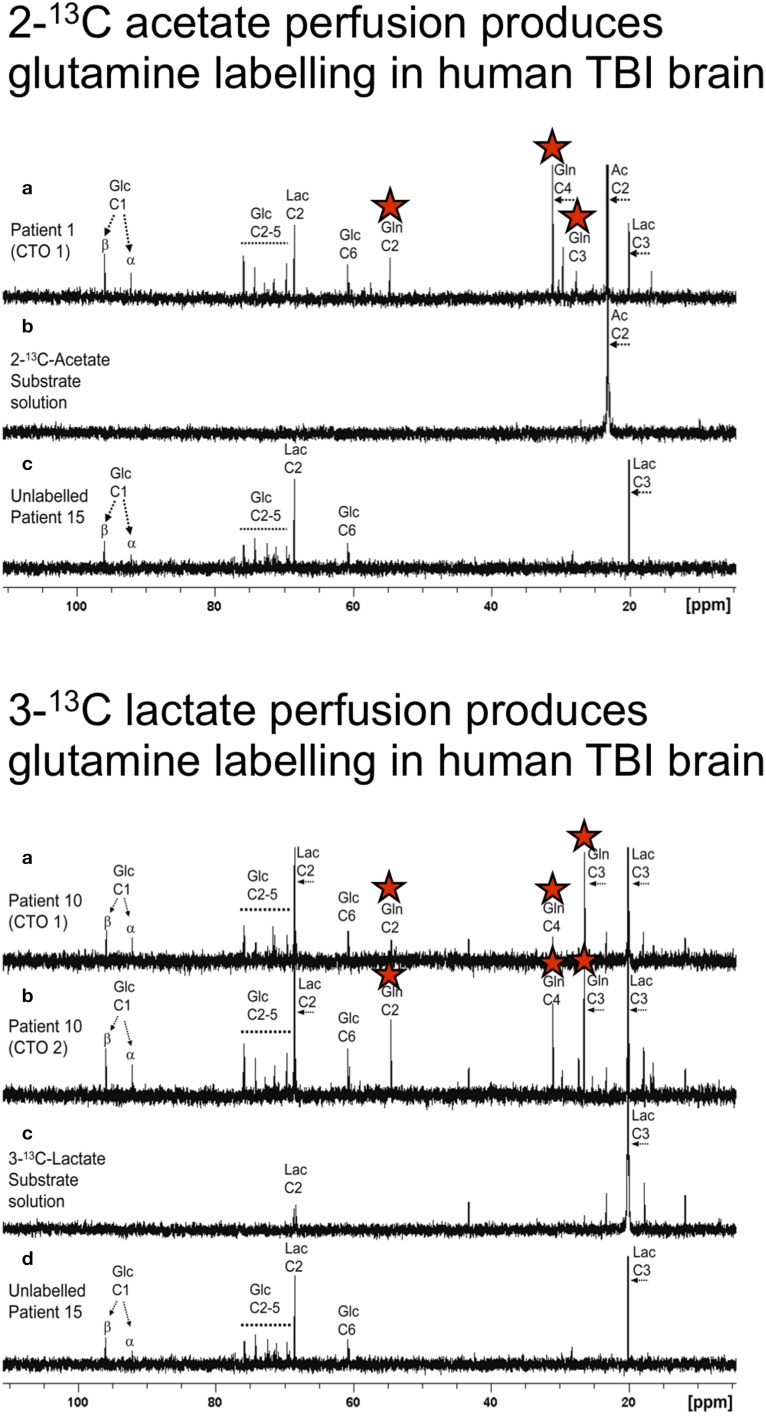
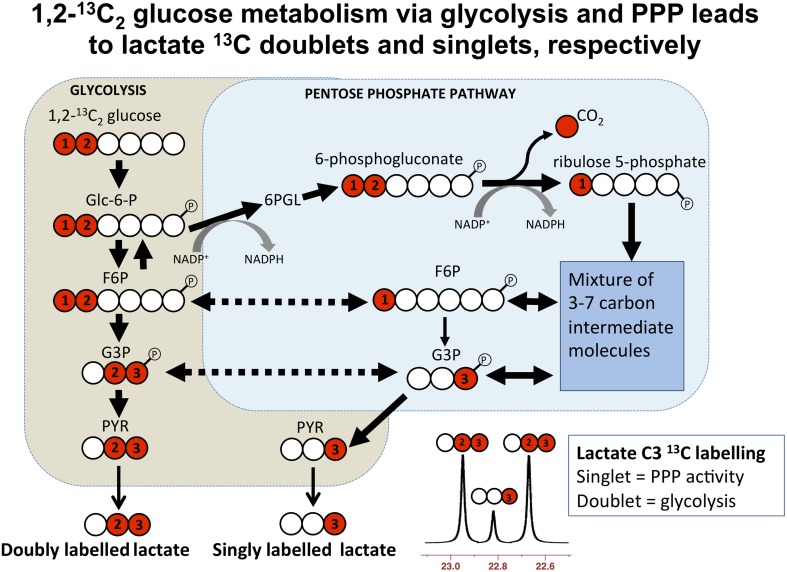
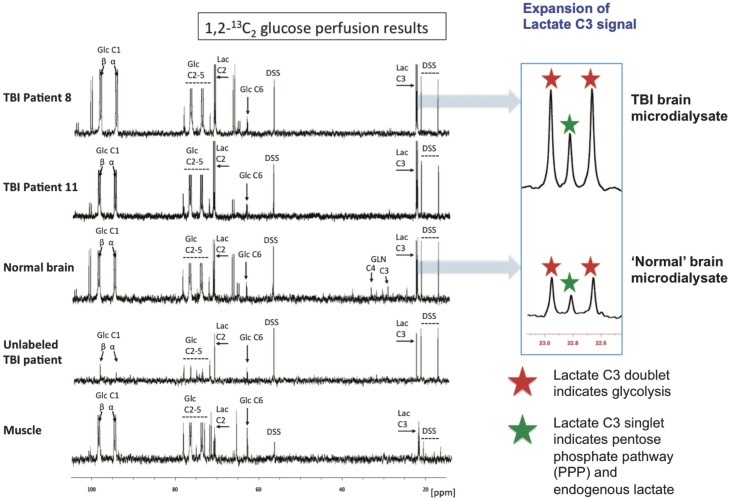
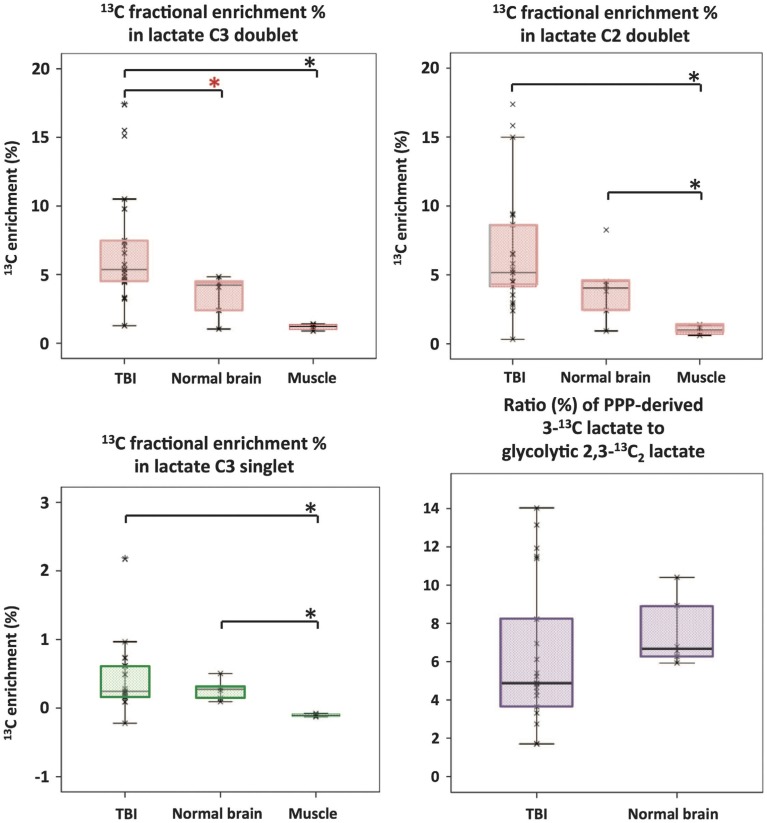
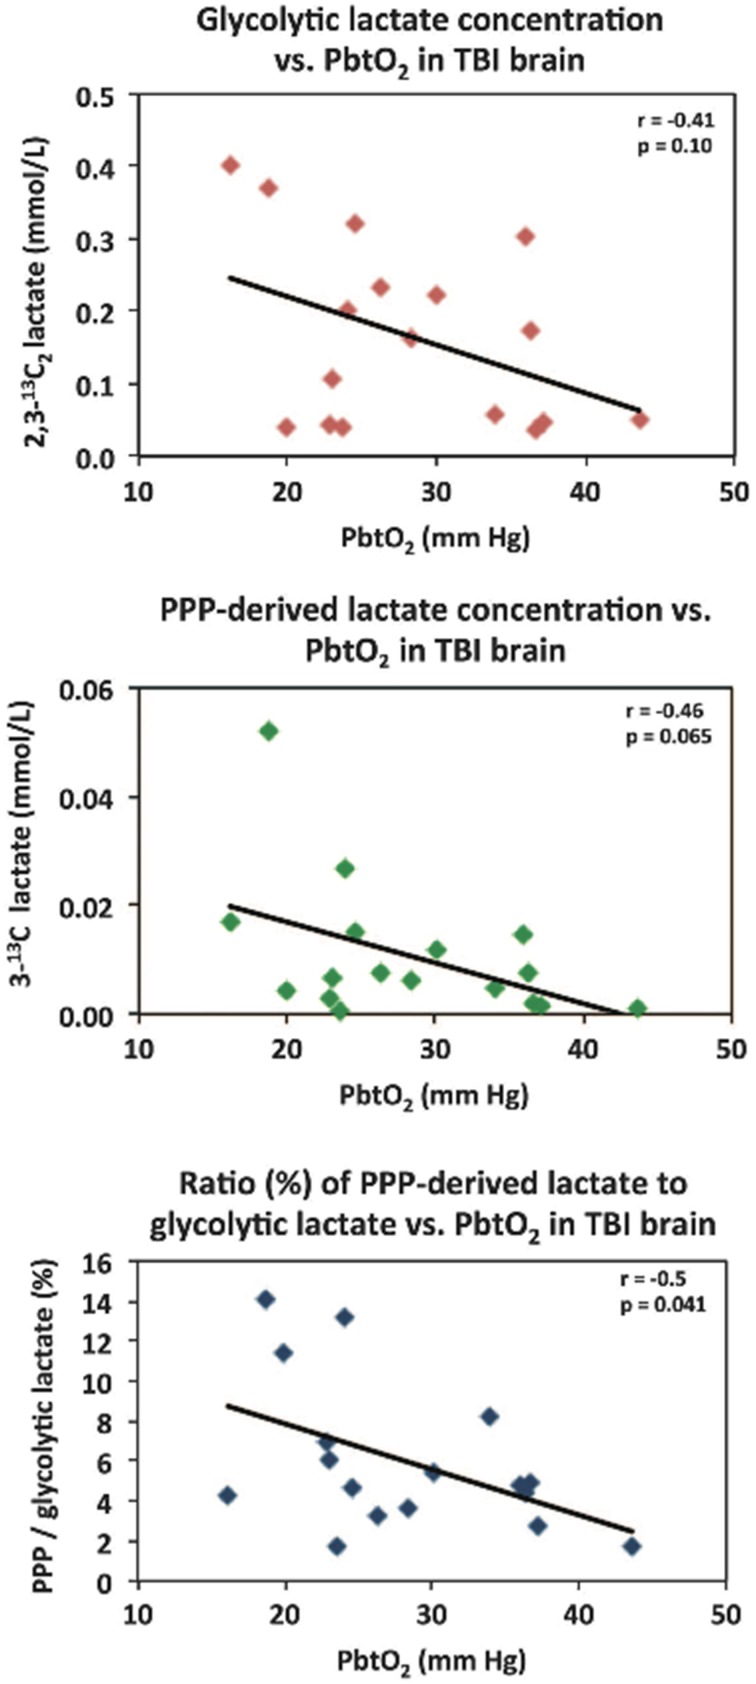
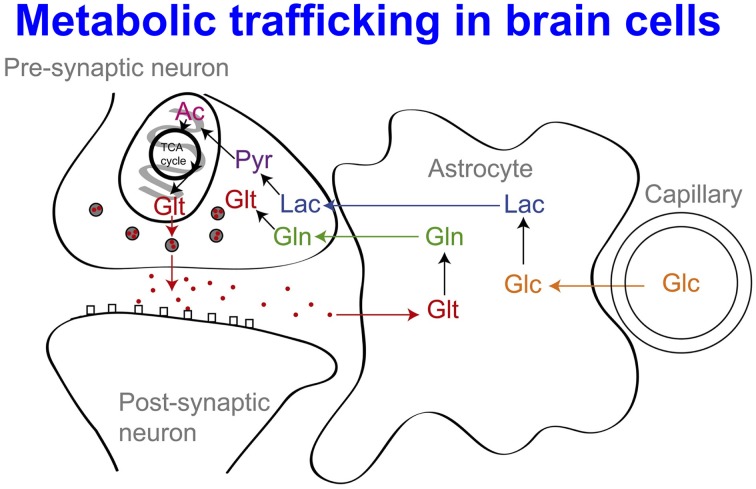
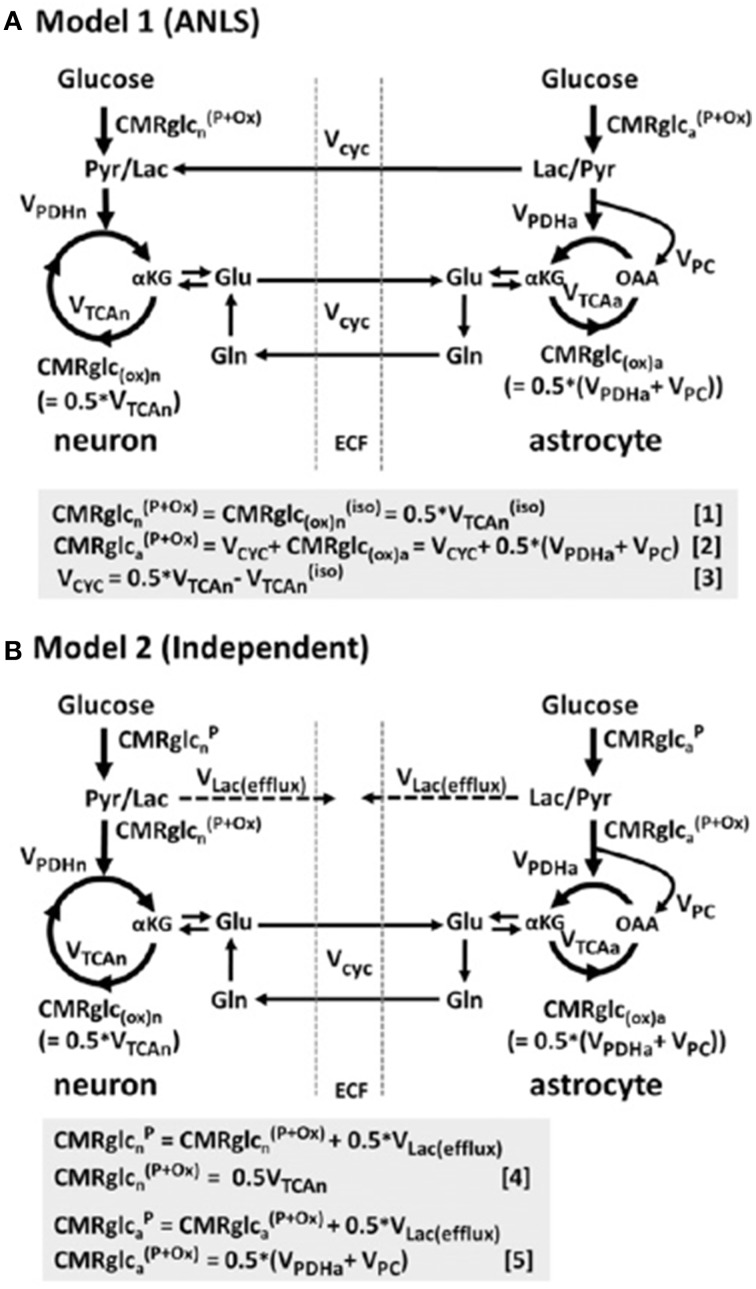
In traumatic brain injury (TBI) patients, elevation of the brain extracellular lactate concentration and the lactate/pyruvate ratio are well-recognized, and are associated statistically with unfavorable clinical outcome. Brain extracellular lactate was conventionally regarded as a waste product of glucose, when glucose is metabolized via glycolysis (Embden-Meyerhof-Parnas pathway) to pyruvate, followed by conversion to lactate by the action of lactate dehydrogenase, and export of lactate into the extracellular fluid. In TBI, glycolytic lactate is ascribed to hypoxia or mitochondrial dysfunction, although the precise nature of the latter is incompletely understood. Seemingly in contrast to lactate's association with unfavorable outcome is a growing body of evidence that lactate can be beneficial. The idea that the brain can utilize lactate by feeding into the tricarboxylic acid (TCA) cycle of neurons, first published two decades ago, has become known as the astrocyte-neuron lactate shuttle hypothesis. Direct evidence of brain utilization of lactate was first obtained 5 years ago in a cerebral microdialysis study in TBI patients, where administration of (13)C-labeled lactate via the microdialysis catheter and simultaneous collection of the emerging microdialysates, with (13)C NMR analysis, revealed (13)C labeling in glutamine consistent with lactate utilization via the TCA cycle. This suggests that where neurons are too damaged to utilize the lactate produced from glucose by astrocytes, i.e., uncoupling of neuronal and glial metabolism, high extracellular levels of lactate would accumulate, explaining the association between high lactate and poor outcome. Recently, an intravenous exogenous lactate supplementation study in TBI patients revealed evidence for a beneficial effect judged by surrogate endpoints. Here we review the current state of knowledge about glycolysis and lactate in TBI, how it can be measured in patients, and whether it can be modulated to achieve better clinical outcome.

Keywords: cerebral energy metabolism; glucose; glycolysis; lactate; microdialysis; pyruvate; traumatic brain injury (human).


Figures

Figure 1
Figure 1
Schematic of the microdialysis catheter tip. Substances in the extracellular fluid outside the catheter tip are able to diffuse across the microdialysis membrane to be collected for analysis. Abbreviation: MWCO, nominal molecular weight cut-off of the microdialysis membrane. Originally published by Shannon et al. (2013) in J Pharmacokinet Pharmacodyn 40: 343–458 under a Creative Commons Attribution Licence.
Figure 2
Figure 2
FDG-PET measurement of CMRglc and its relationship to brain microdialysate composition: (A–C) FDG-PET CMRglc map demonstrating relatively high FDG uptake at sites of injury, in contrast to less injured areas of the brain. (A) Computed tomography (CT) scan showing gold tip of microdialysis catheter (indicated by arrow). (B) Co-registered FDG-PET CMRglc map showing high FDG uptake at sites of injury. (C) Overlay of CT and co-registered CMRglc map, showing microdialysis catheter tip location (arrow). (D–F) Graphs illustrating relationships by linear regression (for 22 ROIs in 17 TBI patients) between FDG-PET derived CMRglc and the microdialysis parameters measured during the scan (D) lactate, (E) pyruvate, (F) lactate/pyruvate (L/P) ratio, and (G) glucose. For the linear regressions in (D–G), corresponding values of p (ANOVA) are <0.0001, <0.0001, 0.74, and 0.48, respectively. Data-points from catheters at craniotomy sites (four patients) are differentiated by gray triangles. Data-points from a second FDG-PET scan (one patient) are differentiated by gray diamonds. All other data-points are depicted as black circles (catheters inserted via cranial access device). Linear regressions presented on the graphs are for the entire (combined black plus gray symbols) dataset consisting of all 22 ROIs. Originally published by Hutchinson et al. (2009) in Acta Neurochir (Wien) 151: 51–61, and reproduced with kind permission of Springer Science+Business Media.
Figure 3
Figure 3
Upper panel: (a) Example of 13C NMR spectrum of brain microdialysate from a TBI patient, who received perfusion with 2-13C acetate (4 mM) by a microdialysis catheter via a craniotomy (CTO); red stars indicate 13C signals for glutamine C4, C3, and C2 indicating metabolism via TCA cycle. (b) 13C NMR spectrum of the 2-13C acetate substrate solution prior to perfusing. (c) 13C NMR spectrum of brain microdialysate from an unlabeled patient whose microdialysis catheter was perfused with plain perfusion fluid without labeled substrate. Lower panel: (a,b) Examples of 13C NMR spectra of brain microdialysates from a TBI patient, who received perfusion with 3-13C lactate (4 mM) by microdialysis catheters via a craniotomy (CTO); red stars indicate 13C signals for glutamine C4, C3, and C2 indicating metabolism via TCA cycle. (c) 13C NMR spectrum of the 3-13C lactate substrate solution prior to perfusing. (d) 13C NMR spectrum of brain microdialysate from an unlabeled patient [as in Upper panel (c)]. Originally published by Gallagher et al. (2009) in Brain 132: 2839–2849, and reproduced with permission of Oxford Journals.
Figure 4
Figure 4
Proton magnetic resonance spectra and conventional magnetic resonance images showing the volume of interest for spectroscopic imaging of a normal control (left panel), Patient 1 (central panel), and Patient 8 (right panel) with traumatic brain injury (TBI). On conventional MRI, Patient 1 shows a focal hematoma in the frontal left hemisphere and patient 8 shows diffuse MRI abnormalities. Spectra show decreases of N-acetylaspartate (NAA) and increases of choline (Cho) and lactate (La) in patients with TBI (a and b in central and right panels) with respect to the normal control (a in left panel). The spectra of Patient 1 (central panel) show more pronounced metabolic abnormalities than those of Patient 8 (right panel), despite the fact that Patient 8 showed markedly more abnormalities on conventional MRI. In the spectra of Patient 1 (central panel), metabolic abnormalities are clearly evident in the normal appearing brain. Finally, in Patient 1, voxels inside the focal hematoma (c in central panel) were excluded to avoid the artifacts that could be derived by the cerebral haemorrhagic contusion. Cr, creatine. Reproduced from J Neurol Neurosurg Psychiatry, Marino et al. 78: 501–507 (2007) with permission from BMJ Publishing Group Ltd.
Figure 5
Figure 5
Simplified schematic of steps in glycolysis and the pentose phosphate pathway (PPP), showing 13C labeling patterns resulting from 1,2-13C2 glucose substrate. Red fills indicate 13C atoms. Abbreviations: Glc-6-P, glucose-6-phosphate; 6PGL, 6-phosphogluconolactone; F6P, fructose-6-phosphate; G3P, glyceraldehyde-3-phosphate; PYR, pyruvate. Originally published by Carpenter et al. (2014) in Eur J Pharm Sci 57: 87–97 under a Creative Commons Attribution Licence.
Figure 6
Figure 6
Illustrative examples of 13C NMR spectra for microdialysates from patients who received perfusion with 1,2-13C2 glucose (4 mmol/L): TBI brain (uppermost two spectra, 24-h perfusion), “normal” brain (third spectrum, 24-h perfusion), and muscle (bottom spectrum, 8-h perfusion). An example of brain microdialysate from an unlabeled TBI patient with plain (unsupplemented) perfusion fluid is shown for comparison (fourth spectrum). Examples of expansion of the lactate C3 signal are shown for TBI brain and “normal” brain. Red stars indicate lactate C3 doublet (due to glycolytic 2,3-13C2 lactate) and green stars indicate C3 singlet (due to pentose phosphate pathway-derived 3-13C lactate plus endogenous lactate). Glucose (Glc), lactate (Lac), 4,4-dimethyl-4-silapentane-1-sulfonate sodium salt (DSS, the internal reference standard). Spectra were run from −20 to +250 p.p.m. The main reference DSS signal at 0 p.p.m. is not shown in the range illustrated. Originally published by Jalloh et al. (2015) in J Cereb Blood Flow Metab 35: 111–120, and reproduced with permission of Nature Publishing Group.
Figure 7
Figure 7
Microdialysate NMR measurements of 13C labeling: results from perfusion for 24-h- (brain: TBI or “normal”) or 8-h perfusion (muscle) with 1,2-13C2 glucose (4 mmol/L). Red asterisks denote P < 0.01 for TBI vs. “normal” brain (Mann–Whitney); other comparisons asterisked in black denote P < 0.05. Individual data points are shown by × symbols. Number of patients: 15 TBI, six “normal” brain, and four muscle. Originally published by Jalloh et al. (2015) in J Cereb Blood Flow Metab 35: 111–120, and reproduced with permission of Nature Publishing Group.
Figure 8
Figure 8
Relationships in TBI brain for glycolytic lactate and pentose phosphate pathway (PPP)-derived lactate vs. PbtO2. Concentrations of glycolytic 2,3-13C2 lactate (upper panel) and PPP-derived 3-13C lactate (middle panel) plotted vs. PbtO2. Lower panel: ratio (%) of PPP-derived 3-13C lactate to glycolytic 2,3-13C2 lactate, plotted vs. PbtO2. Each data point represents the results of NMR analysis of the combined contents of 24 × 1 h of microdialysate collection vials from one microdialysis catheter, plotted against the corresponding PbtO2 concentration expressed in mmHg, measured using a Licox oxygen probe placed alongside the microdialysis catheter in the brain. Lines are fitted by linear regression (statistics shown are Pearson's correlation coefficient r and analysis of variance P–value). Data are from 13 TBI patients. Four of these thirteen had a second period of monitoring, making 17 data points in total for each correlation. Originally published by Jalloh et al. (2015) in J Cereb Blood Flow Metab 35: 111–120, and reproduced with permission of Nature Publishing Group.
Figure 9
Figure 9
Glucose (Glc) from the vasculature is metabolized to lactate (Lac) in astrocytes, exported into the extracellular fluid, taken up by neurons and processed [via pyruvate (Pyr) and acetate (Ac)] by the TCA cycle. This spins off glutamate (Glt), which is released and then taken up by astrocytes, which convert it to glutamine (Gln), which is released into the extracellular fluid and taken up by neurons, which re-convert it to glutamate. For details of the relevant membrane transporters (see Chih and Roberts, ; Gallagher et al., ; Pellerin and Magistretti, 2012). Besides Lac production in situ from Glc, Lac may also be taken up from the circulation, (see Ide et al., ; Overgaard et al., ; Jalloh et al., 2013). For typical concentrations of the above species and PbtO2 (see Gallagher et al., ; Timofeev et al., 2011a,b). Originally published by Gallagher et al. (2009) in Brain 132: 2839–2849, and reproduced with permission of Oxford Journals.
Figure 10
Figure 10
Schematic depiction of two neuroenergetics models under consideration to account for the 1:1 flux relationship between increments in the rate of glutamate/glutamine cycling (Vcyc) and the TCA cycle flux in neurons (VTCAn). (A) ANLS-type model (Model 1). (B) Independent-type model (Model 2) in which neurons and astrocytes take up and oxidize glucose according to their respective energy needs. Phosphorylated glucose not oxidized within the cell may be effluxed as lactate, VLac(efflux), which is shown by dashed lines. The results of this study in rat brain suggested that neurons are capable of supporting a substantial fraction of their substrate requirements by direct uptake and phosphorylation of glucose. Originally published by Patel et al. (2014) in Proc Natl Acad Sci USA 111: 5385–5390, and reproduced with permission from Proc Natl Acad Sci USA.

References

    1. Alessandri B., Schwandt E., Kamada Y., Nagata M., Heimann A., Kempski O. (2012). The neuroprotective effect of lactate is not due to improved glutamate uptake after controlled cortical impact in rats. J. Neurotrauma 29, 2181–2191. 10.1089/neu.2011.2067 - DOI - PubMed
    1. Bak L. K., Walls A. B., Schousboe A., Ring A., Sonnewald U., Waagepetersen H. S. (2009). Neuronal glucose but not lactate utilization is positively correlated with NMDA-induced neurotransmission and fluctuations in cytosolic Ca2+ levels. J. Neurochem. 109 (Suppl. 1), 87–93. 10.1111/j.1471-4159.2009.05943.x - DOI - PubMed
    1. Bartnik B. L., Lee S. M., Hovda D. A., Sutton R. L. (2007). The fate of glucose during the period of decreased metabolism after fluid percussion injury: a 13C NMR study. J. Neurotrauma 24, 1079–1092. 10.1089/neu.2006.0210 - DOI - PubMed
    1. Bartnik B. L., Sutton R. L., Fukushima M., Harris N. G., Hovda D. A., Lee S. M. (2005). Upregulation of pentose phosphate pathway and preservation of tricarboxylic acid cycle flux after experimental brain injury. J. Neurotrauma 22, 1052–1065. 10.1089/neu.2005.22.1052 - DOI - PubMed
    1. Befroy D. E., Rothman D. L., Petersen K. F., Shulman G. I. (2012). (31)P-magnetization transfer magnetic resonance spectroscopy measurements of in vivo metabolism. Diabetes 61, 2669–2678. 10.2337/db12-0558 - DOI - PMC - PubMed