. 2015 Apr 8:6:63.
doi: 10.3389/fphar.2015.00063. eCollection 2015.

Voltage-sensing phosphatase modulation by a C2 domain

Affiliations

Voltage-sensing phosphatase modulation by a C2 domain

Paul M Castle et al. Front Pharmacol. .

Abstract

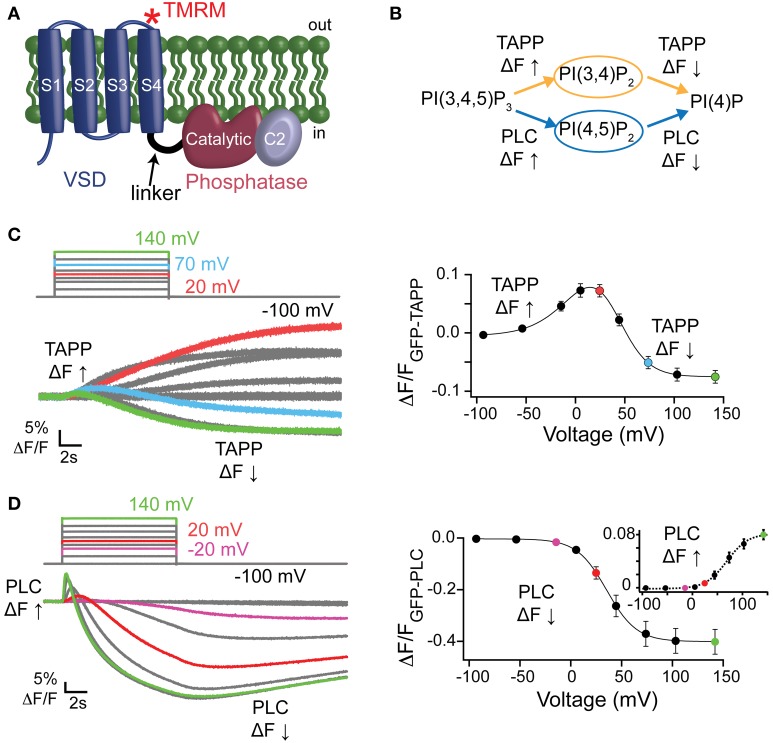
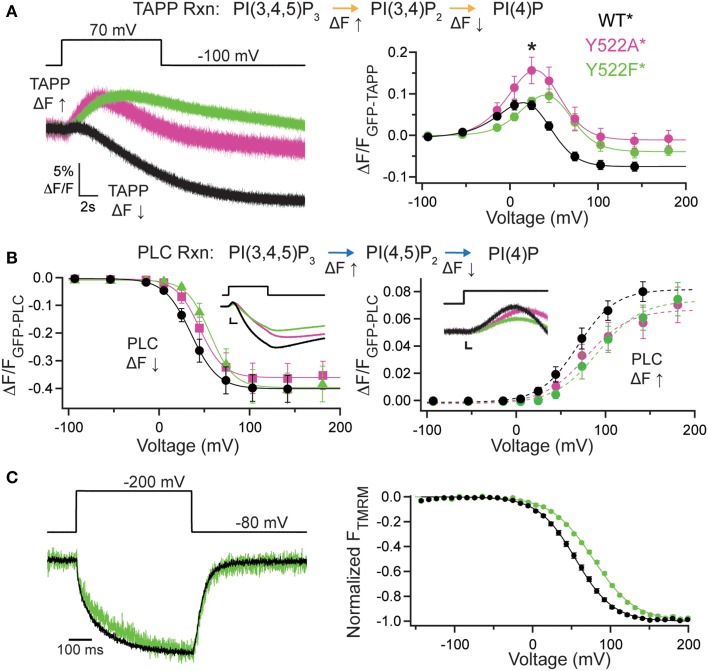
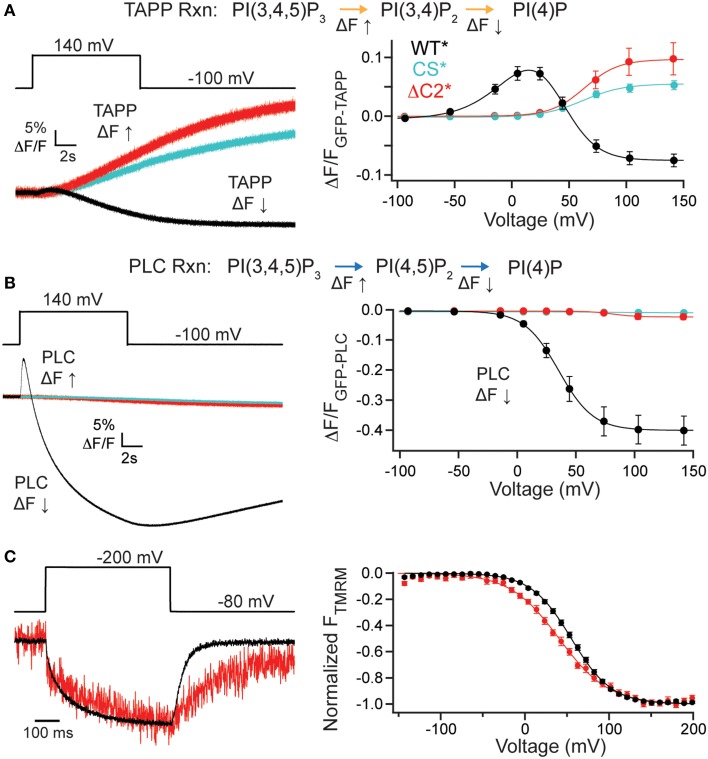
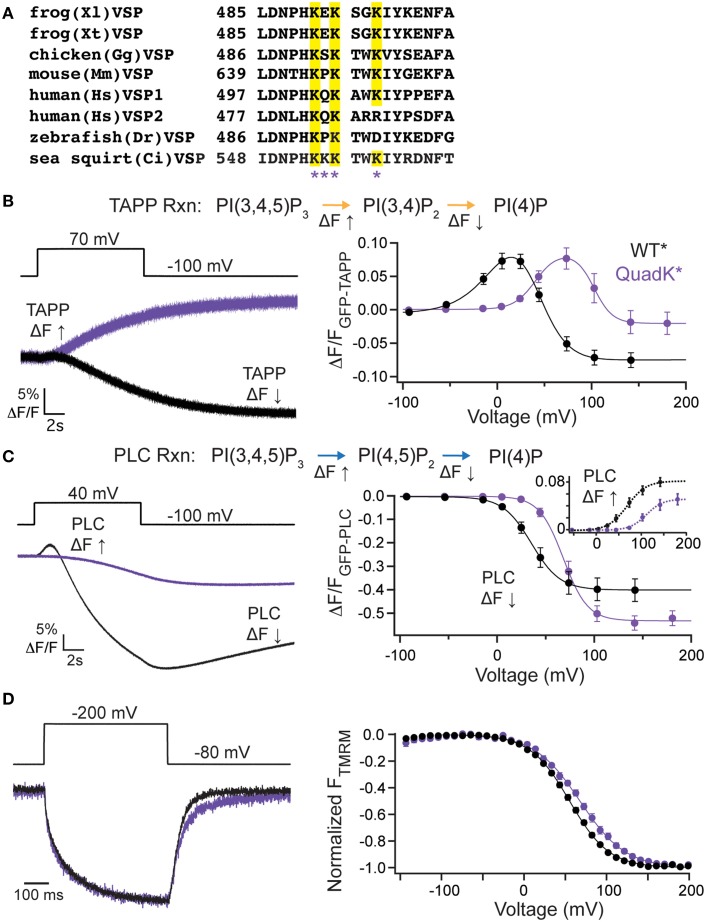
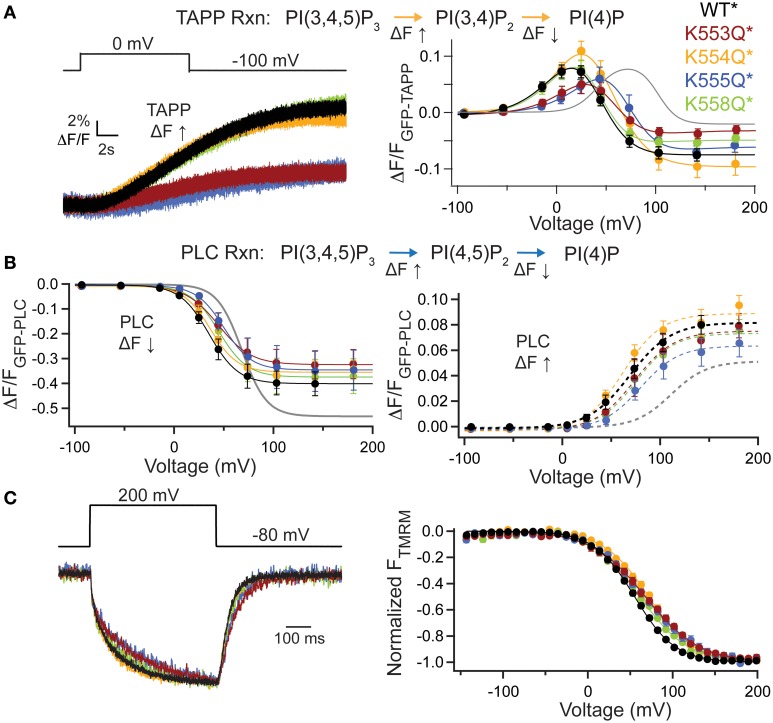
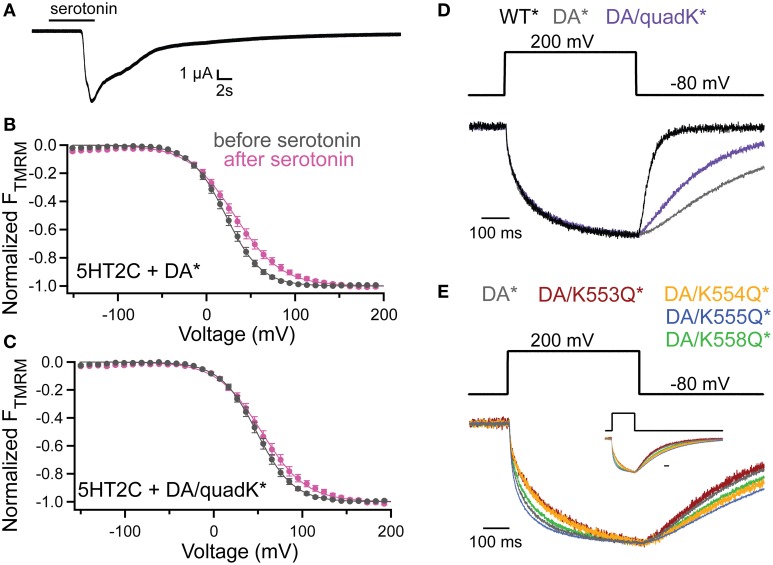
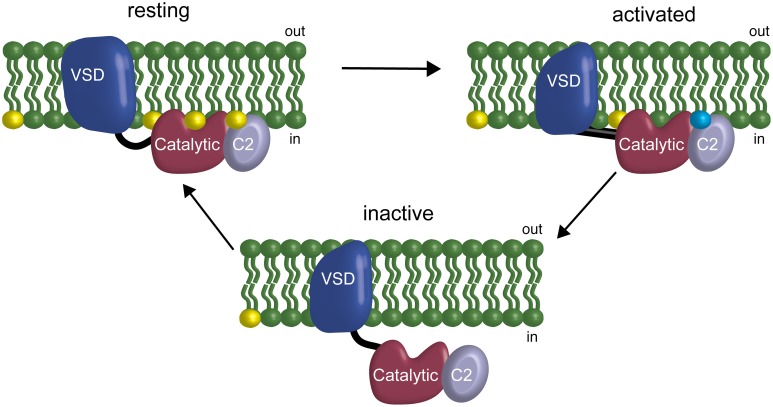
The voltage-sensing phosphatase (VSP) is the first example of an enzyme controlled by changes in membrane potential. VSP has four distinct regions: the transmembrane voltage-sensing domain (VSD), the inter-domain linker, the cytosolic catalytic domain, and the C2 domain. The VSD transmits the changes in membrane potential through the inter-domain linker activating the catalytic domain which then dephosphorylates phosphatidylinositol phosphate (PIP) lipids. The role of the C2, however, has not been established. In this study, we explore two possible roles for the C2: catalysis and membrane-binding. The Ci-VSP crystal structures show that the C2 residue Y522 lines the active site suggesting a contribution to catalysis. When we mutated Y522 to phenylalanine, we found a shift in the voltage dependence of activity. This suggests hydrogen bonding as a mechanism of action. Going one step further, when we deleted the entire C2 domain, we found voltage-dependent enzyme activity was no longer detectable. This result clearly indicates the entire C2 is necessary for catalysis as well as for modulating activity. As C2s are known membrane-binding domains, we tested whether the VSP C2 interacts with the membrane. We probed a cluster of four positively charged residues lining the top of the C2 and suggested by previous studies to interact with phosphatidylinositol 4,5-bisphosphate [PI(4,5)P2] (Kalli et al., 2014). Neutralizing those positive charges significantly shifted the voltage dependence of activity to higher voltages. We tested membrane binding by depleting PI(4,5)P2 from the membrane using the 5HT2C receptor and found that the VSD motions as measured by voltage clamp fluorometry (VCF) were not changed. These results suggest that if the C2 domain interacts with the membrane to influence VSP function it may not occur exclusively through PI(4,5)P2. Together, this data advances our understanding of the VSP C2 by demonstrating a necessary and critical role for the C2 domain in VSP function.

Keywords: C2 domain; PH domains; PIP; membrane potential; voltage clamp fluorometry; voltage-sensing phosphatase.


Figures

Figure 1
Figure 1
Activity of Ci-VSP in oocytes using PIP sensitive PH domains. (A) Cartoon of VSP with the VSD, linker, catalytic and C2 domains labeled. Asterisk depicts location of the TMRM probe (G214C-TMRM). (B) VSP reactions where the PI(3,4)P2 sensitive GFP-TAPP-PH monitors the upper reactions (orange) and the PI(4,5)P2 sensitive GFP-PLC-PH monitors the lower reactions (blue). (C, left) Representative GFP-TAPP-PH traces for WT* Ci-VSP during several voltage steps from a holding potential (hp) of −100 mV and with recovery time between each step. A fluorescence increase indicates an increase of PI(3,4)P2 on the membrane while a fluorescence decrease indicates a decrease of PI(3,4)P2 on the membrane; 20 mV = red, 70 mV = cyan, 140 mV = green. The fluorescence may keep changing even after the end of the voltage step. This is a function of the affinity of the PH domain and not an indication of voltage independent Ci-VSP activity. (C, right) ΔF/F TAPP fluorescence vs. voltage relationship (FV) with the fluorescence increase (net 5-phosphatase reaction) predominating at lower voltages and the fluorescence decrease (net 3-phosphatase reaction) predominating at higher voltages. Data fit with a double Boltzmann equation. (D, left) Representative traces of GFP-PLC-PH co-expressed with WT* during several voltage steps as in (C). The fluorescence increase indicates an increase of PI(4,5)P2 on the membrane while the fluorescence decrease indicates a decrease of PI(4,5)P2 on the membrane; −20 mV = purple, 20 mV = red, 140 mV = green. (D, right) ΔF/F PLC FV with the fluorescence decrease (FV Down, net 5-phosphatase reaction, solid line) and the fluorescence increase (FV Up, 3-phosphatase reaction, dashed line, inset) separated. Data fit with a Boltzmann equation. All error bars are ± s.e.m; n ≥ 16. Some errors bars are smaller than the size of the symbols.
Figure 2
Figure 2
Third inactivated calcium-binding loop from C2 domain shifts voltage dependence of VSP activity. (A, left) Representative GFP-TAPP-PH trace during a step from an hp of −100 mV to +70 mV for WT* (black), Y522A* (magenta) and Y522F* (green). Both Y522A* and Y522F* show a similar fluorescence increase and decrease during the course of the voltage step indicating both PI(3,4)P2 production and depletion while WT* shows mainly a fluorescence decrease at this voltage, indicating PI(3,4)P2 depletion. TAPP-PH reaction listed on top. (A, right) ΔF/F TAPP FV. Both Y522A* and Y522F* show pronounced fluorescence decreases at higher voltages, indicating both cause PI(3,4)P2 depletion at higher voltages. Y522F* shifted the voltage dependence of activity by 14–18 mV (Table 1) and Y522A* increased the peak amplitude of the response (Student t-test, *p ≤ 0.05), suggesting the importance of both the size and hydrogen bonding of position 522, n ≥ 8. Data fit with a double Boltzmann. (B, left) ΔF/F PLC FV Down. The fluorescence decrease FV (net 5-phosphatase activity) from GFP-PLC-PH fit with a Boltzmann. Inset shows 40 mV step representative traces. Scale bars for inset are 5% ΔF/F and 2 s. Colors as in (A). Y522F* shifted the voltage dependence by 21 mV (Table 1). PLC-PH reaction listed on top. (B, right) ΔF/F PLC FV Up. The fluorescence increase FV (net 3-phosphatase activity) from the same GFP-PLC-PH data as in (B, left), fit with a Boltzmann. Inset shows enlarged 40 mV step representative traces (same as in B, left). Scale bars for inset are 1% ΔF/F and 0.2 s. Both Y522A* and Y522F* show statistically significant voltage-dependent shifts of activity to higher voltages (Table 1), n ≥ 6 (C, left) Representative TMRM fluorescence trace during a step from an hp of −80 to +200 mV for WT* and Y522F*. Colors as in (A). Traces are normalized to the maximal fluorescence change. The voltage trace reports the actual voltage recorded during acquisition. Y522F* causes a small deceleration of the VSD activation relative to WT*. (C, right) Normalized TMRM FV. Data fit to single Boltzmann equation and normalized to the fit. Y522F* shifted the voltage dependence of the VSD motions by over 20 mV, n ≥ 10, WT* V1/2 = 55.1 ± 0.4, slope = 23.9 ± 0.4; Y522F* V1/2 = 77.8 ± 0.6, slope = 26.8 ± 0.5. All error bars are ± s.e.m. Some errors bars are smaller than the size of the symbols.
Figure 3
Figure 3
C2 domain required for VSP activity. (A, left) Representative GFP-TAPP-PH trace during a single voltage step from an hp of −100 mV to +140 mV for WT* (black), ΔC2* (red), and CS* (cyan). ΔC2* shows minimal activity above endogenous levels (CS*). TAPP-PH reaction listed on top. (A, right) ΔF/F TAPP FV. ΔC2* activity not significantly different from CS* indicating only endogenous activity even at the highest voltage recorded, n ≥ 9. Data fit with a single Boltzmann. (B, left) Representative GFP-PLC-PH co-expressed with WT*, ΔC2*, and CS* during a +140 mV step. WT* shows the characteristic increase and decrease in fluorescence indicating both PI(4,5)P2 production and depletion while ΔC2* and CS* show almost no change in fluorescence. PLC-PH reaction listed on top. (B, right) ΔF/F PLC FV Down (net 5-phosphatase reaction). ΔC2* shows no activity (either 3- or 5-phosphatase) beyond that of endogenous VSPs in the oocytes. Colors as in (A), n ≥ 9. (C, left) Representative TMRM fluorescence trace during a step from a hp = −80 to +200 mV for WT* and ΔC2*. Traces are normalized to the maximal fluorescence change. The voltage trace reports the actual voltage recorded during acquisition. ΔC2* has similar VSD activation kinetics to WT* but slower deactivation kinetics. (C, right) Normalized TMRM FV. Data fit to single Boltzmann equations and normalized to the fit. The ΔC2* voltage dependence is shifted to lower voltages. WT* V1/2 = 55.1 ± 0.4, slope = 23.9 ± 0.4; ΔC2* V1/2 = 41 ± 1, slope = 29 ± 1. Error bars are ± s.e.m., n ≥ 11. Some errors bars are smaller than the size of the symbols.
Figure 4
Figure 4
C2 domain positive charge cluster significantly shifts voltage-dependent activity. (A, left) Alignment of the fourth inactivated CBL from several species of VSP. Quadruple Lys mutant, quadK*, positions highlighted by asterisks. Conserved Lys shown in yellow. (B, left) Representative GFP-TAPP-PH trace during a step from an hp of −100 mV to +70 mV for WT* (black) and quadK* (purple). QuadK* shows significant levels of PI(3,4)P2 production while WT* shows predominantly PI(3,4)P2 depletion during a 70 mV step. TAPP-PH reaction listed on top. (B, right) ΔF/F TAPP FV. QuadK* significantly shifts the PI(3,4)P2 production and depletions to higher voltages (>40 mV, Table 1), n ≥ 6. Data fit with a double Boltzmann. (C, left) Representative GFP-PLC-PH trace during a step from an hp of −100 mV to +40 mV for WT* and quadK, colors as in (B). QuadK* again shows a different level of PI(4,5)P2 production as compared to wild type. PLC-PH reaction listed on top. (C, right) ΔF/F PLC FV with the fluorescence decrease (Down, net 5-phosphatase reaction) in solid lines and the fluorescence increase shown in inset with dashed lines (Up, net 3-phosphatase reaction). QuadK* significantly shifted the PI(4,5)P2 production and depletion to higher voltages (>30 mV, Table 1), n ≥ 7. Data fit with a Boltzman. (D, left) Representative TMRM fluorescence trace during a step from an hp of −80 to +200 mV for WT* and quadK*. Colors as in (B). Traces are normalized to the maximal fluorescence change. The voltage trace reports the actual voltage recorded during acquisition. QuadK* does not significantly influence the VSD activation kinetics while slowing the deactivation kinetics modestly. (D, right) Normalized TMRM FV. A small (12 mV) shift in the voltage dependence of VSD motions with quadK*. Data fit to single Boltzmann equations and normalized to the fit, n ≥ 10, WT* V1/2 = 55.1 ± 0.4, slope = 23.9 ± 0.4; quadK* V1/2 = 67.6 ± 0.7, slope = 27.4 ± 0.6. All error bars are ± s.e.m. Some errors bars are smaller than the size of the symbols.
Figure 5
Figure 5
Individual mutations in the C2 positive charge cluster shift some, not all activity. (A, left) Representative GFP-TAPP-PH trace during a step from an hp of −100 mV to 0 mV for WT* (black), K553Q* (rust), K554Q* (orange), K555Q* (blue), and K558Q* (green). Both K553Q* and K555Q* show a smaller change in fluorescence compared to WT*, K554Q*, and K558Q*, indicating less PI(3,4)P2 production at 0 mV. TAPP-PH reaction listed on top. (A, right) ΔF/F TAPP FV. Both K553Q* and K555Q* show significant shifts in the voltage dependence of activity (10–30 mV) and their sum recapitulates the net 5-phosphtase shift from quadK*, but not the net 3-phosphatase shift (gray line shows quadK*), n ≥ 6. Data fit with a double Boltzmann. (B, left) ΔF/F PLC FV Down (net 5-phosphatase activity) from GFP-PLC-PH co-expressed with individual Lys to Gln mutations, fit with a single Boltzmann. Any shift in the voltage dependence is not significant (Table 1). Colors as in (A), n ≥ 6. PLC-PH reaction listed on top. (B, right) ΔF/F PLC FV Up (net 3-phosphatase activity) from the same GFP-PLC-PH data as in (B, left), fit with a single Boltzmann. Again, none of the V1/2 shifts are significant (Table 1), n ≥ 6. (C, left) Representative TMRM fluorescence trace during a step from an hp of −80 to +200 mV for WT*, K553Q*, K554Q*, K555Q*, and K558Q*. Colors are as in (A). Traces are normalized to the maximal fluorescence change. The voltage trace reports the actual voltage recorded during acquisition. K553Q* and K555Q* slightly slow down the activation and deactivation kinetics of the VSD motions. (C, right) Normalized TMRM FV. All Lys to Gln mutations shifted the VSD motions by 6–17 mV to higher voltages. Data fit to single Boltzmann equations and normalized to the fit, n ≥ 9. WT* V1/2 = 55.1 ± 0.4, slope = 23.9 ± 0.4; K553Q* V1/2 = 68 ± 1, slope = 32 ± 1; K554Q* V1/2 = 71.8 ± 0.8, slope = 26.6 ± 0.7; K555Q* V1/2 = 67.3 ± 0.9, slope = 30.8 ± 0.9; K558Q* V1/2 = 61.3 ± 0.9, slope = 28.7 ± 0.9. All error bars are ± s.e.m.
Figure 6
Figure 6
PI(4,5)P2 depletion does not alter voltage dependence of VSD motions. (A) Current trace showing the activation of the endogenous Ca2+-activated chloride channel following addition of serotonin in oocytes expressing the 5HT2C receptor and Ci-VSP. 5HT2C receptor activation of the oocyte PLC pathway results in the conversion of PI(4,5)P2 into IP3 and DAG. The IP3 causes an increase in intracellular Ca2+ leading to the activation of the chloride channel. hp = −80 mV. (B,C) TMRM FVs before (black) and 10 min after (magenta) application of 10 μM serotonin. Activation of PLC through the 5HT2C receptor leads to depletion of PI(4,5)P2 in the membrane and results in a shift in the DA* (B) and DA/quadK* (C) TMRM FVs after addition of serotonin. In both cases, the VSD motions are sensitive to the PI(4,5)P2 in the membrane, indicating that the DA/quadK* may not depend on PI(4,5)P2 in the membrane to cause the activity shifts seen in Figure 4. DA* (no serotonin) V1/2 = 21.8 ± 0.3, slope = 19.9 ± 0.2; DA* (serotonin) V1/2 = 31.7 ± 0.6, slope = 26.2 ± 0.5; DA/quadK* (no serotonin) V1/2 = 48.3 ± 0.2, slope = 20.7 ± 0.2; DA/quadK* (serotonin) V1/2 = 54.0 ± 0.6, slope = 25.0 ± 0.5. All error bars are ± s.e.m. (D) Representative TMRM fluorescence traces during a step from an hp of −80 to +200 mV for WT* (black), DA*(gray), and DA/quadK* (purple). Traces are normalized to the maximal fluorescence change. DA* significantly slows down the repolarization kinetics while DA/quadK* kinetics were faster. (E) Representative TMRM fluorescence traces during a step from an hp of −80 to +200 mV for DA* (black), DA/K553Q* (rust), DA/K554Q* (orange), DA/K555Q* (blue), and DA/K558Q* (green). Traces are normalized to the maximal fluorescence change. The voltage trace reports the actual voltage recorded during acquisition. Inset shows full acquisition with the fluorescence returning to baseline. Scale bar for inset is 100 ms. All Lys to Gln mutations in the D331A background maintained the slow or slower kinetics from DA* alone. The individual mutations do not sum to equal the effect observed for DA/quadK* in (D).
Figure 7
Figure 7
Model of the C2 domain interaction with the membrane and influence in a feedback mechanism. At resting membrane potentials, the phosphatase domain is on the membrane but inactive. At activating membrane potentials, the VSD changes the conformation of the linker allowing activation of the active site and starts the depletion of the PIPs on the membrane. If the VSD does not deactivate, the subsequent depletion of PIPs leads the phosphatase domain to unbind from the membrane, effectively turning off catalysis without changing the activation state of the VSD. This feedback is driven by the phosphatase domain interacting with the membrane via PIPs at the linker (Kohout et al., 2010), the catalytic domain and potentially the C2 domain. Yellow indicates PI(4,5)P2 in the membrane. Blue indicates unknown negatively charged lipid in the membrane that could be one of the other substrates for VSP: PI(3,4,5)P3 or PI(3,4)P2.

Similar articles

Cited by

References

    1. Aguissa-Touré A.-H., Li G. (2012). Genetic alterations of PTEN in human melanoma. Cell. Mol. Life Sci. 69, 1475–1491. 10.1007/s00018-011-0878-0 - DOI - PMC - PubMed
    1. Balla T. (2013). Phosphoinositides: tiny lipids with giant impact on cell regulation. Physiol. Rev. 93, 1019–1137. 10.1152/physrev.00028.2012 - DOI - PMC - PubMed
    1. Corbalán-García S., Sánchez-Carrillo S., García-García J., Gómez-Fernández J. C. (2003). Characterization of the membrane binding mode of the C2 domain of PKC epsilon. Biochemistry 42, 11661–11668. 10.1021/bi034850d - DOI - PubMed
    1. Dai H., Tomchick D. R., García J., Südhof T. C., Machius M., Rizo J. (2005). Crystal structure of the RIM2 C2A-domain at 1.4 A resolution. Biochemistry 44, 13533–13542. 10.1021/bi0513608 - DOI - PubMed
    1. Di Paolo G., De Camilli P. (2006). Phosphoinositides in cell regulation and membrane dynamics. Nature 443, 651–657. 10.1038/nature05185 - DOI - PubMed