Review
. 2015 Jul;205(1):22-32.
doi: 10.2214/AJR.15.14552. Epub 2015 Apr 23.

Ultrasound Elastography and MR Elastography for Assessing Liver Fibrosis: Part 1, Principles and Techniques

Affiliations
Review

Ultrasound Elastography and MR Elastography for Assessing Liver Fibrosis: Part 1, Principles and Techniques

An Tang et al. AJR Am J Roentgenol. 2015 Jul.

Abstract

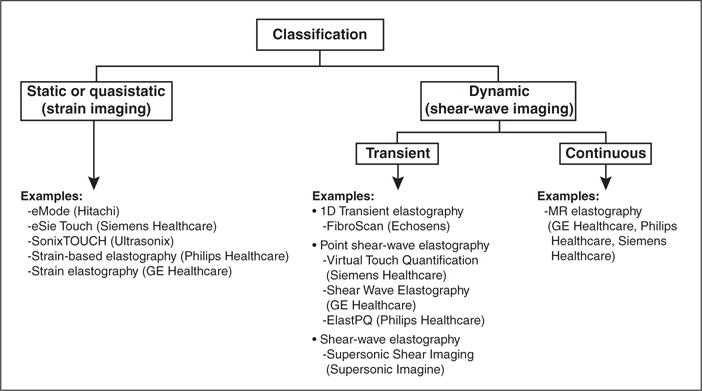
Objective: The purpose of this article is to provide an overview of ultrasound and MR elastography, including a glossary of relevant terminology, a classification of elastography techniques, and a discussion of their respective strengths and limitations.

Conclusion: Elastography is an emerging technique for the noninvasive assessment of mechanical tissue properties. These techniques report metrics related to tissue stiffness, such as shear-wave speed, magnitude of the complex shear modulus, and the Young modulus.

Keywords: MR elastography (MRE); MRI; elasticity; elastography; liver fibrosis; shear stiffness; shear wave; ultrasound; viscoelasticity; viscosity.


Figures

Fig. 1
Fig. 1
Classification of elastographic techniques with focus on current commercial techniques.
Fig. 2
Fig. 2
Current elastography techniques A–H, Illustrations (A, C, E, and G; all by Tang A) show probe location, source of shear-wave generation (blue arrows), direction of shear-wave propagation, and FOV (black outline). Also shown are companion images (B, D, F, and H) produced by each elastography technique: 1D transient elastography (A and B; FibroScan image [B] courtesy of Echosens), point shear wave elastography (C and D), shear-wave elastography (E and F), and MR elastography (G and H).
Fig. 2
Fig. 2
Current elastography techniques A–H, Illustrations (A, C, E, and G; all by Tang A) show probe location, source of shear-wave generation (blue arrows), direction of shear-wave propagation, and FOV (black outline). Also shown are companion images (B, D, F, and H) produced by each elastography technique: 1D transient elastography (A and B; FibroScan image [B] courtesy of Echosens), point shear wave elastography (C and D), shear-wave elastography (E and F), and MR elastography (G and H).
Fig. 3
Fig. 3
MR elastography experiment works on clinical MRI scanners and requires five components: driver system to generate mechanical waves, phase-contrast multiphase pulse sequence with motion-encoding gradients that are synchronized to mechanical waves, acquisition of phase-sensitive MR images that contain raw data on wave motion and can also provide anatomic images, postprocessing to generate wave images and stiffness maps (also known as elastograms), and ROI analysis to produce single stiffness value. (Photographs by Tang A)
Fig. 4
Fig. 4
Generic MR elastography sequence. Trigger pulse synchronizes mechanical vibration and motion-encoding gradient. In this diagram, motion-encoding gradient is applied using slice-select gradient. Motion-encoding gradients are applied successively in x, y, and z directions (when generating data for 3D inversion) and switched in polarity. In this diagram, frequency of motion-encoding gradient matches frequency of cyclic mechanical vibrations. Varying trigger delay shifts phase of mechanical wave relative to pulse sequence (motion-encoding gradient), allowing generation of data that capture propagation of wave displacements and that can be played as cine loop. Typically, four phase offsets are applied. Interpolation is applied to double number of phase offsets, from four to eight wave images to generate fluid cine loop.
Fig. 5
Fig. 5
MR elastography in different subjects correlated with biopsy-documented fibrosis stages. A–J, Axial wave cine loops (A–E) and corresponding axial elastogram images (F–J) are shown for subjects with fibrosis stages 0–4. Color elastogram represents magnitude of complex shear modulus with scale from 0 to 8 kPa.

Similar articles

Cited by

References

    1. Sarvazyan AP, Rudenko OV, Swanson SD, Fowlkes JB, Emelianov SY. Shear wave elasticity imaging: a new ultrasonic technology of medical diagnostics. Ultrasound Med Biol. 1998;24:1419–1435. - PubMed
    1. Sandrin L, Fourquet B, Hasquenoph JM, et al. Transient elastography: a new noninvasive method for assessment of hepatic fibrosis. Ultrasound Med Biol. 2003;29:1705–1713. - PubMed
    1. Nightingale K, McAleavey S, Trahey G. Shear-wave generation using acoustic radiation force: in vivo and ex vivo results. Ultrasound Med Biol. 2003;29:1715–1723. - PubMed
    1. Muthupillai R, Lomas DJ, Rossman PJ, Greenleaf JF, Manduca A, Ehman RL. Magnetic resonance elastography by direct visualization of propagating acoustic strain waves. Science. 1995;269:1854–1857. - PubMed
    1. Tang A, Cloutier G, Szeverenyi NM, Sirlin CB. Ultrasound elastography and MR elastography for assessing liver fibrosis. Part 2. Diagnostic performance, confounders, and future directions. AJR. 2015:206. (in press) - PMC - PubMed

Publication types