. 2015 Apr 23:4:e06967.
doi: 10.7554/eLife.06967.

Mapping and analysis of Caenorhabditis elegans transcription factor sequence specificities

Affiliations

Mapping and analysis of Caenorhabditis elegans transcription factor sequence specificities

Kamesh Narasimhan et al. Elife. .

Abstract

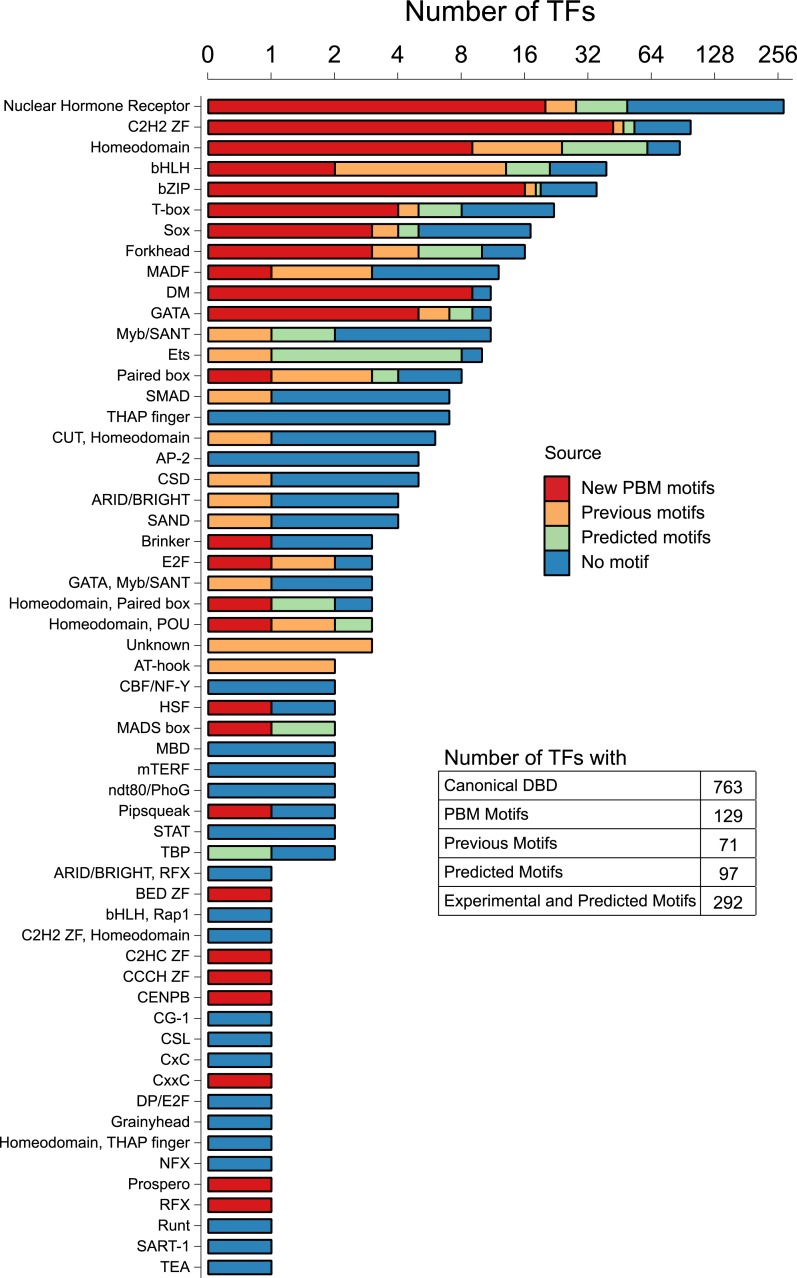
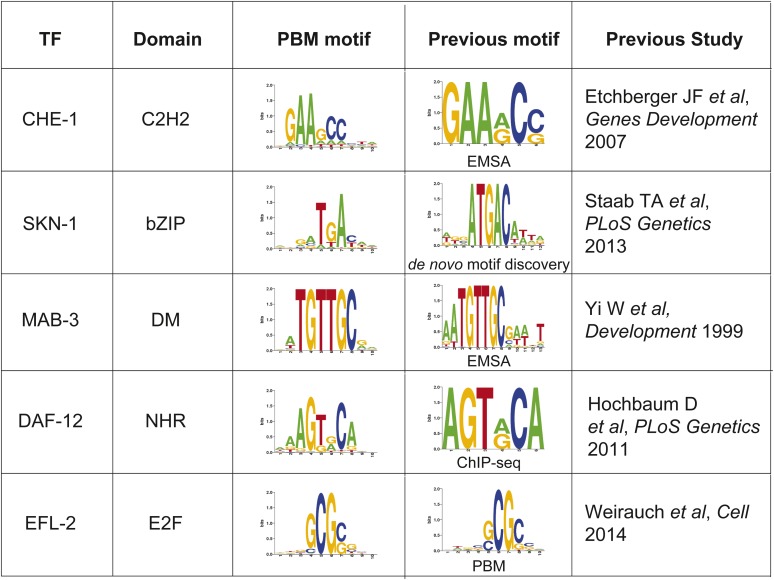
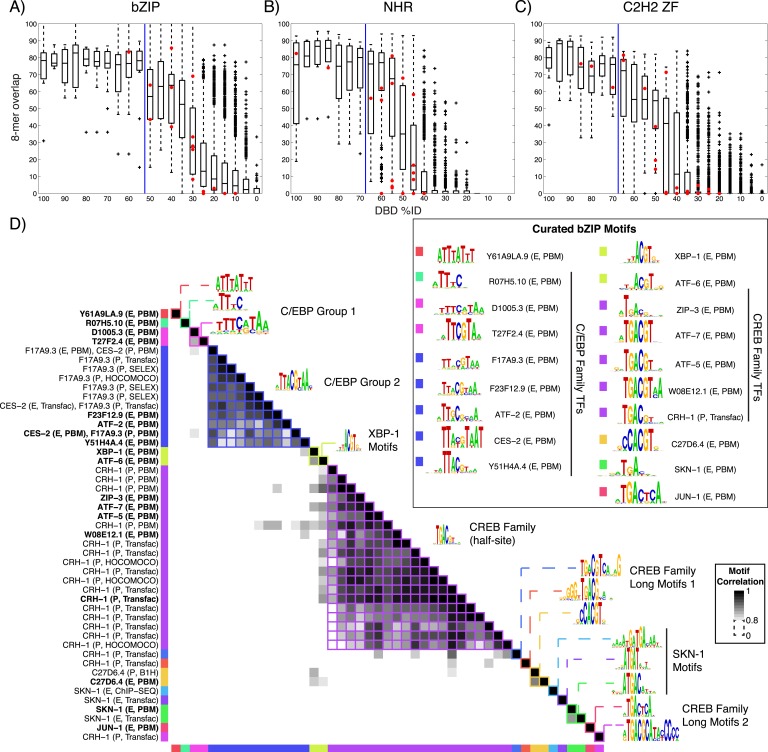
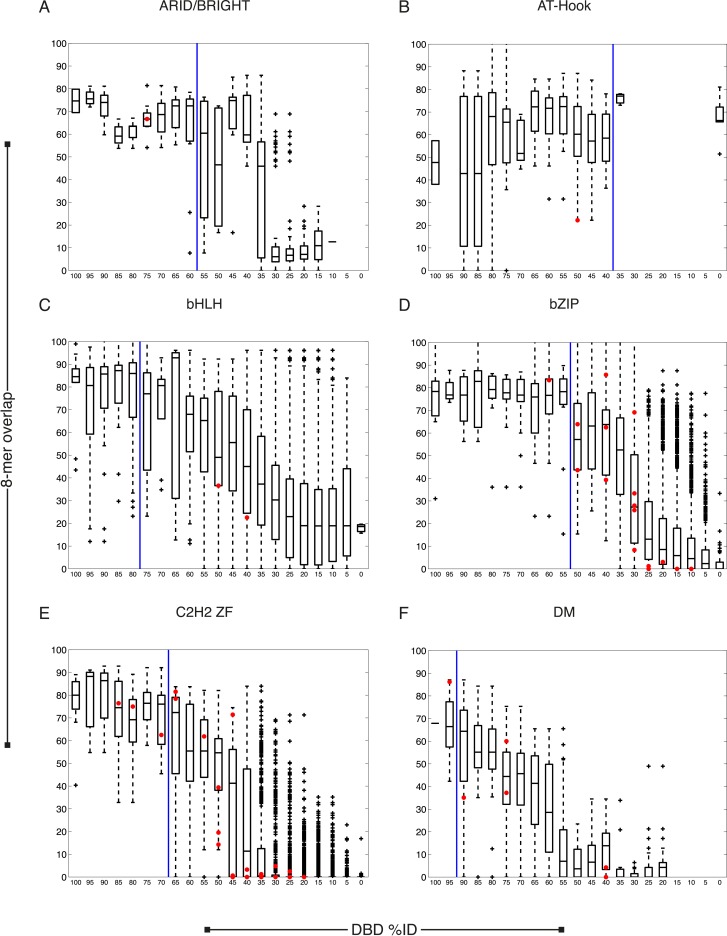
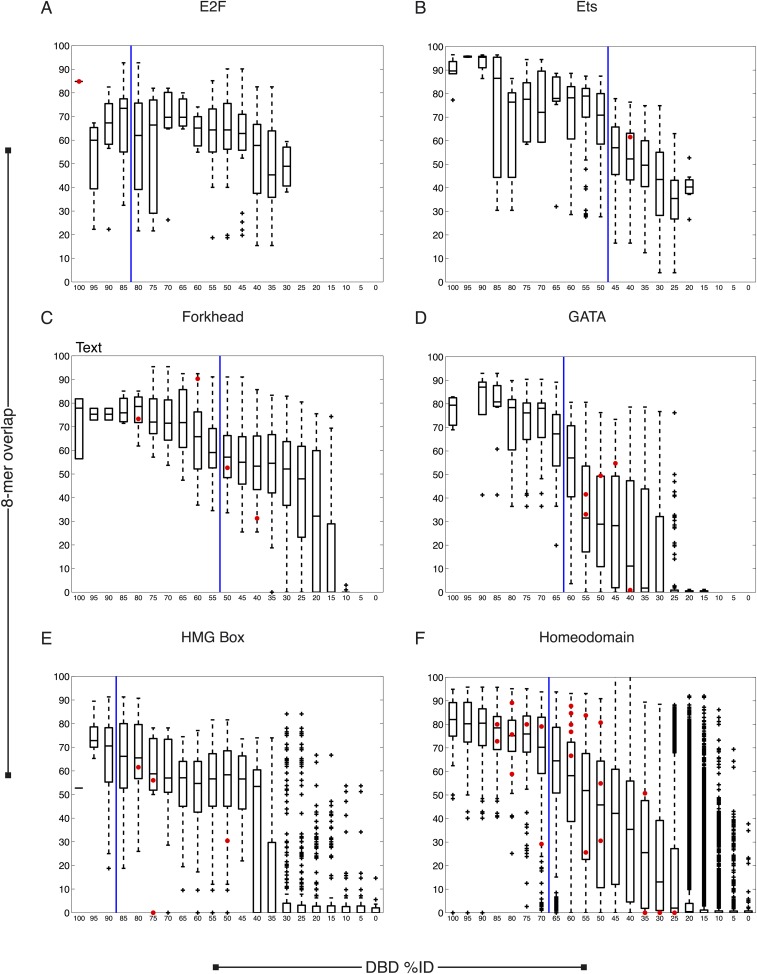
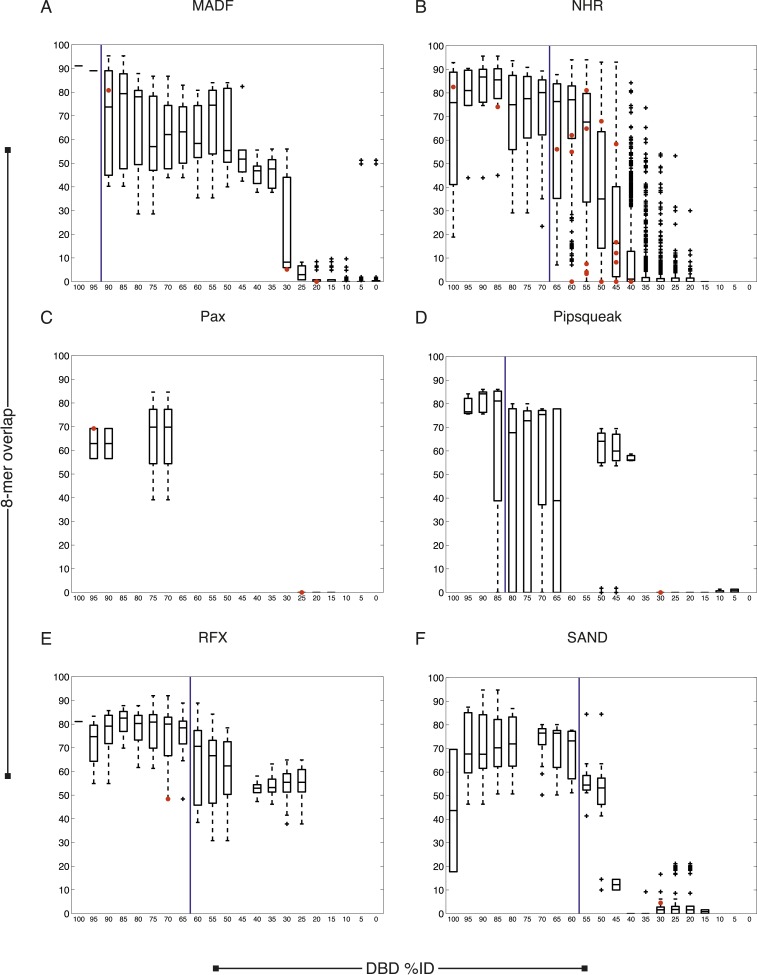
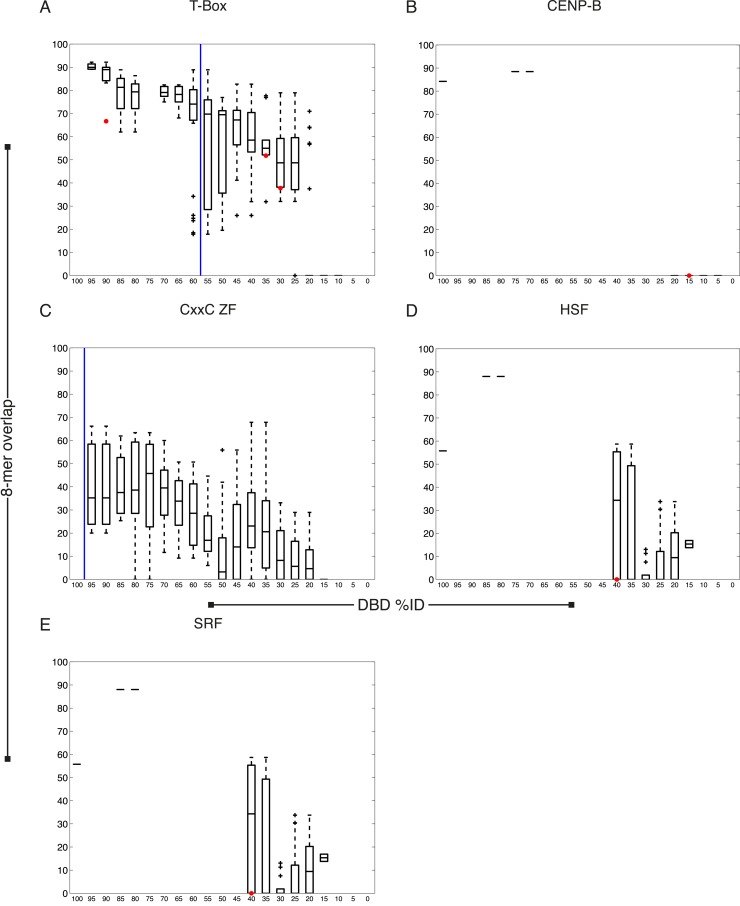
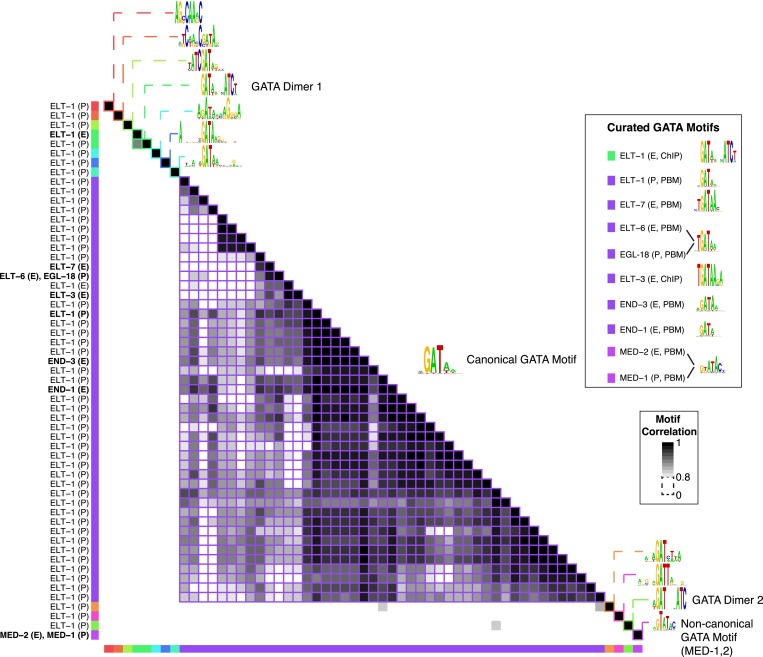
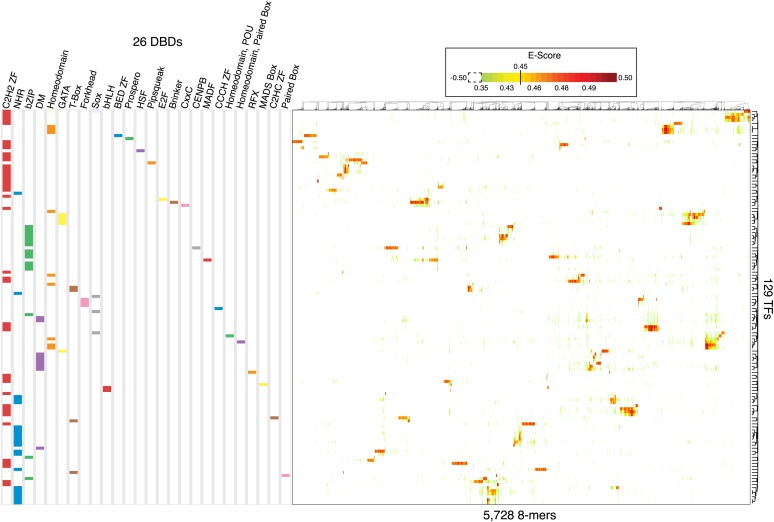
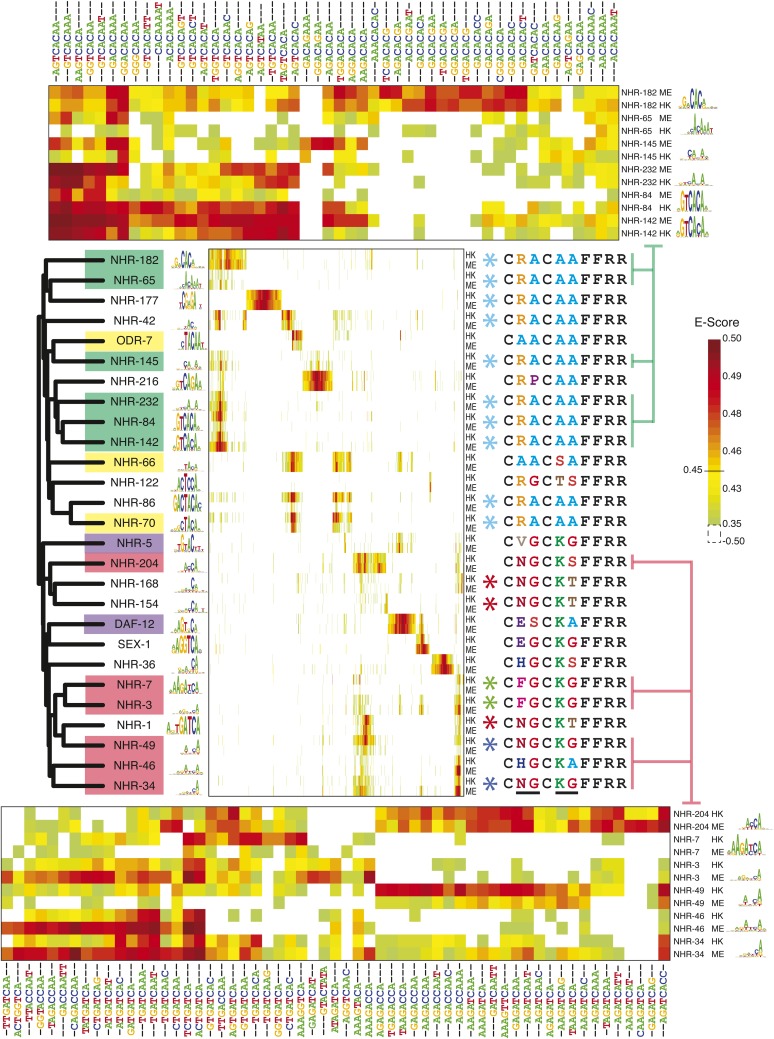
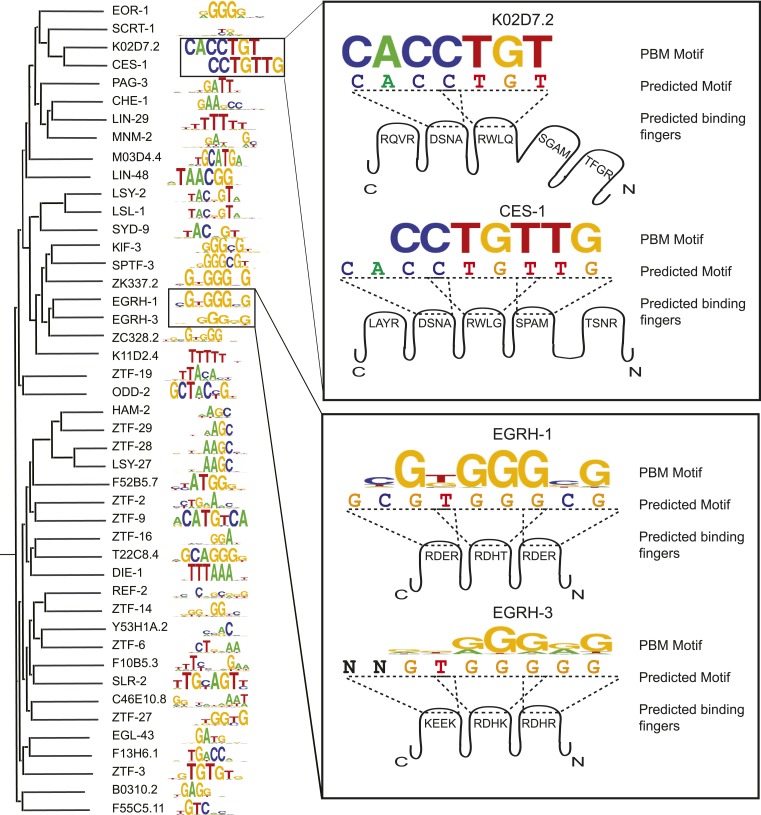
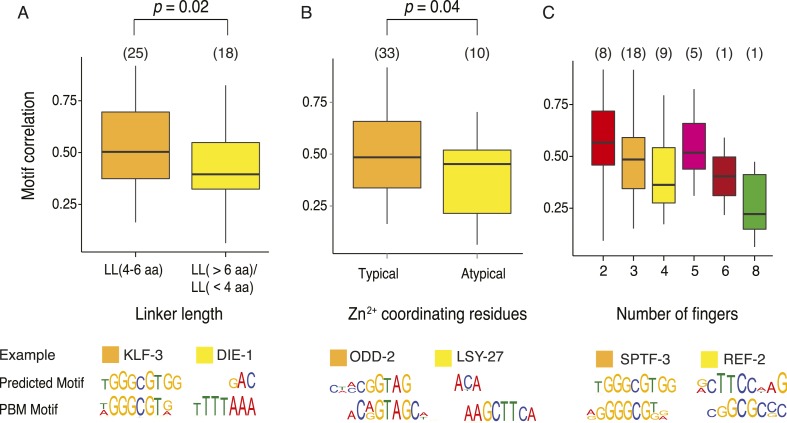
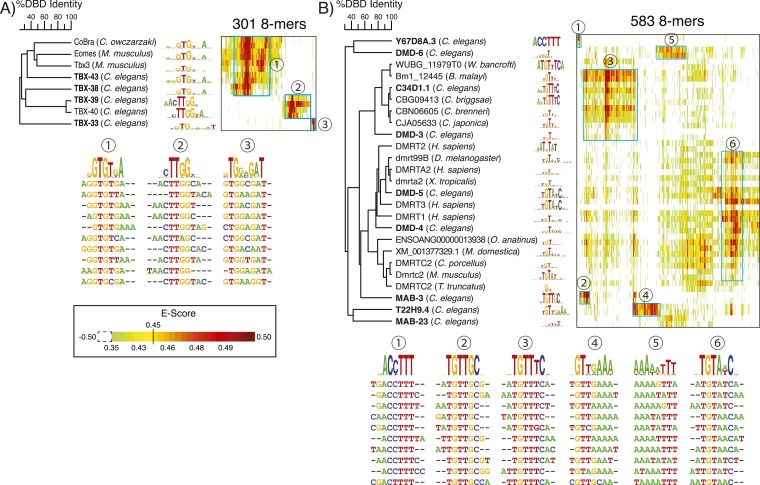
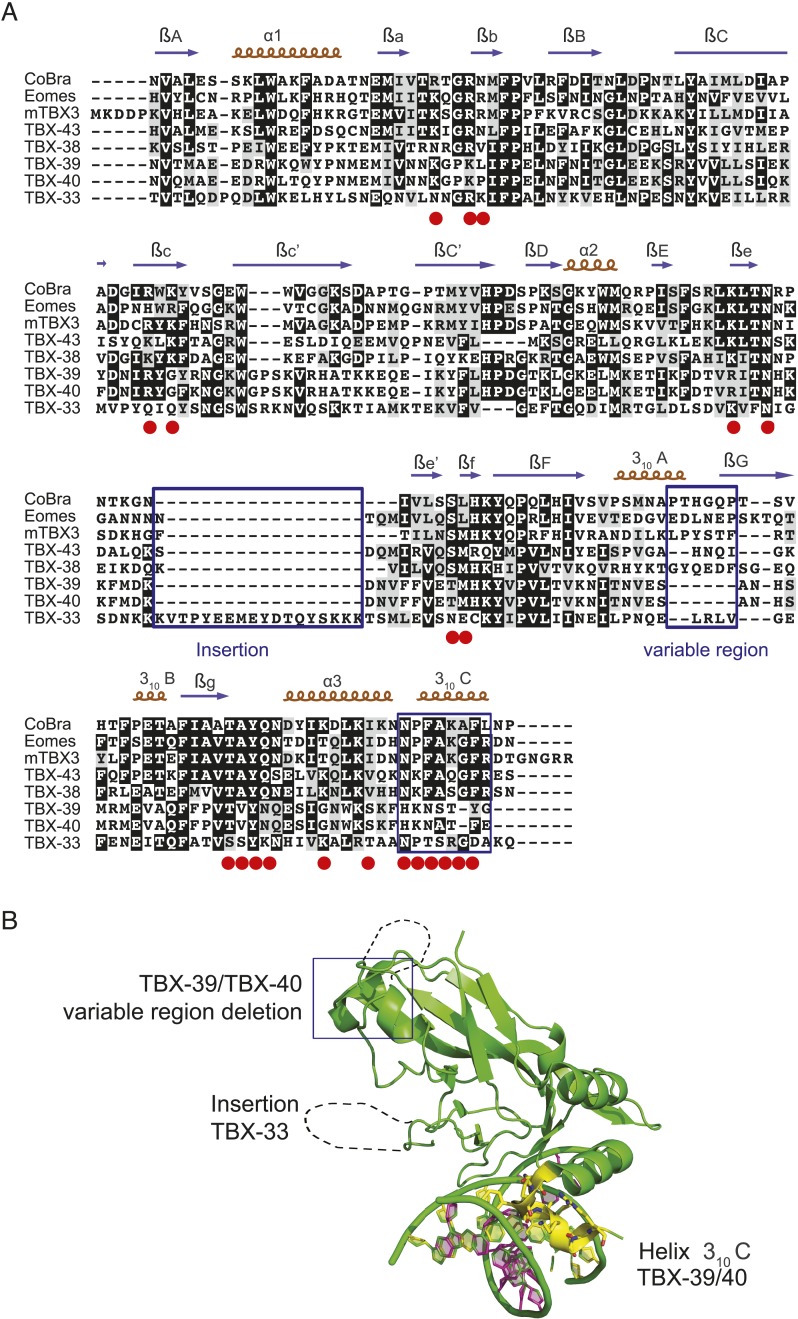
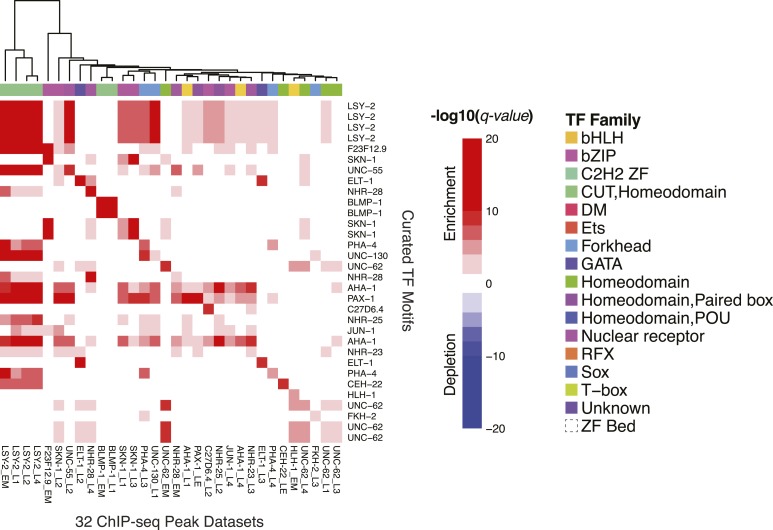
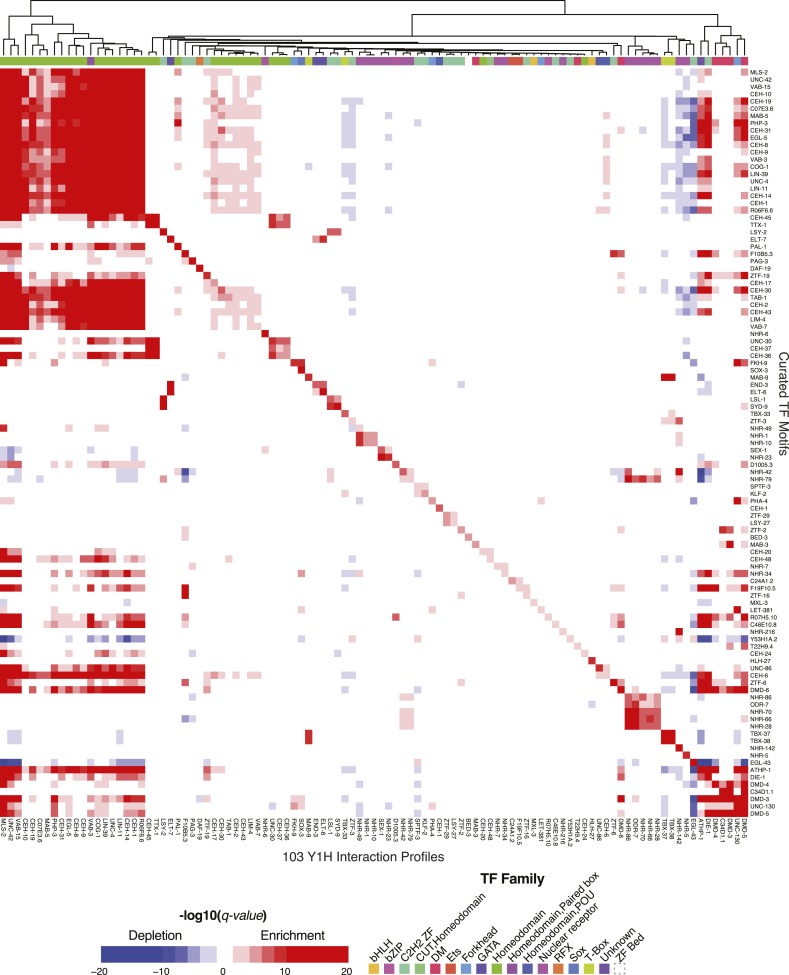
Caenorhabditis elegans is a powerful model for studying gene regulation, as it has a compact genome and a wealth of genomic tools. However, identification of regulatory elements has been limited, as DNA-binding motifs are known for only 71 of the estimated 763 sequence-specific transcription factors (TFs). To address this problem, we performed protein binding microarray experiments on representatives of canonical TF families in C. elegans, obtaining motifs for 129 TFs. Additionally, we predict motifs for many TFs that have DNA-binding domains similar to those already characterized, increasing coverage of binding specificities to 292 C. elegans TFs (∼40%). These data highlight the diversification of binding motifs for the nuclear hormone receptor and C2H2 zinc finger families and reveal unexpected diversity of motifs for T-box and DM families. Motif enrichment in promoters of functionally related genes is consistent with known biology and also identifies putative regulatory roles for unstudied TFs.

Keywords: C. elegans; DM; T-box; binding specificities; computational biology; evolutionary biology; genomics; nuclear hormone receptors; protein-binding microarray; systems biology; transcription factors.


Conflict of interest statement

The authors declare that no competing interests exist.

Figures

Figure 1.
Figure 1.. Motif status by DBD class.
Stacked bar plot depicting the number of unique C. elegans Transcription factors (TFs) for which a motif has been derived using PBM (this study), previous literature (including PBMs), or by homology-based prediction rules (see main text). The y-axis is displayed on a log2 scale for values greater than zero. See Figure 1—source data 1 for DNA-binding domain (DBD) abbreviations. Correspondence between motifs identified in current study and previously reported motifs is shown in Figure 1—figure supplement 1. DOI: http://dx.doi.org/10.7554/eLife.06967.003
Figure 1—figure supplement 1.
Figure 1—figure supplement 1.. Correspondence between TF motifs identified from our PBM study and previously reported motifs from several types of experimental data.
DOI: http://dx.doi.org/10.7554/eLife.06967.005
Figure 2.
Figure 2.. Motif prediction, motif clustering, and identification of representative motifs.
(AC) Boxplots depict the relationship between the %ID of aligned AAs and % of shared 8-mer DNA sequences with E-scores exceeding 0.45, for the three DBD classes, as indicated. %ID bins range from 0 to 100, of size 10, in increments of five. Red dots indicate individual TFs in this study, vs the next closest TF with PBM data. Vertical lines indicate AA %ID threshold above which motifs can be predicted using homology, taken from (Weirauch et al., 2014). Boxplots for all other DBDs in current study are shown in Figure 2—figure supplements 1–4. (D) Clustering analysis of motifs of bZIP domains using position-weight matrices (PWM)clus (Jiang and Singh, 2014). Colored gridlines indicate clusters. Cluster centroids are shown along the diagonal; expert curated motifs are shown within the box at right. ‘E’ indicates experimentally determined motifs; ‘P’ indicates predicted motifs. Source of motif is also indicated. Results of motif curation for GATA family TFs is displayed in Figure 2—figure supplement 5. DOI: http://dx.doi.org/10.7554/eLife.06967.006
Figure 2—figure supplement 1.
Figure 2—figure supplement 1.. C. elegans TFs adhere to established thresholds for motif inference.
(AF) Boxplots depict the relationship between the %ID of aligned AAs and % of shared 8-mer DNA sequences with E-scores exceeding 0.45, for the DBD classes of TFs with PBMs from this study. %ID bins range from 0 to 100, of size 10, in increments of five. Red dots indicate individual proteins in this study, vs the next closest protein with PBM data. Vertical blue lines indicate AA %ID threshold above which motifs can be predicted using homology. DOI: http://dx.doi.org/10.7554/eLife.06967.007
Figure 2—figure supplement 2.
Figure 2—figure supplement 2.. C. elegans TFs adhere to established thresholds for motif inference (continued).
(AF) Boxplots depict the relationship between the %ID of aligned AAs and % of shared 8-mer DNA sequences with E-scores exceeding 0.45, for the DBD classes of TFs with PBMs from this study. %ID bins range from 0 to 100, of size 10, in increments of five. Red dots indicate individual proteins in this study, vs the next closest protein with PBM data. Vertical blue lines indicate AA %ID threshold above which motifs can be predicted using homology. DOI: http://dx.doi.org/10.7554/eLife.06967.008
Figure 2—figure supplement 3.
Figure 2—figure supplement 3.. C. elegans TFs adhere to established thresholds for motif inference (continued).
(AF) Boxplots depict the relationship between the %ID of aligned AAs and % of shared 8-mer DNA sequences with E-scores exceeding 0.45, for the DBD classes of TFs with PBMs from this study. %ID bins range from 0 to 100, of size 10, in increments of five. Red dots indicate individual proteins in this study, vs the next closest protein with PBM data. Vertical blue lines indicate AA %ID threshold above which motifs can be predicted using homology. DOI: http://dx.doi.org/10.7554/eLife.06967.009
Figure 2—figure supplement 4.
Figure 2—figure supplement 4.. C. elegans TFs adhere to established thresholds for motif inference (continued).
(AE) Boxplots depict the relationship between the %ID of aligned AAs and % of shared 8-mer DNA sequences with E-scores exceeding 0.45, for the DBD classes of TFs with PBMs from this study. %ID bins range from 0 to 100, of size 10, in increments of five. Red dots indicate individual proteins in this study, vs the next closest protein with PBM data. Vertical blue lines indicate AA %ID threshold above which motifs can be predicted using homology. DOI: http://dx.doi.org/10.7554/eLife.06967.010
Figure 2—figure supplement 5.
Figure 2—figure supplement 5.. GATA TF motif clustering and identification of representative motifs.
Clustering analysis of C. elegans GATA TF's motifs using PWMclus (Jiang and Singh 2014). Colored gridlines indicate clusters. Cluster centroids are shown along the diagonal, while manually curated motifs are shown within the box at right. Bolded row names represent motifs obtained from this study. DOI: http://dx.doi.org/10.7554/eLife.06967.011
Figure 3.
Figure 3.. Overview of 8-mer sequences preferences for the 129 C. elegans TFs analyzed by PBM in this study.
2-D Hierarchical agglomerative clustering analysis of E-scores performed on all 5728 8-mers bound by at least one TF (average E > 0.45 between ME and HK replicate PBMs). Colored boxes represent DBD classes for each TF. Average E-score data is available in Figure 3—source data 1. DOI: http://dx.doi.org/10.7554/eLife.06967.012
Figure 4.
Figure 4.. 8-mer binding profiles of NHR family reveal distinct sequence preferences.
Left, ClustalW phylogram of nuclear hormone receptor (NHR) DBD amino acid sequences with corresponding motifs. TF labels are shaded according to motif similarity groups identified by PWMclus. Center, heatmap showing E-scores. NHRs are ordered according to the phylogram at left. The 1406 8-mers with E-score > 0.45 for at least one family member on at least one PBM array were ordered using hierarchical agglomerative clustering. Each TF has one row for each of two-replicate PBM experiments (ME or HK array designs). Right; recognition helix (RH) sequences for the corresponding proteins, with identical RH sequence types highlighted by colored asterisks. Variant RH residues are underlined at bottom. Right, matrix indicates cluster membership according to PWMclus. Top and bottom, pullouts show re-clustered data including only the union of the top ten most highly scoring 8-mers (taking the average E-score from the ME and HK arrays) for each of the selected proteins. E-scores for k-mers in all three heatmaps are available in Figure 4—source data 1. DOI: http://dx.doi.org/10.7554/eLife.06967.014
Figure 5.
Figure 5.. C2H2 motifs relate to DBD similarity and to the recognition code.
Left, ClustalW phylogram of C2H2 zinc finger (ZF) amino acid sequences with corresponding motifs. Right, examples in which motifs predicted by the ZF recognition code are compared to changes in DNA sequences preferred by paralogous C2H2 ZF TFs. Cartoon shows individual C2H2 ZFs and their specificity residues. Dashed lines correspond to 4-base subsites predicted from the recognition code. DOI: http://dx.doi.org/10.7554/eLife.06967.016
Figure 5—figure supplement 1.
Figure 5—figure supplement 1.. Comparison of C2H2 ZF recognition model with motifs derived PBM.
Motif correlations between PBM derived motifs and ZF-model based predictions for TFs with both typical and atypical (A) linker lengths between ZF modules that are longer than 6 amino acids or shorter than 4 amino acids (B) zinc coordinating cysteine or histidine structural motifs and (C) differing length of the ZF array. Examples of recognition code predictions (sequence logos) for both typical and atypical TFs are compared with PBM motifs for each case. The p-values shown are estimated from Student's t-test. The number of TFs in each boxplot is shown above in parentheses. DOI: http://dx.doi.org/10.7554/eLife.06967.017
Figure 6.
Figure 6.. Nematode-specific sequence preferences in T-box and DM TFs.
PBM data heatmaps of preferred 8-mers for T-box (A), and DM (B) TFs. TFs are clustered using ClustalW; 8-mers were selected (at least one instance of E > 0.45) and clustered using hierarchical agglomerative clustering, as in Figures 4, 5. Ten representative 8-mers (those with highest E-scores) are shown below for each of the clusters indicated in cyan. C. elegans TFs with data from this study are bolded. E-score data for T-box and DM TFs available in Figure 6—source data 1. DOI: http://dx.doi.org/10.7554/eLife.06967.018
Figure 6—figure supplement 1.
Figure 6—figure supplement 1.. T-box sequence alignments and the crystal structure of mTBX3 illustrate C. elegans specific variations.
(A) Multiple-sequence alignment of T-box DBDs from C. elegans, the protist C. owczarzaki CoBra and mouse Eomes, and TBX3. Key DNA-binding residues identified from crystal structure of mTBX3 are highlighted in red. Sequence insertions (for TBX-33), changes in the variable region (for TBX-39/40), and significant sequence changes in the key 310C RH (for TBX- 39/40) are highlighted in blue frames. (B) Crystal structure model of mTBX3 is used as a prototype to illustrate C. elegans specific sequence variations. The primary recognition helix, 310C, is highlighted in yellow. DOI: http://dx.doi.org/10.7554/eLife.06967.020
Figure 7.
Figure 7.. The C. elegans curated motif collection explains ChIP-seq and Y1H TF binding data.
Heatmap of CentriMo −log10 (q-values) for central enrichment of TF motifs in the top 250 peaks for each ChIP experiment. Motif enrichment in Y1H data is presented in Figure 7—figure supplement 1. Both ChIP-seq and Y1H heatmaps use a common colour and annotation scale. Heatmaps are symmetric with duplicate rows to ensure the diagonal represents TF-motif enrichment in it's matching data set(s). Red and blue coloring depicts statistically significant enrichments and depletions (q ≤ 0.05). DOI: http://dx.doi.org/10.7554/eLife.06967.021
Figure 7—figure supplement 1.
Figure 7—figure supplement 1.. The C. elegans curated motif collection explains Y1H TF binding data.
Heatmap depicting enrichment or depletion (Mann–Whitney U test) of TF motifs in the interactions of TF's with a collection of promoter bait sequences in Y1H experiments compared to all non-interacting bait sequences. DOI: http://dx.doi.org/10.7554/eLife.06967.022
Figure 8.
Figure 8.. Composite motifs enriched in C. elegans ChIP-seq peaks.
(A) Stereospecificity plots showing enriched CM configurations for pairs of TF motifs. The identical ‘1F2F’ and ‘2F1F’ results in A (top row) demonstrate homodimer and homotrimer CMs, while those involving LSY-2, NHR-232, and R07H5.10 demonstrate heterodimer and heterotrimer CMs (middle and bottom rows, respectively). Black arrows represent orientation of the motif within CMs, while gray dashed arrows designate shadow motifs within trimeric CMs. Error bars are ± S.D., *corrected p < 0.05. (B) Forest plot of odds ratios for TF family enrichment in CMs vs input TF list. (C) Venn diagram showing overlap of significant CMs identified by null model 1 (dinucleotide shuffled sequence) and null model 2 (motif shuffling). (D) Number of significant CMs identified relative to dinucleotide scrambled sequences using shuffled and non-shuffled non-ChIPed motifs, as a function of motif pair distance. DOI: http://dx.doi.org/10.7554/eLife.06967.023
Figure 8—figure supplement 1.
Figure 8—figure supplement 1.. Summary of clustered CMs enriched in C. elegans ChIP-seq peaks.
CM-cluster centroids are shown for the enriched motifs. For each cluster, the ChIPed TF(s) and potential partner TF(s) are listed along with information about motif overlap (OLAP), spacing (GAP), and enrichment. Colored arrows over motif indicate high-information content portions of either factor. DOI: http://dx.doi.org/10.7554/eLife.06967.025
Figure 8—figure supplement 2.
Figure 8—figure supplement 2.. Summary of clustered CMs enriched in C. elegans ChIP-seq peaks (continued).
CM-cluster centroids are shown for the enriched motifs. For each cluster, the ChIPed TF(s) and potential partner TF(s) are listed along with information about motif overlap (OLAP), spacing (GAP), and enrichment. Colored arrows over motif indicate high-information content portions of either factor. DOI: http://dx.doi.org/10.7554/eLife.06967.026
Figure 8—figure supplement 3.
Figure 8—figure supplement 3.. Summary of clustered CMs enriched in C. elegans ChIP-seq peaks (continued).
CM-cluster centroids are shown for the enriched motifs. For each cluster, the ChIPed TF(s) and potential partner TF(s) are listed along with information about motif overlap (OLAP), spacing (GAP), and enrichment. Colored arrows over motif indicate high-information content portions of either factor. DOI: http://dx.doi.org/10.7554/eLife.06967.027
Figure 8—figure supplement 4.
Figure 8—figure supplement 4.. Summary of clustered CMs enriched in C. elegans ChIP-seq peaks (continued).
CM-cluster centroids are shown for the enriched motifs. For each cluster, the ChIPed TF(s) and potential partner TF(s) are listed along with information about motif overlap (OLAP), spacing (GAP), and enrichment. Colored arrows over motif indicate high-information content portions of either factor. DOI: http://dx.doi.org/10.7554/eLife.06967.028
Figure 8—figure supplement 5.
Figure 8—figure supplement 5.. Summary of clustered CMs enriched in C. elegans ChIP-seq peaks (continued).
CM-cluster centroids are shown for the enriched motifs. For each cluster, the ChIPed TF(s) and potential partner TF(s) are listed along with information about motif overlap (OLAP), spacing (GAP), and enrichment. Colored arrows over motif indicate high-information content portions of either factor. DOI: http://dx.doi.org/10.7554/eLife.06967.029
Figure 9.
Figure 9.. Enrichment of motifs upstream of gene sets.
Each row of the heatmap represents a motif from our curated collection that is enriched (q < 0.05) in at least one gene set category. Known regulatory interactions between TFs and gene sets are highlighted (black outlines). ‘E’ indicates experimentally determined motifs; ‘P’ indicates predicted motifs. Source of motif is also indicated. Enrichment q-values are available in Figure 9—source data 1. DOI: http://dx.doi.org/10.7554/eLife.06967.030

References

    1. Ao W, Gaudet J, Kent WJ, Muttumu S, Mango SE. Environmentally induced foregut remodeling by PHA-4/FoxA and DAF-12/NHR. Science. 2004;305:1743–1746. doi: 10.1126/science.1102216. - DOI - PubMed
    1. Araya CL, Kawli T, Kundaje A, Jiang L, Wu B, Vafeados D, Terrell R, Weissdepp P, Gevirtzman L, Mace D. Niu W, Boyle AP, Xie D, Ma L, Murray JI, Reinke V, Waterston RH, Snyder M. Regulatory analysis of the C. elegans genome with spatiotemporal resolution. Nature. 2014;512:400–405. doi: 10.1038/nature13497. - DOI - PMC - PubMed
    1. Arda HE, Taubert S, MacNeil LT, Conine CC, Tsuda B, Van Gilst M, Sequerra R, Doucette-Stamm L, Yamamoto KR, Walhout AJ. Functional modularity of nuclear hormone receptors in a Caenorhabditis elegans metabolic gene regulatory network. Molecular Systems Biology. 2010;6:367. doi: 10.1038/msb.2010.23. - DOI - PMC - PubMed
    1. Ashburner M, Ball CA, Blake JA, Botstein D, Butler H, Cherry JM, Davis AP, Dolinski K, Dwight SS, Eppig JT, Harris MA, Hill DP, Issel-Tarver L, Kasarskis A, Lewis S, Matese JC, Richardson JE, Ringwald M, Rubin GM, Sherlock G. Gene ontology: tool for the unification of biology. The Gene Ontology Consortium. Nature Genetics. 2000;25:25–29. doi: 10.1038/75556. - DOI - PMC - PubMed
    1. Badis G, Berger MF, Philippakis AA, Talukder S, Gehrke AR, Jaeger SA, Chan ET, Metzler G, Vedenko A, Chen X, Kuznetsov H, Wang CF, Coburn D, Newburger DE, Morris Q, Hughes TR, Bulyk ML. Diversity and complexity in DNA recognition by transcription factors. Science. 2009;324:1720–1723. doi: 10.1126/science.1162327. - DOI - PMC - PubMed

Publication types

MeSH terms

Substances