

Improvements in the distribution of hospital performance for the care of patients with acute myocardial infarction, heart failure, and pneumonia, 2006-2011
- PMID: 25906012
- PMCID: PMC8635168
- DOI: 10.1097/MLR.0000000000000358
Improvements in the distribution of hospital performance for the care of patients with acute myocardial infarction, heart failure, and pneumonia, 2006-2011
Abstract
Background: Medicare hospital core process measures have improved over time, but little is known about how the distribution of performance across hospitals has changed, particularly among the lowest performing hospitals.
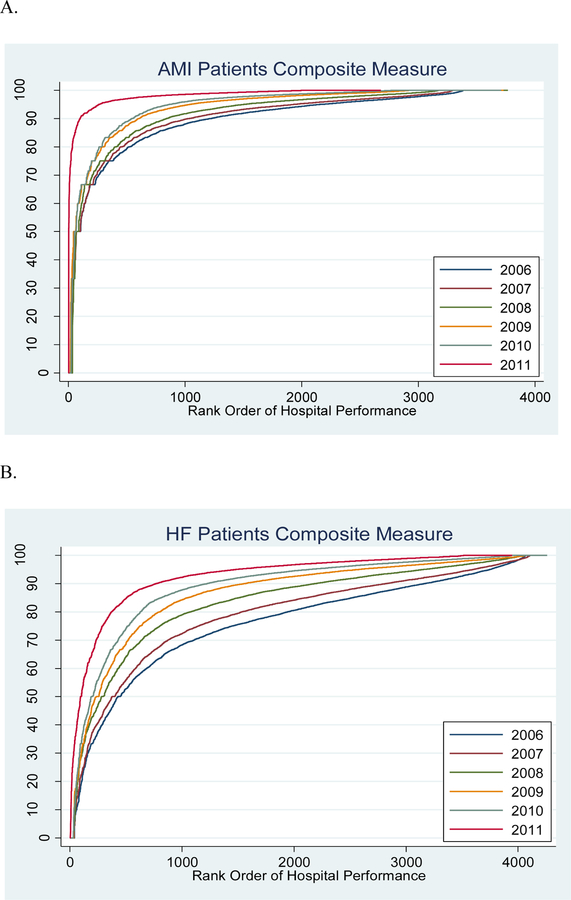
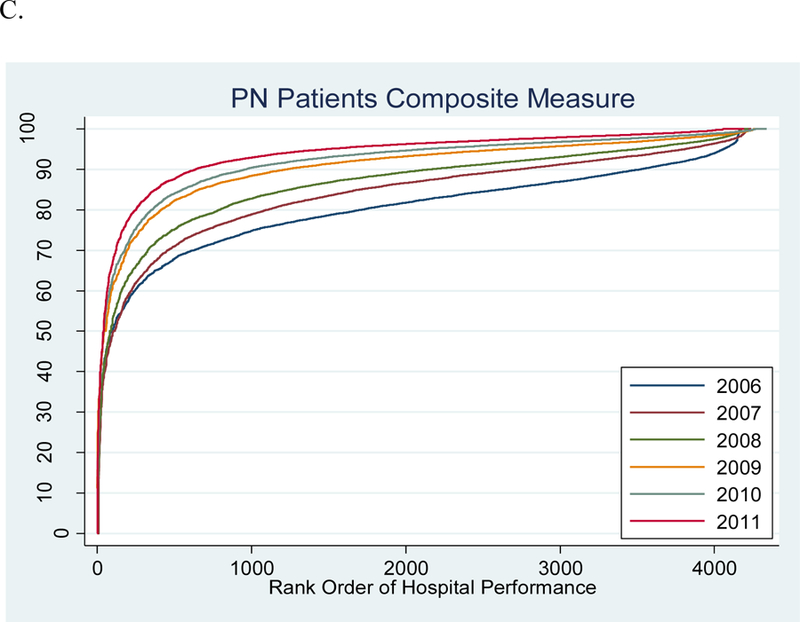
Methods: We studied all US hospitals reporting performance measure data on process measures for acute myocardial infarction (AMI), heart failure (HF), and pneumonia (PN) to the Centers for Medicare & Medicaid Services from 2006 to 2011. We assessed changes in performance across hospital ranks, variability in the distribution of performance rates, and linear trends in the 10th percentile (lowest) of performance over time for both individual measures and a created composite measure for each condition.
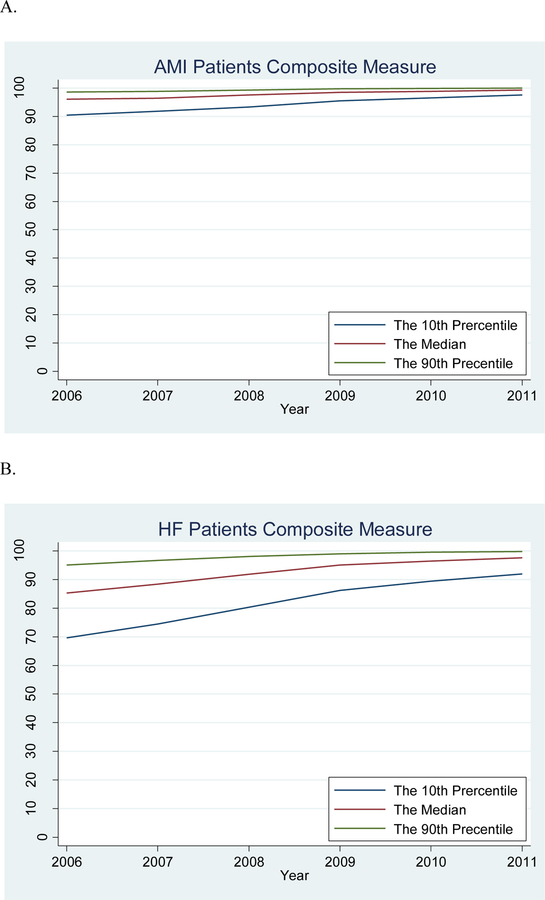
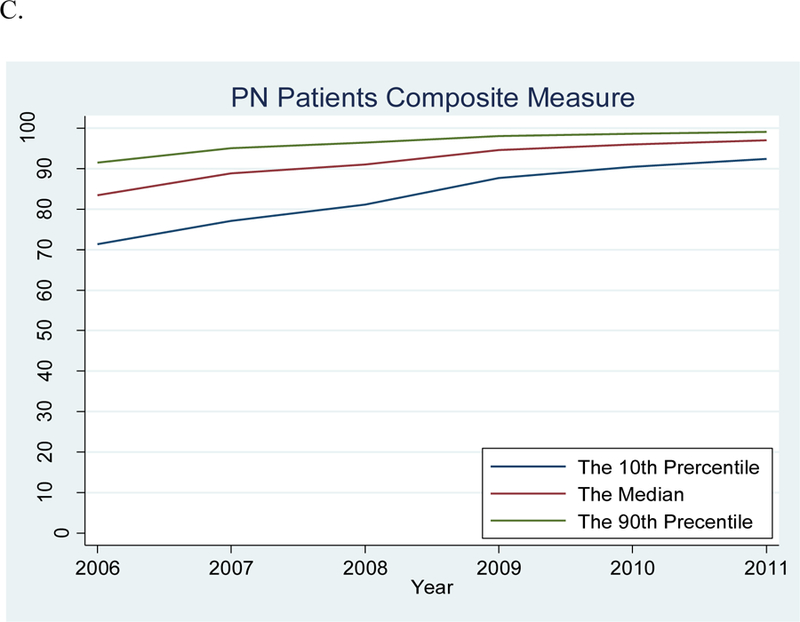
Results: More than 4000 hospitals submitted measure data each year. There were marked improvements in hospital performance measures (median performance for composite measures: AMI: 96%-99%, HF: 85%-98%, PN: 83%-97%). A greater number of hospitals reached the 100% performance level over time for all individual and composite measures. For the composite measures, the 10th percentile significantly improved (AMI: 90%-98%, P<0.0001 for trend; HF: 70%-92%, P=0.0002; PN: 71%-92%, P=0.0003); the variation (90th percentile rate minus 10th percentile rate) decreased from 9% in 2006 to 2% in 2011 for AMI, 25%-8% for HF, and 20%-7% for PN.
Conclusions: From 2006 to 2011, not only did the median performance improve but the distribution of performance narrowed. Focus needs to shift away from processes measures to new measures of quality.
Conflict of interest statement
Conflicts of Interest
The other authors report no potential conflicts of interest.
Figures
References
-
- Jha AK, Li Z, Orav EJ, Epstein AM. Care in U.S. hospitals--the Hospital Quality Alliance program. N Engl J Med 2005;353(3):265–274. - PubMed
-
- Jencks SF, Wilensky GR. The health care quality improvement initiative. A new approach to quality assurance in Medicare. JAMA 1992;268(7):900–903. - PubMed
-
- Hospital Inpatient Quality Reporting (IQR) Program Overview 2014; https://qualitynet.org/dcs/ContentServer?c=Page&pagename=QnetPublic%2FPa.... Accessed September 12, 2014.
-
- Act DR. of 2005. PL 109e71. 2005.
-
- Law P. Law 108–173. The Medicare Prescription Drug, Improvement, and Modernization Act of 2003 December 8, 2003. 2009.
Publication types
MeSH terms
Grants and funding
LinkOut - more resources
Full Text Sources
Medical
Research Materials
Miscellaneous
