

Patient and Hospitalization Characteristics Associated With Increased Postacute Care Facility Discharges From US Hospitals
- PMID: 25906015
- PMCID: PMC4431940
- DOI: 10.1097/MLR.0000000000000359
Patient and Hospitalization Characteristics Associated With Increased Postacute Care Facility Discharges From US Hospitals
Abstract
Background/objectives: The number of patients discharged to postacute care (PAC) facilities after hospitalization increased by 50% nationally between 1996 and 2010. We sought to describe payors and patients most affected by this trend and to identify diagnoses for which PAC facility care may be substituting for continued hospital care.
Design: Retrospective analysis of the National Hospital Discharge Survey from 1996 to 2010.
Setting: Adult discharges from a national sample of non-Federal hospitals.
Participants/exposures: Adults admitted and discharged to a PAC facility between 1996 and 2010. Our analysis includes 2.99 million sampled discharges, representative of 386 million discharges nationally.
Measurements: Patient demographic and hospitalization characteristics, including length of stay (LOS) and diagnoses treated.
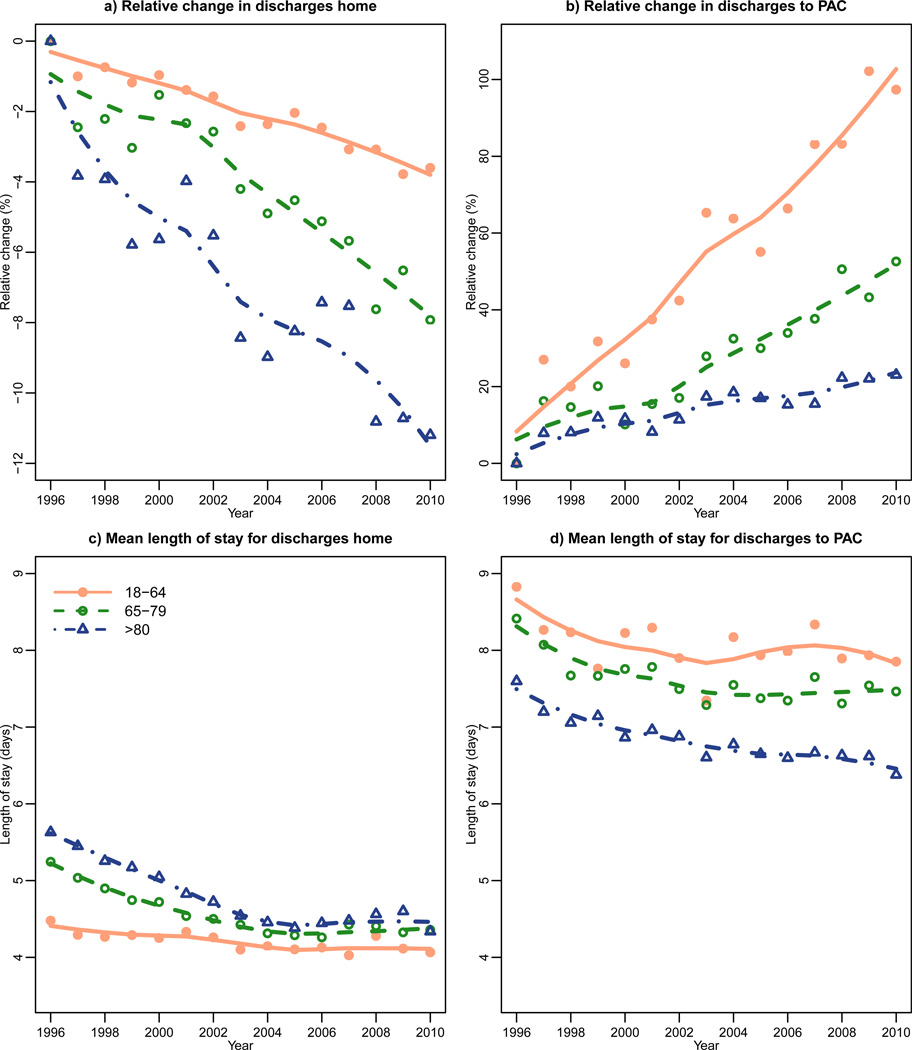
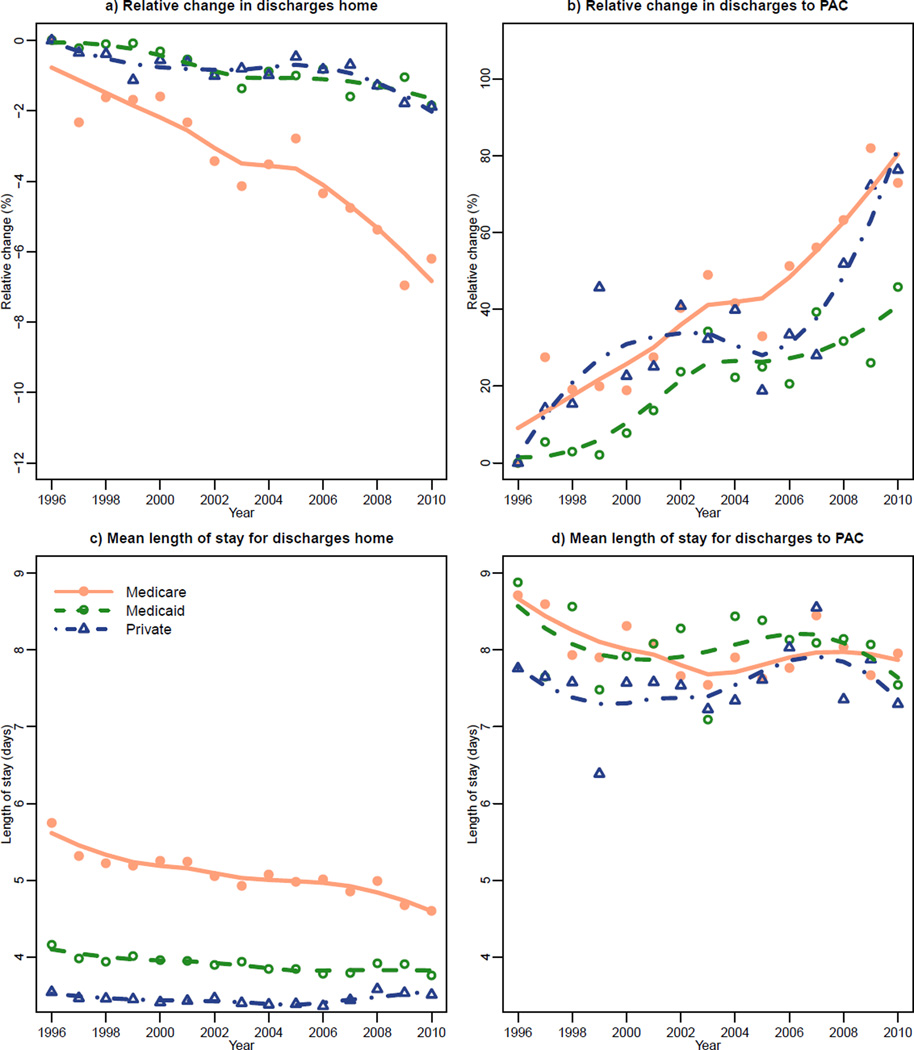
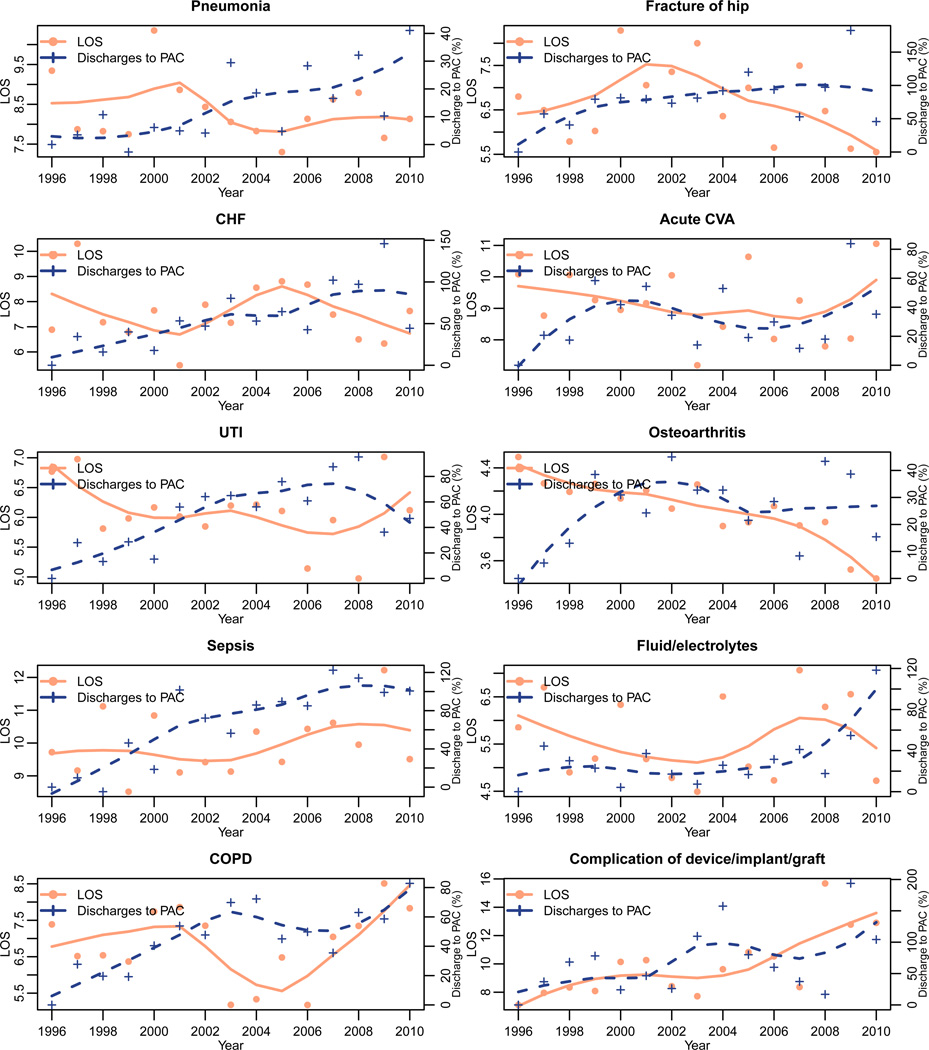
Results: More than half (50.7%) of all patients discharged to PAC facilities were 80 years old or older in 2010; 40% of hospitalizations in this age group ended with a PAC stay. Decreases in LOS and increases in PAC facility use were consistent across payors and patient demographics. PAC facilities may be substituting for continued inpatient care for patients with pneumonia, hip fracture, and sepsis as these diagnoses demonstrated the clearest trends of decreasing LOS and increasing discharges to PAC facilities.
Conclusions: The rise in discharges to PAC facilities is occurring in all age groups and payors, though the predominant population is the very old Medicare patient, for whom successful rehabilitation may be most unsure. PAC facility care may be increasingly substituted for prolonged hospitalizations for patients with pneumonia, hip fracture, and sepsis.
Figures
References
-
- Halm EA, Fine MJ, Kapoor WN, Singer DE, Marrie TJ, Siu AL. Instability on hospital discharge and the risk of adverse outcomes in patients with pneumonia. Arch Intern Med. 2002;162(11):1278–1284. - PubMed
-
- Halm EA, Magaziner J, Hannan EL, et al. Frequency and impact of active clinical issues and new impairments on hospital discharge in patients with hip fracture. Arch Intern Med. 2003;163(1):108–113. - PubMed
-
- Kosecoff J, Kahn KL, Rogers WH, et al. Prospective payment system and impairment at discharge. The “quicker-and-sicker” story revisited. JAMA. 1990;264(15):1980–1983. - PubMed
-
- Qian X, Russell LB, Valiyeva E, Miller JE. “Quicker and sicker” under Medicare’s prospective payment system for hospitals: new evidence on an old issue from a national longitudinal survey. Bull Econ Res. 2011;63(1):1–27. - PubMed
