. 2015 Apr 23;11(4):e1005165.
doi: 10.1371/journal.pgen.1005165. eCollection 2015 Apr.

The power of gene-based rare variant methods to detect disease-associated variation and test hypotheses about complex disease

Affiliations

The power of gene-based rare variant methods to detect disease-associated variation and test hypotheses about complex disease

Loukas Moutsianas et al. PLoS Genet. .

Abstract

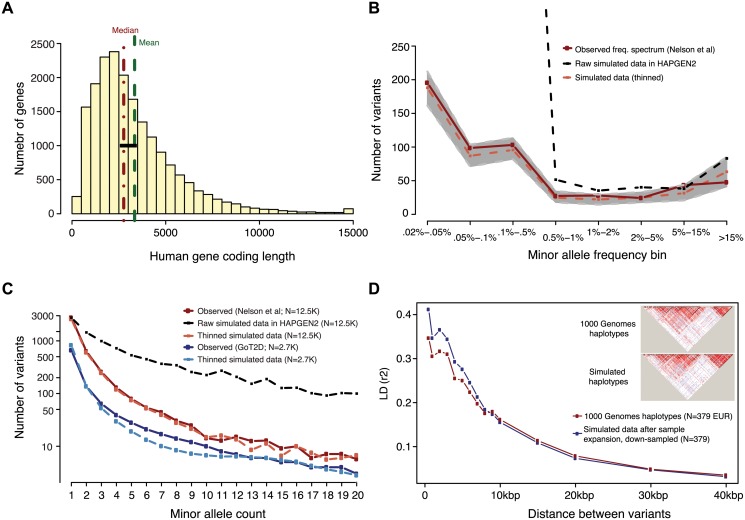
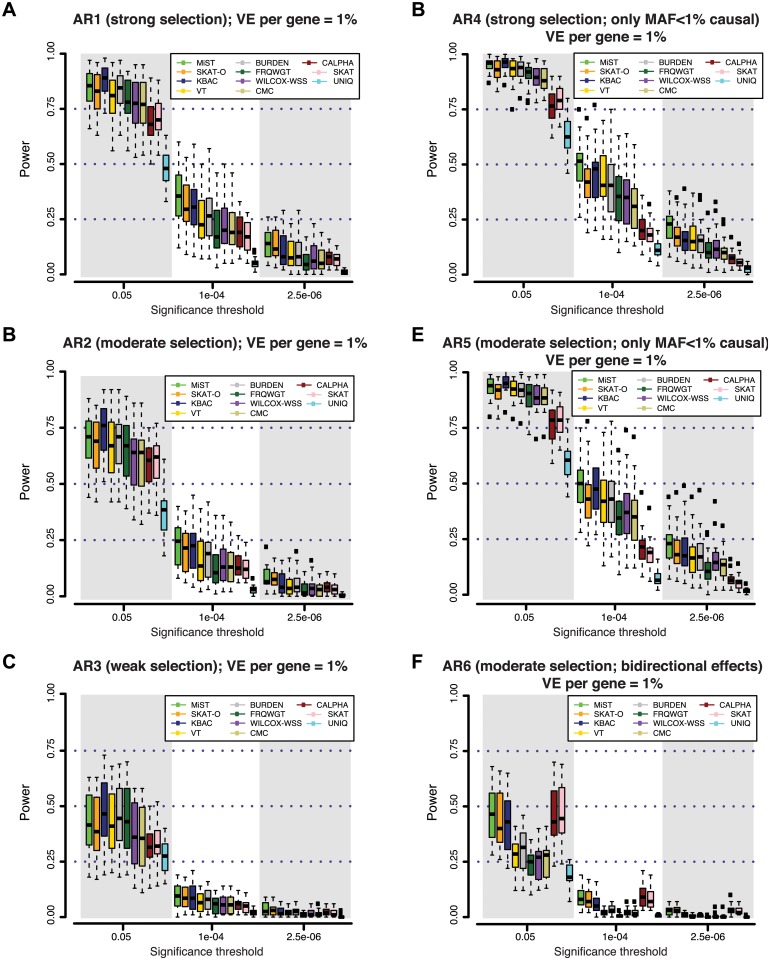
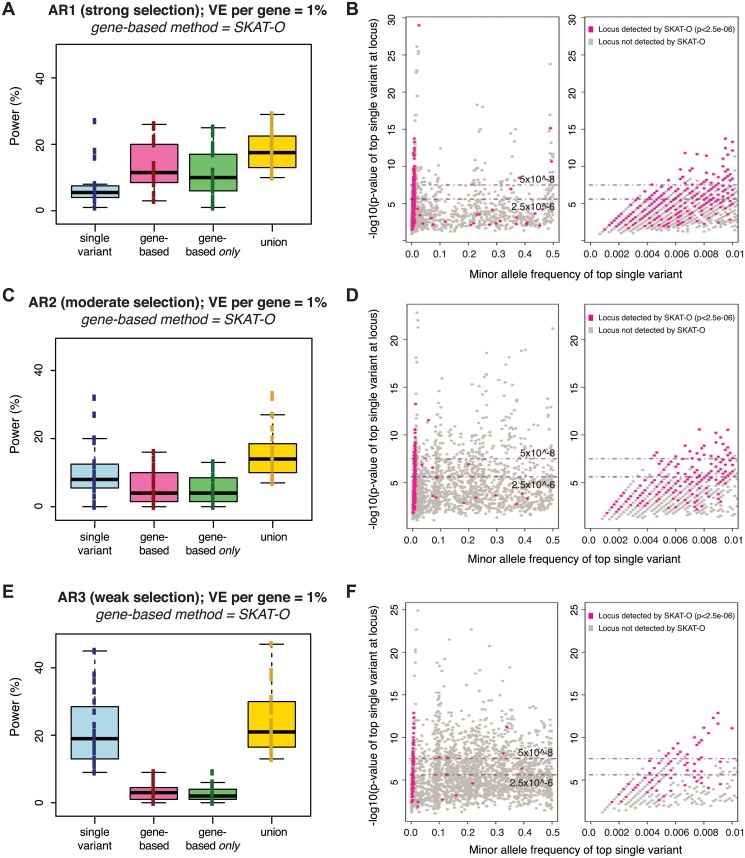
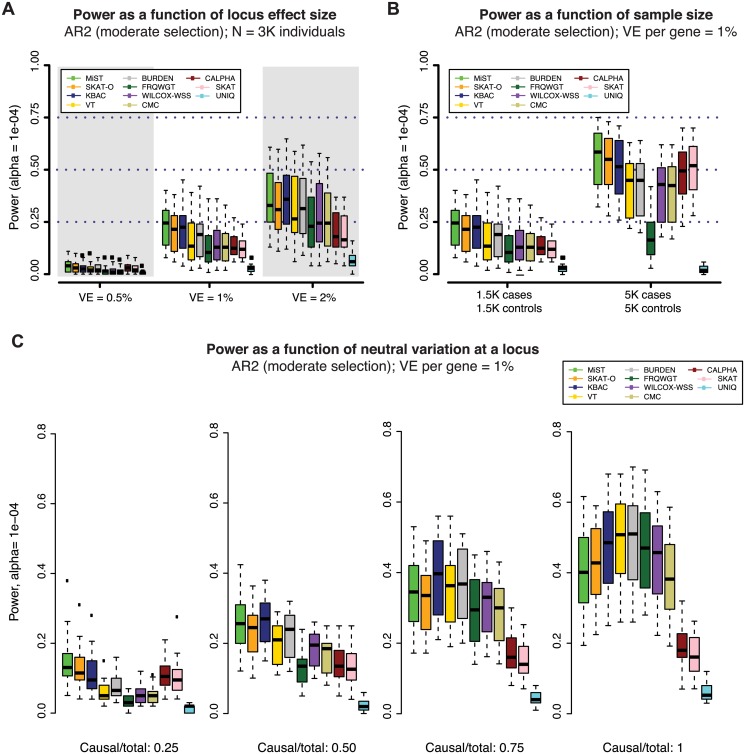
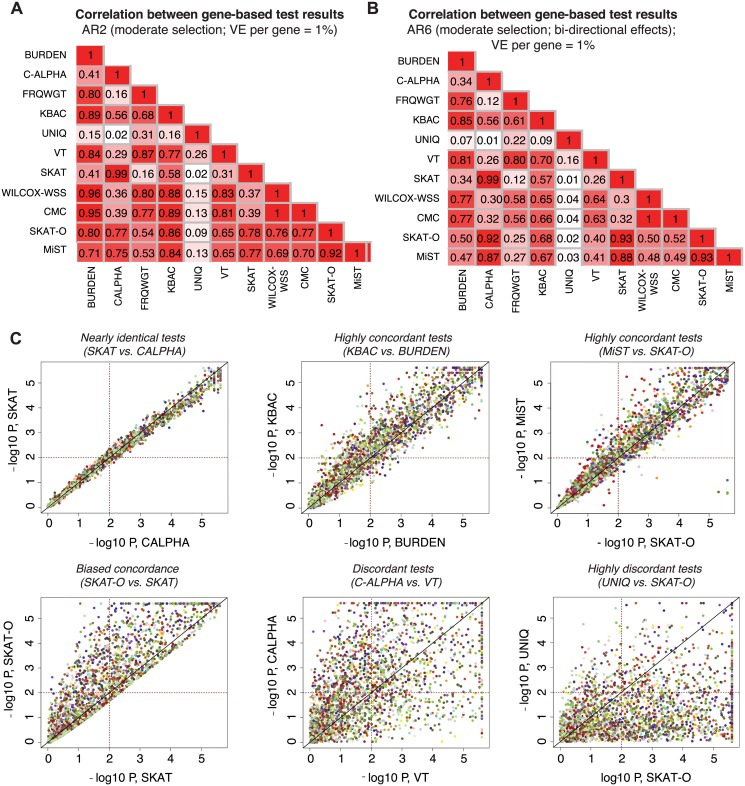
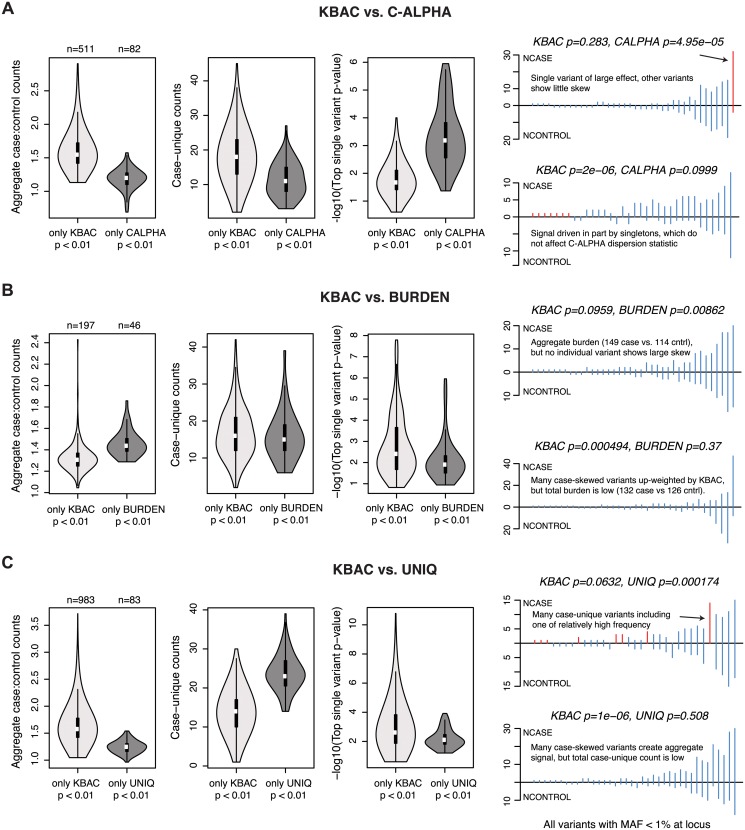
Genome and exome sequencing in large cohorts enables characterization of the role of rare variation in complex diseases. Success in this endeavor, however, requires investigators to test a diverse array of genetic hypotheses which differ in the number, frequency and effect sizes of underlying causal variants. In this study, we evaluated the power of gene-based association methods to interrogate such hypotheses, and examined the implications for study design. We developed a flexible simulation approach, using 1000 Genomes data, to (a) generate sequence variation at human genes in up to 10K case-control samples, and (b) quantify the statistical power of a panel of widely used gene-based association tests under a variety of allelic architectures, locus effect sizes, and significance thresholds. For loci explaining ~1% of phenotypic variance underlying a common dichotomous trait, we find that all methods have low absolute power to achieve exome-wide significance (~5-20% power at α = 2.5 × 10(-6)) in 3K individuals; even in 10K samples, power is modest (~60%). The combined application of multiple methods increases sensitivity, but does so at the expense of a higher false positive rate. MiST, SKAT-O, and KBAC have the highest individual mean power across simulated datasets, but we observe wide architecture-dependent variability in the individual loci detected by each test, suggesting that inferences about disease architecture from analysis of sequencing studies can differ depending on which methods are used. Our results imply that tens of thousands of individuals, extensive functional annotation, or highly targeted hypothesis testing will be required to confidently detect or exclude rare variant signals at complex disease loci.


Conflict of interest statement

The authors have declared that no competing interests exist.

Figures

Fig 1
Fig 1. Generation of simulated genotype data at human gene loci in large sample sizes with HAPGEN2.
Haplotypes were simulated at ‘average’ human protein-coding genes drawn from the center of the distribution of RefSeq gene total exon length (A). Vertical dotted lines in red and green indicate the median and mean values of exon length, respectively. Black bar represents the 24 genes selected for simulation. (B,C) Site frequency spectrum of simulated data, as compared to observed human data. Data were simulated via staged expansion of 1000 Genomes Project haplotypes using the HAPGEN2 software; the mutation parameter was fit to match the site frequency spectrum of protein-coding variation observed in exome sequencing studies, e.g. as reported Nelson et al 2012. Raw simulated data from HAPGEN2 in large sample sizes produced an excess of rare sites; these were down-sampled to match observed data. The grey area in (B) represents the [5%, 95%] interval across all simulated genes, obtained using bootstrapping. The site frequency spectrum of simulated data in a smaller sample size (N = 2.7K) also matched an independent set of observed exome sequencing data from the GoT2D consortium (C). Haplotype structure, as measured by linkage disequilibrium between variants, was also preserved in the simulated data after sample expansion (D). The inset shows a representative example of simulations at the GATA3 gene locus.
Fig 2
Fig 2. Power of different gene-based rare variant association methods at simulated disease loci.
At each gene locus, one hundred independent simulations of phenotypic effects were generated in a sample size of 3K individuals (1.5K cases / 1.5K controls). Variant effects were drawn from varied models of genetic architecture (A-F), hypothesizing different degrees of purifying selection against disease alleles (see Methods). Under models with strong selection, there is a strong inverse correlation between variant frequency and effect size; under weak selection rare variant effects are less skewed. At all loci, genetic variants together contribute 1% of the phenotypic variance underlying a trait with common prevalence (8%; modeled as type 2 diabetes). Power is measured as the fraction out of 100 simulations of each gene in which a gene-based test reported a p-value lower than the significance threshold. In (A-C), causal variants span the full frequency spectrum (including common alleles), and thus rare alleles account for only a fraction of the locus heritability; in (D-E), all causal variants are rare (MAF<1%). In (F), causal variants have bi-directional effects (some increase risk of disease, while others reduce risk).
Fig 3
Fig 3. Power of best-performing gene-based rare variant method as compared to single variant association.
Power is measured across one hundred simulations of phenotypic effects at each of 24 human gene loci in N = 3K samples (as in Fig 2). Under each architecture (AR1, AR2, AR3), the power of the best-performing gene-based test at alpha = 2.5e-06 (SKAT-O) is compared to single variant association (Fisher’s exact) at alpha = 5e-08 (panels A, C, E). No MAF threshold was applied to the single variant association tests; gene-based tests included only variants with MAF<1%. Blue boxplot shows range of power for single variant association across genes simulated; pink shows power of the gene-based test alone; green shows the fraction of loci detected only by gene-based test (and not single variant association); yellow shows the combined power of both gene-based and single variant association. Next to each boxplot (panels B, D, F) are scatterplots on which each simulated locus (under AR1, AR2, and AR3, respectively) is represented as a point based on the minor allele frequency (x-axis) and association p-value (y-axis) of the single most-associated variant (the top individual signal) across the locus. Single variant association detects loci plotted above the upper dotted line (at 5e-08), while gene-based association identifies a distinct subset of loci (those highlighted in pink, where the SKAT-O p-value is <2.5e-06). This latter group of loci are those where the top single variant is preferentially rare (and no common variant association signal exists); right-most scatterplots zoom into this portion of the x-axis (MAF<1%). Similar plots for AR4, AR5, and AR6 are shown in S10 Fig.
Fig 4
Fig 4. Power of gene-based methods as a function of sample size, locus effect size, and neutral variation.
Power was measured across one hundred simulations at each of 24 gene loci (as in Figs 2 and 3). Across all panels above, variant effects were drawn from the architecture model AR2 (assuming moderate selection against causal variants, and thus modest inverse correlation between variant frequency and effect size). In (A), variant effects were sampled at each locus such that the total fraction of phenotypic variance explained by the locus was ~0.5%, 1% (as in Figs 2 and 3) or 2%. In (B), loci were simulated to explain 1% of phenotypic variance in sample sizes of 1.5K cases/1.5K controls (as in Figs 2 and 3) and 5K cases/5K controls. In both (A) and (B), all exonic variants with MAF < 1% were included in the burden test (both causal and non-causal variants, resulting in a fewer than 50% of all tested variants being causal). In (C), non-causal (neutral) variants were selectively removed such that the ratio of causal variants to total variants tested ranged from 0.25 to 1 (only causal variants tested). The gene-based methods each have varied performance under different locus effect sizes, sample sizes, and causal variant filtering scenarios.
Fig 5
Fig 5. Concordance between results of different gene-based methods.
Pairwise correlation coefficients (R2) between the p-values reported by different gene-based association methods under AR2 (moderate selection; shown in (A) and under AR6 (moderate selection and bi-directional phenotypic effects, shown in (B)). P-values above 0.1 are excluded in computation of the correlation. In (C), scatter plots show the results (-log10 of the p-values) reported by a pair of gene-based tests under AR2; p-values below 5e-06 are plotted at 5e-06. Each point represents an individual locus at which both gene-based methods were applied (2400 total points); points of the same color represent different simulations at the same gene loci (e.g. same gene and haplotype structure, but different variant phenotypic effects). Dotted lines mark p = 0.01, such that points above the horizontal line or to the right of the vertical line represent loci at which nominally significant results are reported by the gene-based method. All data above generated in 3K samples (1.5K cases, 1.5K controls).
Fig 6
Fig 6. Properties of loci at which gene-based methods report discordant results.
Characteristics of causal loci at which KBAC (the method with highest mean power at nominal levels of significance) produces discordant results as compared to another gene-based method. Results are shown above for the simulated architecture AR2 in 3K samples. KBAC is compared to the (A) C-ALPHA, (B) BURDEN, and (C) UNIQ gene-based methods. In each comparison, loci are identified at which KBAC (but not the other method) reports a p-value < 0.01, or at which the other method (but not KBAC) reports a p-value < 0.01. For each group of loci, leftmost vioplot shows the distribution of aggregate case:control counts (number of minor alleles observed in cases divided by number of minor alleles observed in controls, for variants with MAF<1%). Middle vioplot shows distribution of case-unique counts (number of observations of alleles that are only present in cases and absent from controls). Rightmost vioplot shows distribution of the top single variant p-value observed for an exonic variant at the locus (log10 scale). Line plots at right show the distribution of variants (MAF < 1%) at representative simulated loci where the methods are discordant. Each line represents a variant; height above line measures the variant’s case counts, while height below measures control counts. Red lines highlight variants which drive the difference in test performance.

References

    1. Purcell S., Cherny S.S. & Sham P.C. Genetic Power Calculator: design of linkage and association genetic mapping studies of complex traits. Bioinformatics 19, 149–50 (2003). - PubMed
    1. Kiezun A. et al. Exome sequencing and the genetic basis of complex traits. Nature Genetics 44, 623–30 (2012). 10.1038/ng.2303 - DOI - PMC - PubMed
    1. Asimit J. & Zeggini E. Rare variant association analysis methods for complex traits. Annual Review of Genetics 44, 293–308 (2010). 10.1146/annurev-genet-102209-163421 - DOI - PubMed
    1. Stitziel N.O., Kiezun A. & Sunyaev S. Computational and statistical approaches to analyzing variants identified by exome sequencing. Genome Biology 12, 227 (2011). 10.1186/gb-2011-12-9-227 - DOI - PMC - PubMed
    1. Rivas M. et al. Deep resequencing of GWAS loci identifies independent rare variants associated with inflammatory bowel disease. Nature Genetics 43, 1066–73 (2011). 10.1038/ng.952 - DOI - PMC - PubMed

Publication types