. 2015;20(8):855-63.
doi: 10.3851/IMP2963. Epub 2015 Apr 23.

How often does treatment of primary HIV lead to post-treatment control?

Affiliations

How often does treatment of primary HIV lead to post-treatment control?

Janine Maenza et al. Antivir Ther. 2015.

Abstract

Background: Post-treatment control of viraemia after discontinuation of antiretroviral therapy begun during primary HIV-1 infection is considered a potential path toward a sustained remission of infection.

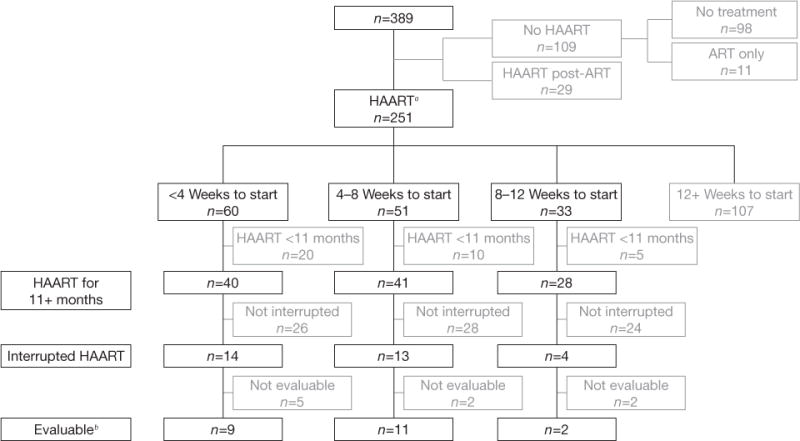
Methods: Subjects enrolled in an observational primary infection cohort who received at least 11 months of highly active antiretroviral therapy beginning within the first 12 weeks of HIV-1 infection and who subsequently discontinued therapy were evaluated for post-treatment control.

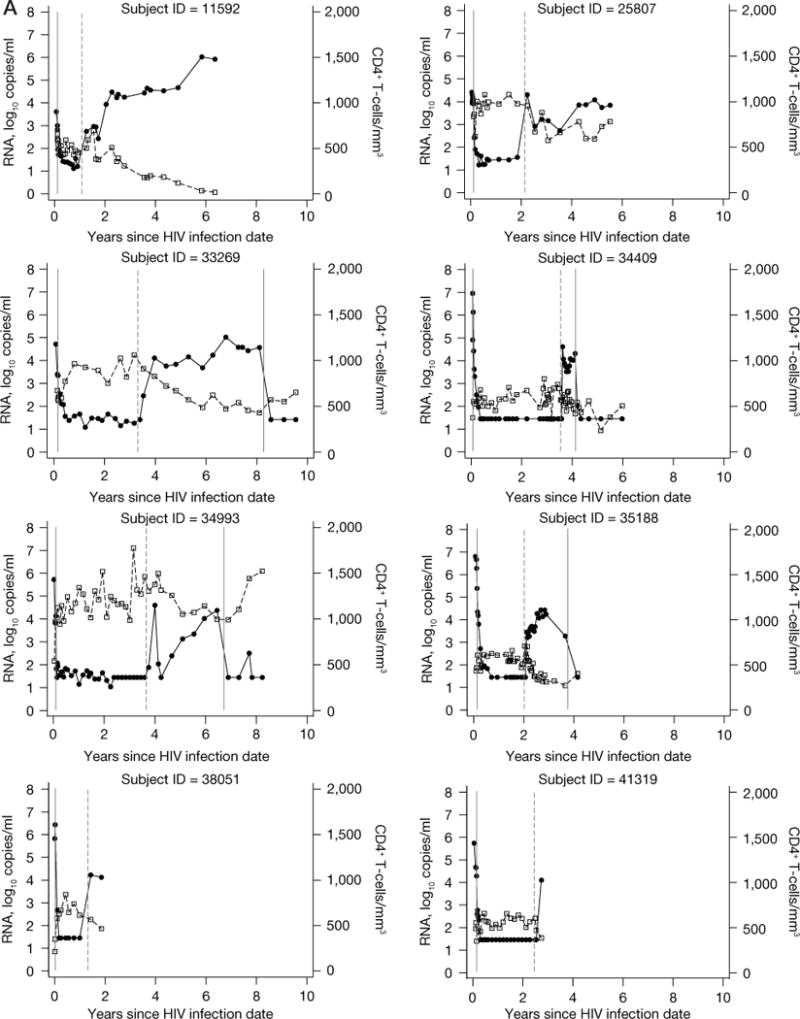
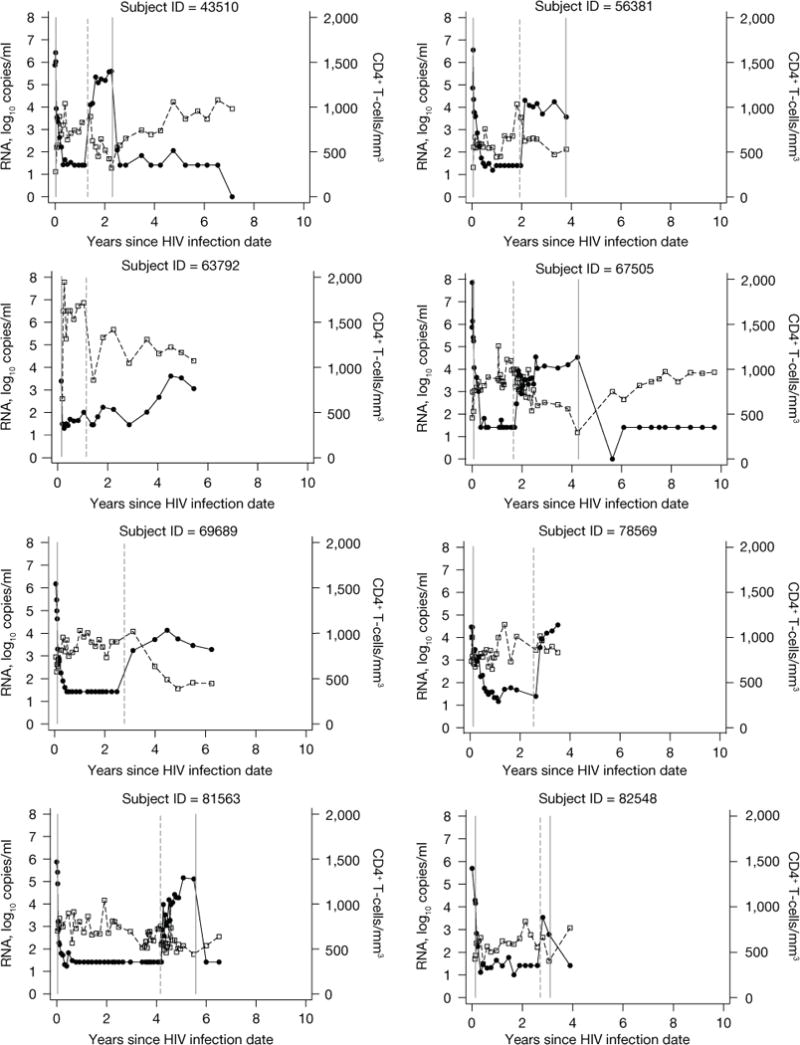
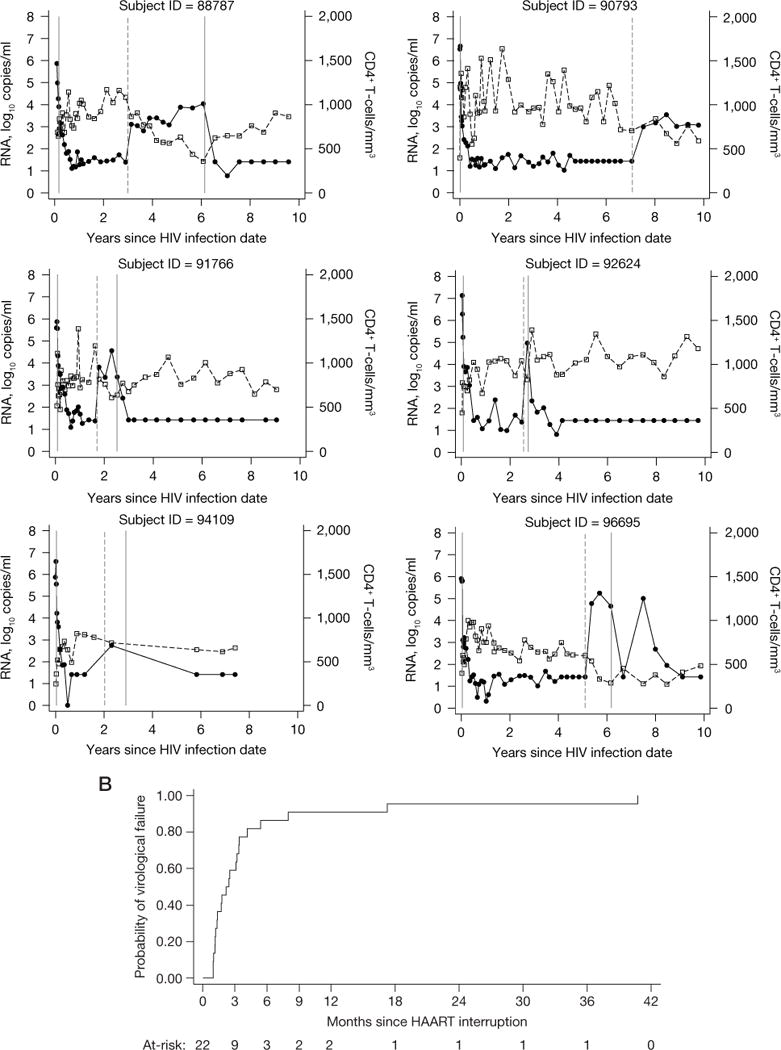
Results: Within a cohort of 389 subjects with primary HIV-1 infection enrolled over 22 years, only 22 met criteria for evaluation of post-treatment control. Among these subjects, 21 (95%) had loss of viral control (HIV-1 RNA>500 copies/ml) within 18 months after treatment discontinuation, and only 1 (4.5%, 95% CI 0.32, 18.9) controlled viral load to levels <500 copies/ml for at least 24 months. The median time to virological failure was 2.17 (IQR 1.18-3.39) months.

Conclusions: Our data suggest a low likelihood of post-treatment control even when highly active antiretroviral therapy is started within 12 weeks of HIV-1 infection.


Conflict of interest statement

Disclosure statement

All authors declare no competing interests.

Figures

Figure 1
Figure 1
Algorithm showing ART initiation and discontinuation among 389 subjects enrolled with primary HIV-1 infection aIndicates highly active antiretroviral therapy (HAART) as first treatment with no preceding non-HAART antiretroviral (ART) regimen. bEvaluable subjects had HIV-1 RNA below the limit of assay quantitation prior to interruption, at least 2 weeks of interruption, and an HIV-1 RNA measurement prior to any treatment re-initiation.
Figure 2
Figure 2
Data from 22 subjects evaluated for post-treatment control and Kaplan–Meier curve showing the cumulative probability of virological failure (A) Data from 22 subjects evaluated for post-treatment control are shown. HIV-1 RNA data shown as closed circles. CD4 lymphocyte data shown as open squares. The first solid vertical line indicates highly active antiretroviral therapy (HAART) initiation in all subjects. The dashed vertical line indicates HAART interruption. The last solid vertical line indicates treatment re-initiation (for those subjects who re-started antiretroviral therapy while still in follow-up). (B) A Kaplan–Meier curve showing the cumulative probability of virological failure. The number of subjects at-risk at each time point is shown below the figure.
Figure 2
Figure 2
Data from 22 subjects evaluated for post-treatment control and Kaplan–Meier curve showing the cumulative probability of virological failure (A) Data from 22 subjects evaluated for post-treatment control are shown. HIV-1 RNA data shown as closed circles. CD4 lymphocyte data shown as open squares. The first solid vertical line indicates highly active antiretroviral therapy (HAART) initiation in all subjects. The dashed vertical line indicates HAART interruption. The last solid vertical line indicates treatment re-initiation (for those subjects who re-started antiretroviral therapy while still in follow-up). (B) A Kaplan–Meier curve showing the cumulative probability of virological failure. The number of subjects at-risk at each time point is shown below the figure.

References

    1. Sáez-Cirión A, Bacchus C, Hocqueloux L, et al. Post-treatment HIV-1 controllers with a long-term virological remission after the interruption of early initiated antiretroviral therapy ANRS VISCONTI study. PLoS Pathog. 2013;9:e1003211. - PMC - PubMed
    1. Kaslow RA, Carrington M, Apple R, et al. Influence of combinations of human major histocompatibility complex genes on the course of HIV-1 infection. Nat Med. 1996;2:405–411. - PubMed
    1. Migueles SA, Sabbaghian MS, Shupert WL, et al. HLA B*5701 is highly associated with restriction of virus replication in a subgroup of HIV-infected long term nonprogressors. Proc Natl Acad Sci U S A. 2000;97:2709–2714. - PMC - PubMed
    1. Schacker T, Collier AC, Hughes J, Shea T, Corey L. Clinical and epidemiologic features of primary HIV infection. Ann Intern Med. 1996;125:257–264. - PubMed
    1. Schacker TW, Hughes JP, Shea T, Coombs RW, Corey L. Biological and virologic characteristics of primary HIV infection. Ann Intern Med. 1998;128:613–620. - PubMed

Publication types