. 2015 Apr 24:6:6936.
doi: 10.1038/ncomms7936.

Biodiversity enhances ecosystem multifunctionality across trophic levels and habitats

Affiliations

Biodiversity enhances ecosystem multifunctionality across trophic levels and habitats

Jonathan S Lefcheck et al. Nat Commun. .

Abstract

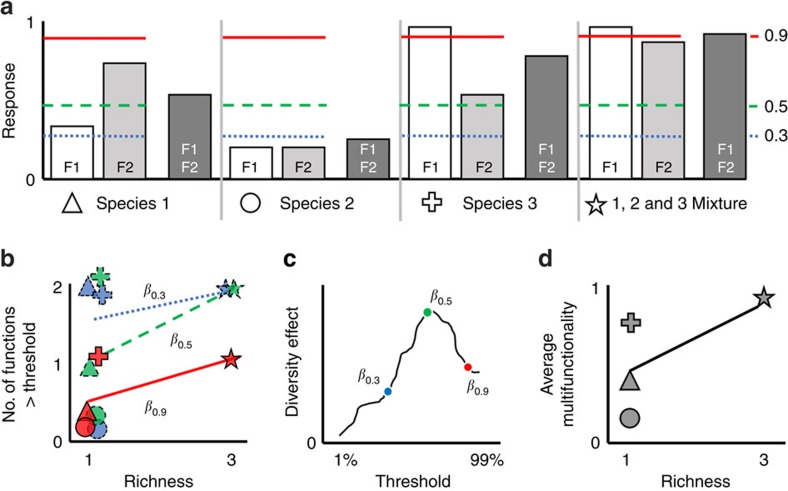
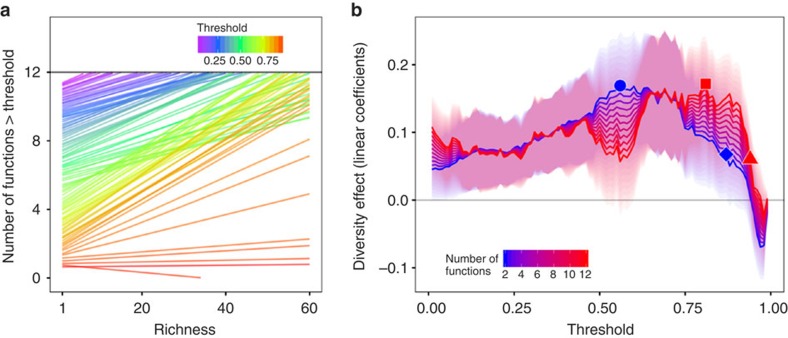
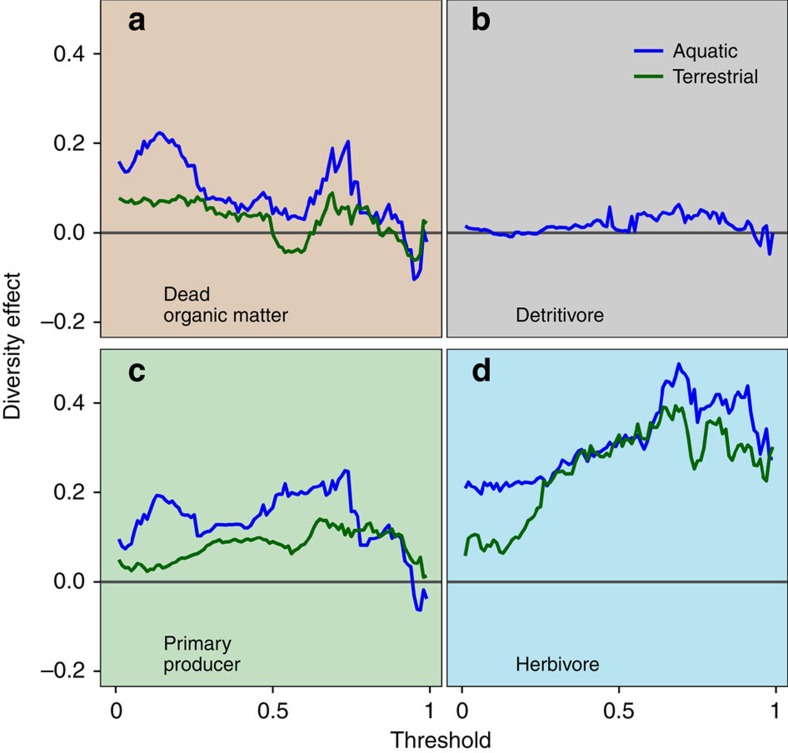
The importance of biodiversity for the integrated functioning of ecosystems remains unclear because most evidence comes from analyses of biodiversity's effect on individual functions. Here we show that the effects of biodiversity on ecosystem function become more important as more functions are considered. We present the first systematic investigation of biodiversity's effect on ecosystem multifunctionality across multiple taxa, trophic levels and habitats using a comprehensive database of 94 manipulations of species richness. We show that species-rich communities maintained multiple functions at higher levels than depauperate ones. These effects were stronger for herbivore biodiversity than for plant biodiversity, and were remarkably consistent across aquatic and terrestrial habitats. Despite observed tradeoffs, the overall effect of biodiversity on multifunctionality grew stronger as more functions were considered. These results indicate that prior research has underestimated the importance of biodiversity for ecosystem functioning by focusing on individual functions and taxonomic groups.


Figures

Figure 1
Figure 1. A conceptual illustration of the quantitative methods used to characterize multifunctionality.
(a) A simple biodiversity experiment manipulating three species alone and all three in mixture, and measuring two ecosystem functions (F1 and F2) scaled between 0 and 1. Thresholds for 30%, 50% and 90% of the maximum observed level of functioning are denoted as the blue dotted, green dashed and red solid lines, respectively. A grand mean (dark grey bar) is taken across the two individual functions (white and light grey bars). (b) The number of functions exceeding a given threshold is plotted for each treatment, and regressed against richness. A positive slope (β) represents a positive effect of biodiversity on the number of functions exceeding a selected threshold. Line types correspond to threshold level in a. (c) The linear coefficients (β) from each regression in c are plotted against the corresponding threshold. In this case, all thresholds have been calculated from 1 to 99%, and the three coefficients from b are noted. (d) The grand mean from a is plotted for each treatment, and regressed against richness. A positive slope represents a positive effect of biodiversity on average multifunctionality.
Figure 2
Figure 2. A threshold-based approach to multifunctionality revealed strong effects of biodiversity, which increased with an increasing number of functions.
(a) The raw number of functions greater than a threshold against richness, for thresholds ranging from 1% of the maximum (purple lines) to 99% of the maximum (red lines). Lines are predicted fits from GLMMs that fixed the covariate number of functions at 12. (b) The biodiversity effect (expected change in the number of functions exceeding a threshold with addition of one species) against threshold. Each point corresponds to the slope of a single regression of the number of functions greater than a given threshold against richness, from 2 (blue) to 12 (red) numbers of functions. The red line corresponding to 12 functions summarizes the slopes of each line from a. Shaded regions represent 95% confidence intervals. The circle represents the threshold of the maximum biodiversity effect observed for two functions (56%), and the square the threshold of maximum biodiversity effect for 12 functions (81%). The diamond represents the threshold at which the biodiversity effect was still significantly positive for two functions (87%), and the triangle the threshold for 12 functions (94%).
Figure 3
Figure 3. Comparison of the effect of richness on the number of functions above a threshold revealed strongest effects for herbivores, and consistent effects across habitat.
The effect of biodiversity (linear coefficient regressing the number of functions above a threshold against richness) plotted against the continuum of thresholds from 1 to 99% of the maximum observed level of functioning, for (a) dead organic matter, (b) detritivores, (c) primary producers and (d) herbivores. Blue lines represent trends from experiments conducted in aquatic systems, and green lines from terrestrial systems.

References

    1. Hooper D. U. et al.. Effects of biodiversity on ecosystem functioning: a consensus of current knowledge. Ecol. Monogr. 75, 3–35 (2005).
    1. Cardinale B. J. et al.. Effects of biodiversity on the functioning of trophic groups and ecosystems. Nature 443, 989–992 (2006). - PubMed
    1. Balvanera P. et al.. Quantifying the evidence for biodiversity effects on ecosystem functioning and services. Ecol. Lett. 9, 1146–1156 (2006). - PubMed
    1. Worm B. et al.. Impacts of biodiversity loss on ocean ecosystem services. Science 314, 787–790 (2006). - PubMed
    1. Cardinale B. J. et al.. The functional role of producer diversity in ecosystems. Am. J. Bot. 98, 572–592 (2011). - PubMed

Publication types