. 2015 Oct 1:87:83-95.
doi: 10.1016/j.ymeth.2015.04.014. Epub 2015 Apr 20.

Rapid and comprehensive 'shotgun' lipidome profiling of colorectal cancer cell derived exosomes

Affiliations

Rapid and comprehensive 'shotgun' lipidome profiling of colorectal cancer cell derived exosomes

Todd A Lydic et al. Methods. .

Abstract

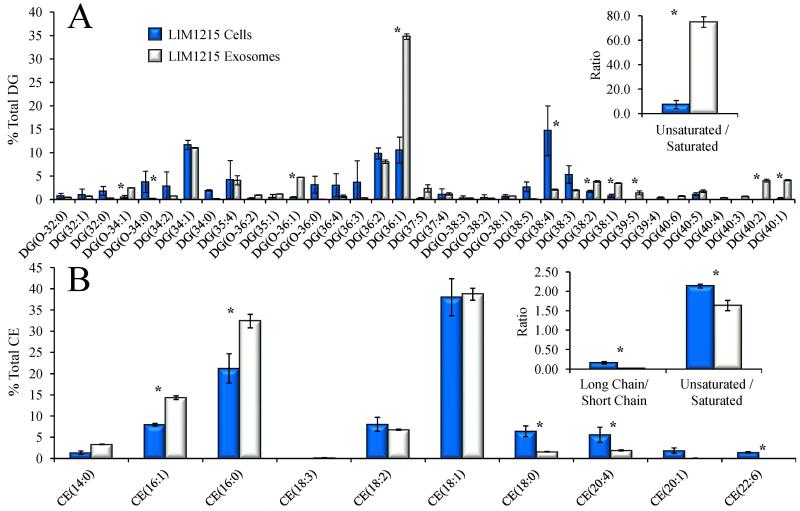
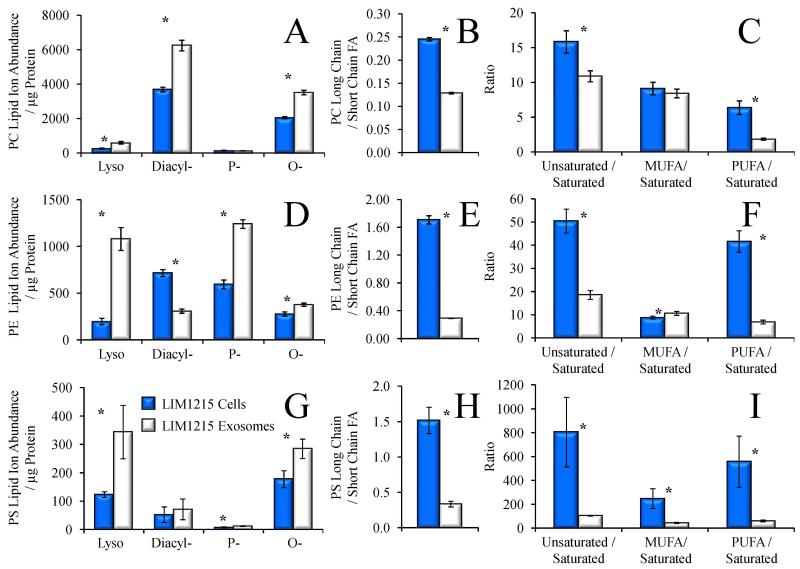
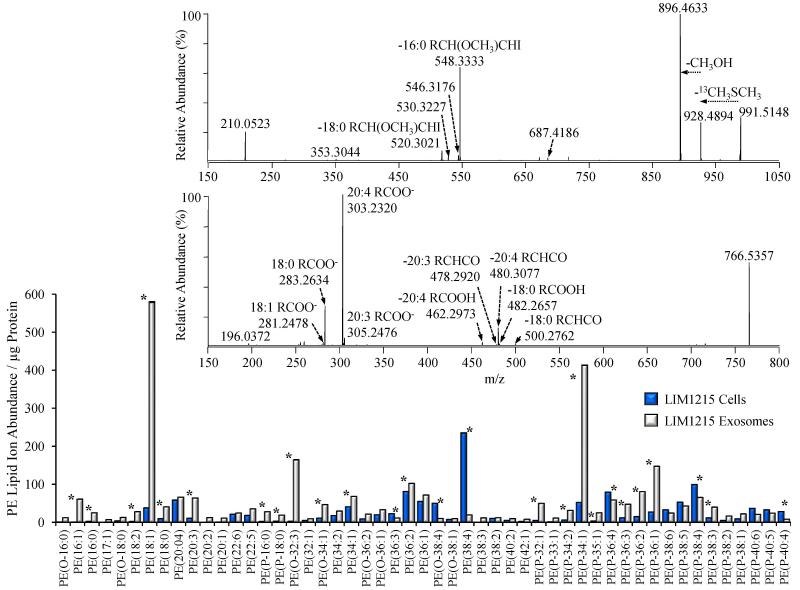
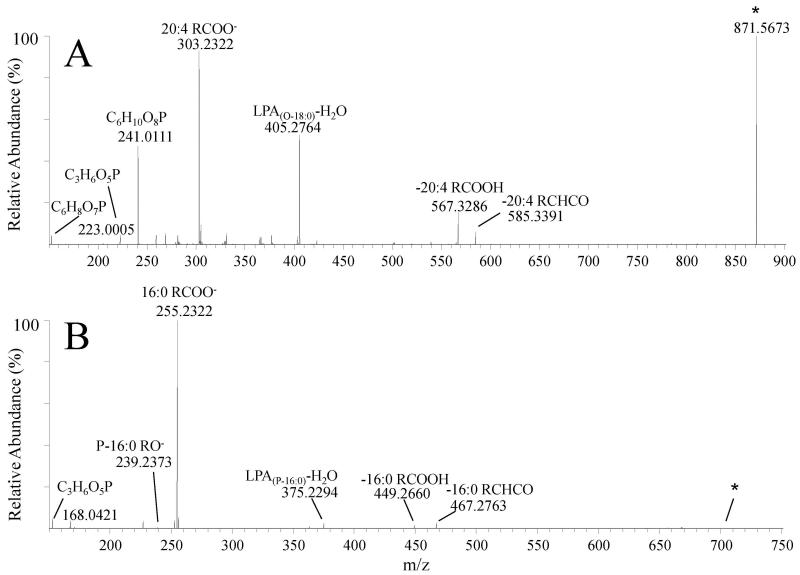
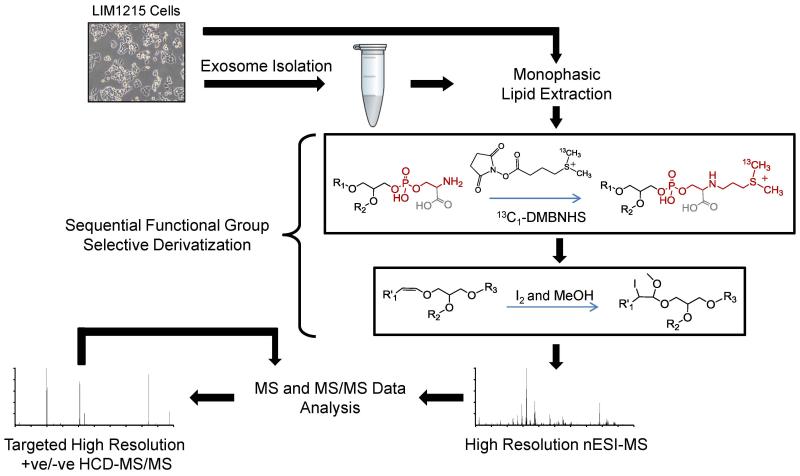
There is an increasing recognition of the role that cancer cell derived exosomes play in intercellular signaling upon fusion or uptake with a target cell, including immune system evasion, tumor growth and metastasis. To date, however, although exosomal membrane and cargo lipids are expected to play a pivotal role in exosome biogenesis and secretion, as well as in fusion or uptake and target cell functional response, the detailed characterization of cancer cell derived exosome lipids across a range of different cancers has not yet been broadly explored. Here, a simple and straightforward lipidome analysis strategy consisting of optimized sample extraction and novel sample derivatization techniques, coupled with high-resolution 'shotgun' mass spectrometry and 'targeted' tandem mass spectrometry methods, is demonstrated for the rapid identification of >520 individual lipids in 36 lipid classes and sub classes from exosomes secreted by the colorectal cancer cell line, LIM1215. Relative quantification and comparison of exosome versus cellular lipid profiles reveals significant enrichment of certain lipid classes, as well as substantial lipid subclass remodeling and changes in abundance of individual lipids, including sphingolipids, sterol lipids, glycerolipids and glycerophospholipids, and particularly plasmalogen- and alkyl ether-containing glycerophospholipids. This analysis strategy therefore provides a platform for comprehensive lipidome profiling across a wide range of cancer cell or tissue derived exosomes, that will facilitate subsequent functional studies aimed at elucidating the role of specific cellular or exosome lipids in the onset and progression of colorectal cancer, or to identify specific lipid(s) that could serve as effective diagnostic or prognostic disease biomarkers.

Keywords: Colorectal cancer; Exosome; Lipidome; Mass spectrometry.


Figures

Figure 1
Figure 1
Characterization of exosomes secreted by LIM1215 colorectal cancer cells. A) Western blotting analysis of the exosome markers Alix and TSG101. B) TEM analysis to confirm the presence of membranous vesicles in the range of 40-100 nm in diameter.
Figure 2
Figure 2
Positive ionization mode high resolution / accurate mass spectra of lipid extracts from A) LIM1215 cells and B) LIM1215 secreted exosomes. Cell and exosome total lipid extracts were derivatized with 13C1-DMBNHS and iodine/methanol, then diluted to achieve approximately equal lipid concentrations prior to analysis. High resolution (R=100,000) accurate mass spectra were acquired and averaged for a period of 2 minutes each. PC(28:0) (500 nM) was include as an internal standard (I.S.) # Non-lipid variable background ion.
Figure 3
Figure 3
Global lipidome analysis of LIM1215 cells and secreted exosomes. A: Pie chart representing the distribution of summed ion abundances of glycerolipid, glycerophospholipid, sphingolipid and sterol lipid classes, for all lipids detected in A) LIM1215 cells and B) LIM1215 secreted exosomes. The area of each pie chart is proportional to the total lipid ion abundance, normalized to protein concentration. C) Comparison of the total normalized summed ion abundances for each lipid class from the data in Figure 1. LIM1215 cells are shown in dark bars and LIM1215 secreted exosomes are shown in white bars. The inset to panel C shows an expanded vertical axis to allow comparison of low abundance lipid classes. Error bars show the standard deviations determined by triplicate analytical replicate measurement. * P < 0.05.
Figure 4
Figure 4
Comparison of the % total individual A) sphingomyelin (SM) and B) ceramide (Cer) lipid species in LIM1215 cells (dark bars) and LIM1215 secreted exosomes (white bars) assigned by positive ionization mode high resolution / accurate mass spectrometry from the data in Figure 1. Only the most abundant lipids are shown for clarity. The insets to each panel show the ratio of the total lipid ion abundances (normalized to protein) of species that contain at least one long chain fatty acid (≥ 20 carbons) to species that contain only short chain fatty acids, and the ratio of the abundances of species containing at least one unsaturated fatty acid to species containing only saturated fatty acids. Error bars show the standard deviations determined by triplicate measurement. * P < 0.05.
Figure 5
Figure 5
Comparison of the % total individual A) diglyceride (DG) and B) cholesterol ester (CE) molecular species in LIM1215 cells (dark bars) and LIM1215 secreted exosomes (white bars) detected as ammonium adducts by positive ionization mode high resolution / accurate mass spectrometry from the data in Figure 1. Only the most abundant lipids are shown for clarity. The inset to panel A shows the ratio of the total lipid ion abundances (normalized to protein) of DG species that contain at least one unsaturated fatty acid to species containing only saturated fatty acids. The inset to panel B shows the ratio of the total lipid ion abundances (normalized to protein) of CE species that contain at least one long chain fatty acid (≥ 20 carbons) to species that contain only short chain fatty acids, and the ratio of the abundances of species containing at least 1 unsaturated fatty acid to species containing only saturated fatty acids. Error bars show the standard deviations determined by triplicate measurement. * P < 0.05.
Figure 6
Figure 6
Characterization of phospholipid subclasses and fatty acid ratios from the data in Figure 1. Comparison of A) the total lipid ion abundances (normalized to protein) of PC lyso-, diacyl-, plasmalogen (P-), and alkyl ether (O-) subclasses, B) the ratio of the total abundance of PC species containing at least one long chain fatty acid (≥ 20 carbons) to PC species containing only short chain fatty acids, and C) the ratio of the abundance of PC species containing at least one unsaturated double bond to PC species containing only saturated fatty acids in LIM1215 cells (dark bars) and LIM1215 secreted exosomes (white bars). Comparison of D) the lipid ion abundance (normalized to protein) of PE lyso-, diacyl-, plasmalogen (P-), and alkyl ether (O-) subclasses, E), the ratio of the abundance of PE species containing at least one long chain fatty acid (≥ 20 carbons) to PE species containing only short chain fatty acids, and F) the ratio of the abundance of PE species containing at least one unsaturated double bond to PE species containing only saturated fatty acids in LIM1215 cells (dark bars) and LIM1215 secreted exosomes (white bars). MUFA, monounsaturated fatty acid. PUFA, polyunsaturated fatty acid. Error bars show the standard deviations determined by triplicate measurement. * P < 0.05.
Figure 7
Figure 7
Identification of LIM1215 cell and secreted exosome PE, P-PE, O-PE, LPE, P-LPE and O-LPE lipid species by high resolution / accurate mass HCD-MS/MS. Only the top 50 most abundant lipids are shown for clarity. Comparison of the total lipid ion abundances (normalized to protein) of PE molecular species in LIM1215 cells (dark bars) and LIM1215 secreted exosomes (white bars) assigned by positive ionization mode accurate mass spectrometry from the data in Figure 1. Error bars show the standard deviations determined by triplicate measurement. * P < 0.05. Top Inset: Positive ionization mode high resolution (R=100,000) HCD-MS/MS analysis to confirm the identity of the assigned PE(P-34:1) lipid, acquired from the LIM1215 exosome lipid extract derivatized with 13C1-DMBNHS and iodine/methanol. Bottom Inset: Negative ionization mode high resolution (R=100,000) HCD-MS/MS analysis to confirm the identity of the assigned PE(38:4) lipid, acquired from an underivatized LIM1215 cell lipid extract. Key product ions used for structural characterization are labeled.
Figure 8
Figure 8
Confirmation of accurate mass ‘sum’ composition assignments and structural characterization of LIM1215 cell and secreted exosome atypical ether-linked lipids (A) PI(O-38:4) acquired from an underivatized LIM1215 cell lipid extract (assigned as PI(O-18:0_20:4)) and (B) PG(P-32:0) acquired from an underivatized LIM1215 exosome lipid extract (assigned as PG(P-16:0_16:0)), by high resolution / accurate mass negative ion mode HCD-MS/MS. Key product ions used for structural characterization are labeled.
Scheme 1
Scheme 1
Workflow for lipidome analysis of secreted exosomes and their parent cells. After exosome isolation by ultracentrifugation, exosomes and their parent cells are subjected to monophasic lipid extraction, followed by sequential functional group selective derivatization of aminophospholipids with 13C1-DMBNHS, and plasmalogen 1-alk-enyl double bonds with iodine and methanol. Derivatized lipid extracts are then analyzed in positive ionization mode by direct infusion nESI-high resolution / accurate mass Orbitrap MS, and assigned lipid identities are confirmed by ‘targeted’ higher-energy collisional dissociation - tandem mass spectrometry (HCD-MS/MS).

References

    1. Santos CR, Schulze A. Lipid metabolism in cancer. FEBS J. 2012;279:2610–2623. - PubMed
    1. Currie E, Schulze A, Zechner R, Walther TC, Farese RV. Cellular fatty acid metabolism and cancer. Cell Metab. 2013;18:153–161. - PMC - PubMed
    1. Fritz V, Fajas L. Metabolism and proliferation share common regulatory pathways in cancer cells. Oncogene. 2010;29:4369–4377. - PMC - PubMed
    1. Ruggieri S, Mugnai G, Mannini A, Calorini L, Fallani A, Barletta E, Mannori G, Cecconi O. Lipid Characteristics in Metastatic Cells. Clin. Exp. Metastasis. 1999;17:271–276. - PubMed
    1. Roos DS, Choppin PW. Tumorigenicity of cell lines with altered lipid composition. Proc. Natl. Acad. Sci. USA. 1984;81:7622–7626. - PMC - PubMed

Publication types

MeSH terms